Left Further Behind - Child Poverty Action Group
Left Further Behind - Child Poverty Action Group
Left Further Behind - Child Poverty Action Group

You also want an ePaper? Increase the reach of your titles
YUMPU automatically turns print PDFs into web optimized ePapers that Google loves.
<strong>Left</strong><br />
further<br />
behind:<br />
how policies fail the<br />
poorest children in<br />
New Zealand<br />
A <strong>Child</strong> <strong>Poverty</strong> <strong>Action</strong> <strong>Group</strong> Monograph<br />
Edited by M.Claire Dale, Mike O'Brien and Susan St John
<strong>Child</strong> <strong>Poverty</strong> <strong>Action</strong> <strong>Group</strong> (Inc) (CPAG) is a non-profit group formed in 1994, and made up of<br />
academics, activists, practitioners and supporters. CPAG has a strong education and research role<br />
which enables it to contribute to better informed social policy to support children in Aotearoa New<br />
Zealand, specifically children who live in poverty. CPAG believes that our high rate of child poverty is<br />
not the result of economic necessity, but is due to policy neglect and a flawed ideological emphasis<br />
on economic incentives. Through research, CPAG highlights the position of tens of thousands of New<br />
Zealand children, and promotes public policies that address the underlying causes of the poverty<br />
they live in. If you are not already supporting CPAG and you would like to make a donation to assist<br />
with ongoing work, please contact us at the address below or through our website: www.cpag.org.nz.<br />
Disclaimer: This publication is intended to provide accurate and adequate information on the matters contained herein and<br />
every effort has been made to ensure its accuracy. However, it has been written, edited and published and made available<br />
to all persons and entities strictly on the basis that its authors, editors and publishers are fully excluded from any liability or<br />
responsibility by all or any of them in any way to any person or entity for anything done or omitted to be done by any person<br />
or entity in reliance, whether totally or partially, on the contents of this publication for any purpose whatsoever.<br />
<strong>Left</strong> <strong>Further</strong> <strong>Behind</strong>: How New Zealand is failing its children.<br />
ISBN 0-9582263-9-3<br />
© September 2011<br />
<strong>Child</strong> <strong>Poverty</strong> <strong>Action</strong> <strong>Group</strong> Inc.<br />
PO Box 5611<br />
Wellesley Street<br />
Auckland 1141.<br />
www.cpag.org.nz<br />
iii
Preface<br />
<strong>Child</strong> <strong>Poverty</strong> <strong>Action</strong> <strong>Group</strong> (CPAG) publishes this report on the state of New Zealand<br />
children and the policies that affect them at a very worrying time in our history.<br />
<strong>Child</strong>ren and families have been affected badly not only by a protracted recession<br />
but also by two major earthquakes. The economic outlook remains uncertain and<br />
the evidence from social agencies is that they have never been busier in dealing with<br />
social distress among our families and youth.<br />
This report supplements the series of CPAG publications examining policies as they affect children,<br />
and recommending ways forward that would provide better outcomes. The first two major publications:<br />
Our <strong>Child</strong>ren: The Priority for Policy, 2001; and the update of that in 2003, were followed by Room<br />
for improvement: Current New Zealand housing policies and their implications for our children. Cut<br />
price kids, in 2004, challenged the Government’s “Working for Families” (WFF) policies to work for<br />
children. In 2005, Hard to swallow brought foodbank use in New Zealand to public attention, and<br />
Workfare: Not fair for kids? looked at how the WFF policies were actually impacting on the poorest<br />
families. Three years later, in 2008, <strong>Left</strong> behind: How social and income inequality damage New<br />
Zealand children, took a wider view across the macroeconomy to explore the lives of children, and<br />
found that in many areas, we had become world leaders in the worst outcomes, including child<br />
health and child harm. In What work counts? in 2010, the impact of so-called “work incentives” on<br />
sole parent families was the focus. This was followed in July 2011 with Hunger for Learning, which<br />
showed how necessary it is for schools in low income areas to provide food for their children: brains<br />
require actual food as well as information.<br />
This unfolding reality of continuing and significant hardship for the 200,000 of the poorest children<br />
in this country and their families has driven the publication of <strong>Left</strong> <strong>Further</strong> <strong>Behind</strong>, 2011. This latest<br />
contribution updates <strong>Left</strong> <strong>Behind</strong> (2008) and also broadens the focus to provide new insights into the<br />
wide range of issues that affect children. It offers critical analysis of the state of New Zealand children<br />
in 2011 and the effectiveness of family and social policy. It provides strong recommendations for the<br />
way forward.<br />
Much government policy since the advent of 'Rogernomics' in the 1980s has been dangerously<br />
narrow and selective in both its definition of work, and its insistence on the singular importance of<br />
paid work as the way out of poverty. In <strong>Left</strong> <strong>Behind</strong> 2008 we wrote in the preface:<br />
CPAG believes that making a paid job the only way to access sufficient income to care for children<br />
is flawed and directly damaging to children. Until this ideology is abandoned, New Zealand will<br />
continue to suffer from the high economic, social and personal costs of child poverty.<br />
Unfortunately, since 2008, intensification of the work-based philosophy, with proposed welfare<br />
reforms promising to further impact on the well-being of poor children and their families, has been<br />
accompanied by fewer jobs available in the far less favourable economic times. For the sake of New<br />
Zealand’s future, CPAG urges the government, politicians and the wider New Zealand community to<br />
take the messages of this report seriously.<br />
1
CPAG is fortunate to be able to draw on the experts in each of the fields covered. The editors,<br />
Associate Professor Mike O’Brien, Counselling, Human Services and Social Work University of<br />
Auckland, Dr M.Claire Dale and Associate Professor Susan St John of the University Auckland, have<br />
extensive backgrounds in economic and social policy. In addition to the editors, CPAG members who<br />
have contributed chapters are Professor Innes Asher, Dr Nikki Turner, Dr Nicholas Fancourt, Alan<br />
Johnson, Dr Vicki Carpenter, Professor Martin Thrupp, Julie Timmins, Donna Wynd, and Dr Steve<br />
Poletti.<br />
We are also fortunate to have assistance and contributions from Dr Louise Humpage, Mamari<br />
Stephens, Dr Teuila Percival, Beth Wood, Andrew Familton, Michael Fletcher, Catriona MacLennan,<br />
Frances Joychild, Katie Bach, Dr Simon Denny, Associate Professor Sally Merry, Professor Jenny<br />
Ritchie, Lucie Trask, Nicola Slight, Sarah Larson, Caleb McConnell, and John Pearce.<br />
We are grateful to Janfrie Wakim, Michael Littlewood, Vicki St John, and our final proof-reader, Sue<br />
Osborne, for their skilled assistance. CPAG acknowledges the many helpful comments on drafts<br />
of this publication from different sources. While each chapter, and any errors therein, is the sole<br />
responsibility of the authors, the recommendations that flow from each chapter are strongly endorsed<br />
by CPAG.<br />
CPAG also acknowledges the enormous contribution made by Apropos to the presentation of this<br />
publication, as well as to previous publications, and to our website. Their ongoing support and<br />
occasional critique has been invaluable.<br />
<strong>Further</strong> thanks go to the John McLachlan Charitable Trust and the Clyde Graham Charitable Trust,<br />
both administered by the Guardian Trust, which have contributed to the production costs of this<br />
publication.<br />
Finally, the Editors of this publication and the CPAG Management Committee take this opportunity to<br />
recognise the support provided by the J R McKenzie Trust and the wider CPAG community, and to<br />
thank them for their contributions.<br />
CPAG’s publications are available to download, free, from the website: www.cpag.org.nz<br />
Our <strong>Child</strong>ren: The Priority for Policy 2001; 2003<br />
Room for improvement: Current New Zealand housing policies and their<br />
implications for our children<br />
2003<br />
Cut price kids: Does the 2004 “Working for Families” budget work for children? 2004<br />
Hard to swallow: Foodbank use in New Zealand 2005<br />
Workfare: Not fair for kids? 2005<br />
<strong>Left</strong> behind: How social and income inequality damage New Zealand children 2008<br />
What work counts? Work incentives and sole parent families 2010<br />
Hunger for Learning. Nutritional barriers to children’s education 2011<br />
<strong>Left</strong> <strong>Further</strong> <strong>Behind</strong>: how policies fail for the poorest children in New Zealand 2011<br />
2
Executive Summary<br />
In 2008, <strong>Child</strong> <strong>Poverty</strong> <strong>Action</strong> <strong>Group</strong> produced <strong>Left</strong> <strong>Behind</strong>, which reflected the<br />
position of children in New Zealand. Three years later, the lack of substantial progress<br />
on so many issues facing children in this country leads us to rewrite and update that<br />
publication. In this report we reflect what is required to ensure all children have the<br />
resources and opportunities to grow and to develop their potential. Recent years<br />
and recent policy approaches have focused heavily on supporting, and sometimes<br />
forcing, parents (especially lone parents) into paid work. The needs and interests of<br />
children require a much broader approach. And in the interests of both children and<br />
parents, the work of caring for children needs to be given adequate recognition and<br />
support. <strong>Child</strong>ren’s wellbeing must be central, whether parents are in paid work or<br />
not.<br />
The core message of this publication is simple: ALL children, irrespective of the status and position<br />
of their parent/carer, are entitled to the best possible support from their parent/s and all New Zealand<br />
society. Together, we share responsibility for ensuring that children are given that support. While<br />
charity can make a useful contribution to assist and support children and families experiencing<br />
particular stresses, it cannot solve the problem of poverty, and poverty is the major problem facing<br />
around 200,000 New Zealand children. That solution requires collective action from families and<br />
communities; and it requires a commitment from the Government to make investing in our children<br />
the highest priority.<br />
This publication traverses a wide range of issues affecting our children, including: incomes, health,<br />
housing, education, parental support, social hazards, and the lack of job opportunities for young<br />
people; and is built around the idea of putting children at the centre of policy decisions. None of the<br />
issues can be tackled in isolation. A concerted and coordinated approach to reducing child poverty<br />
and improving the wellbeing and opportunities for all children is required. Without such an approach,<br />
children will suffer unnecessarily and New Zealand will be poorer economically, culturally and socially.<br />
While each chapter addresses specific issues and recommendations for change (collected as a<br />
Summary at the end of this publication), seven key recommendations emerge:<br />
• Monitor major indicators of child poverty and report these on a regular basis with specific<br />
target reductions to be met on the way to ending child poverty by 2020; and fund child-impact<br />
assessments of existing and future national and local policies;<br />
• Create a senior Cabinet position with responsibility for children, such as a Minister for <strong>Child</strong>ren, to<br />
support the move toward a child-centred approach to policy and legislation;<br />
• Remove work-based rules for child financial assistance and pay the equivalent of the In-Work-<br />
Tax-Credit to all low income families. Simplify administration of tax credits.<br />
3
• Acknowledge the vital social and economic contribution made by good parenting; ensure that<br />
accessible, affordable, culturally appropriate, high quality early childhood care and education,<br />
including kohanga reo and Playcentre, is available to all children and families; and ensure that<br />
training allowances support sole parents’ education where appropriate;<br />
• Provide free access to healthcare for all children under age six, 24 hours a day, 7 days a week;<br />
• The Government develop and fund a national housing plan to address the emerging housing<br />
shortages identified by the Department of Building. Meanwhile, ensure that housing is affordable<br />
and appropriate (eg address overcrowding, dampness, cold);<br />
• Provide adequate funding for low decile schools to ensure that all children have access to high<br />
quality education.<br />
4
Contents<br />
Preface 1<br />
Executive Summary 3<br />
PART ONE 6<br />
Chapter 1. Introduction 6<br />
Chapter 2. <strong>Child</strong> poverty and inequality 11<br />
Chapter 3. Work, Families and <strong>Poverty</strong> 26<br />
Chapter 4. The Whānau Ora Approach 33<br />
Chapter 5. New Zealand Pacific <strong>Child</strong>ren and Their Families 45<br />
PART TWO 51<br />
Chapter 6. Working for Families 51<br />
Chapter 7. Paid Parental Leave in New Zealand: catching up with Australia? 76<br />
Chapter 8. Reforming <strong>Child</strong> Support 82<br />
Chapter 9. Tax Reform and the macro economy: Heaven help the children 91<br />
PART THREE 104<br />
Chapter 10. <strong>Poverty</strong> and violence, and children 104<br />
Chapter 11. Families, <strong>Child</strong>ren, and the Law 114<br />
Chapter 12. <strong>Child</strong> Health and <strong>Poverty</strong> 122<br />
Chapter 13. Housing poverty and children 137<br />
Chapter 14. The impact of social hazards on children 147<br />
PART FOUR 159<br />
Chapter 15. Early childhood care and education 159<br />
Chapter 16. A turn for the worse? Some recent developments in<br />
the school sector 175<br />
Chapter 17. Youth and employment 182<br />
PART FIVE 190<br />
Chapter 18. The costs of child poverty 190<br />
Summary of Chapter Recommendations 206<br />
References 213<br />
5
PART ONE<br />
Chapter 1. Introduction<br />
Overview<br />
This report comes out in 2011, three years after <strong>Child</strong> <strong>Poverty</strong> <strong>Action</strong> <strong>Group</strong>’s (CPAG) report, <strong>Left</strong><br />
<strong>Behind</strong>, 2008; and four years after the New Zealand government completed the rollout of its flagship<br />
family assistance policy, ‘Working for Families’ (WFF). That policy, introduced with a raft of other<br />
policies such as increased subsidies for housing, childcare and health, recognised child poverty as a<br />
serious problem. There was a large increase in spending so that concerns about child poverty should<br />
have been well on the way to relegation to the annals of history.<br />
Unfortunately, CPAG’s 2008 report provided ample evidence<br />
that despite WFF and other family-related policies, the poorest<br />
children were left behind relative to their peers. The full benefits<br />
of the WFF package are available only to those families who<br />
meet a work-test, thus widening the gap between families ’in<br />
work’ and others; between those seen as ‘deserving’ and the<br />
‘undeserving’. Nothing has changed to correct this situation but,<br />
in the meantime, New Zealand has suffered from a protracted<br />
recession and some serious natural disasters. Reports from<br />
frontline social services suggest child poverty has worsened in<br />
the economic downturn making the need for action even more<br />
pressing. For all the reasons outlined in this report, it is of grave<br />
concern that child poverty is now even more entrenched and<br />
difficult to address.<br />
As employment opportunities for sole parents and young people evaporated in the economic<br />
downturn, the rhetoric around ‘welfare dependency’ intensified. The Minister of Social Development’s<br />
Future Focus literature (Bennett, 2010), and the Welfare Working <strong>Group</strong>’s final report (Welfare<br />
Working <strong>Group</strong>, 2011) for example, give almost exclusive priority to paid work as the route out of<br />
poverty. While it is agreed that paid work is an important factor in family well-being, the focus is too<br />
narrow and will not solve the problem of child poverty.<br />
What tends to operate now in a wide range of policy areas is not child-centred, nor are children<br />
socially included. <strong>Child</strong>ren appear in the policy discussion in complex ways: as burdens on their<br />
parents; as adults-to-be; as victims of adult choices about relationships; and as threats to social<br />
order and stability. <strong>Child</strong>ren do not often Image from KidsCan Advertising Brochure 2011<br />
appear simply as children, with their own<br />
voices, their own agency, and their right to<br />
a happy, safe childhood.<br />
When work, not children, is at the centre,<br />
the needs of the poorest children become<br />
6
more and more relegated to the charitable sector. In 2011 we are exhorted to sponsor poor children<br />
in New Zealand much like poor children are sponsored overseas. We are told: “For less than 50<br />
cents a day you can help unlock the potential of a child living in poverty and provide the basics they’re<br />
missing out on”. 1 That 50 cents a day helps alleviate poverty, and we applaud the efforts of committed<br />
people who are responding compassionately to the need that is so clearly not met by current policy<br />
settings. The positive reception by poor communities and the pleasure expressed by the children<br />
themselves to KidsCan’s distribution of<br />
Figure 1.1: Paid work at the centre<br />
food, shoes and raincoats does show that<br />
material help to families, no matter how<br />
small, makes a real difference.<br />
Unfortunately, reliance on charity is a<br />
sticking plaster, and an insecure means of<br />
support. It will not address the underlying<br />
structural and systemic issues.<br />
When paid work is at the centre, we get not<br />
only the charitable model, but a raft of other<br />
policies and outcomes that reflect this focus.<br />
Figure 1.1 simplifies the story, and illustrates<br />
the kinds of policies that flow from a workcentred<br />
approach. While acknowledging<br />
there are trade-offs, this report discusses<br />
the consequences for children of the failure<br />
to put their needs at the centre.<br />
Listening to children<br />
The United Nations Convention on the Rights of the <strong>Child</strong> (UNCROC) was adopted in 1989, and New<br />
Zealand, with provisos, became a signatory in 1993. 2<br />
UNCROC marked a milestone in the development of children’s rights as the first internationally<br />
binding instrument that recognised the need to assign special rights to children having regard to<br />
both their implicit vulnerability and their potential to contribute to society. (Hancock & Walters,<br />
2009)<br />
Under the Convention, governments are required to undertake a thorough review of legislation, policy,<br />
and practice when making their mandatory progress reports to the UN Committee. 3 As an outcome<br />
of UNCROC, many countries have attempted to incorporate children’s voices and participation into<br />
policy-making.<br />
1 KidsCan website: http://www.kidscan.org.nz/<br />
2 The New Zealand Government ratified UNCROC in 1993 with three reservations. These reservations, which still stand,<br />
were made in respect of the following Articles of the Convention: Article 22.1 – Requires States Parties to take appropriate<br />
measures to ensure that children seeking refugee status are provided with the same rights under the UNCROC as other<br />
children, as well as appropriate protection and humanitarian assistance. Article 32.2 – Requires, inter alia, States Parties<br />
to provide for a minimum age of entry into employment. Article 37(c) – Requires, inter alia, that States Parties ensure that<br />
children deprived of their liberty are separated from adults unless it is in the child’s best interests not do so (Hancock &<br />
Walters, 2009).<br />
3 Copies of the New Zealand Government’s progress reports, and the responses to them, are available at <strong>Action</strong> for<br />
<strong>Child</strong>ren and Youth Aotearoa Inc: http://www.acya.org.nz/.<br />
7
Enthusiasm and commitment to UNCROC principles has not been very evident in New Zealand.<br />
However, in 2009, the Office of the <strong>Child</strong>ren’s Commissioner (OCC) and UNICEF commissioned<br />
research in 2009 to review New Zealand experiences and international evidence on the use of<br />
child-impact assessments in local and national governments’ decision-making. While noting that<br />
child assessments can have drawbacks as well as benefits, the authors of this report conclude<br />
that UNCROC’s requirement for children’s meaningful involvement in local and national government<br />
business:<br />
sends a signal to decision makers about the rights of children, and the process increases<br />
awareness of children’s interests with the aim that, over time, children’s interests and needs will<br />
be mainstreamed in policy and practice. (N. Mason & Hanna, 2009, p. 32)<br />
In the child-impact assessment process illustrated in Figure 1.2, the core question is whether the<br />
best interests of the child have been considered:<br />
What are the likely positive and<br />
negative impacts of a policy or activity<br />
on local children – including particular<br />
populations of children – and what are<br />
the alternatives that might mitigate these<br />
impacts? (N. Mason & Hanna, 2009, pp.<br />
32-33)<br />
Figure 1.2. Implementing a child-impact assessment<br />
(Source: Mason & Hanna, 2009, p. 32)<br />
Figure 1.2 suggests that in the first instance,<br />
policies should be screened as to their likely<br />
effects on children, especially poor children.<br />
As Mason and Hanna (2009) suggest,<br />
importantly, child-impact assessments<br />
should not be limited to policies which are<br />
directly child-related. For example, policies<br />
on the distribution of licences for alcohol and<br />
gambling outlets are indirectly, but critically,<br />
related to the well-being of children (see<br />
chapter 15 on social hazards).<br />
Changing the conversation<br />
Placing children in the foreground with legislation to ensure all government policies are compatible<br />
with their needs and rights would begin to shift the conversation to a child-centred approach.<br />
Some countries such as the UK have adopted specific child-centred legislation. The UK <strong>Child</strong> <strong>Poverty</strong><br />
Act 2010 sets out targets and obligations on government to meet specific reductions in child poverty. 4<br />
But laws and policies alone do not guarantee children’s rights: the resources required to deliver the<br />
laws and policies must be available to those with the responsibility for implementation (Moloney,<br />
2011, p. 13).<br />
4 A short guide to the Act is provided on the UK House of Commons Library website at: http://www.parliament.uk/<br />
briefingpapers/commons/lib/research/briefings/snsp-05585.pdf.<br />
8
Another approach is to give children a specific representation in the decision-making process. 5<br />
Among their numerous recommendations for improvement in New Zealand, the Public Health<br />
Advisory Committee (PHAC 2010b, p. ix) suggests creating an identified senior Cabinet position with<br />
responsibility for children, such as a Minister for <strong>Child</strong>ren.<br />
In addition to considering principles of social inclusion and rights for children, we should acknowledge<br />
that children do not live in isolation. Their well-being is closely bound up with the well-being of<br />
the family or whānau. Rather than fragmented interventions from different agencies focused on<br />
individuals who present with complex needs, the Whānau Ora programme offers the possibility of<br />
an holistic approach. Perhaps Whānau Ora will succeed in bringing the different agencies together<br />
where past initiatives have failed? This approach resonates with Māori and with Pacific peoples<br />
(Ministry of Health, 2008), although, as argued in Chapter 4, its impact on poverty rates is much<br />
more uncertain.<br />
This report, <strong>Left</strong> (further) <strong>Behind</strong>, analyses the nature of the range of policies that affect children and<br />
shows if children’s needs were put at the centre, policies would be very different. Figure 1.3, with the<br />
child at the centre, contrasts with Figure 1.1, with work at the centre, and illustrates how the focus<br />
might shift in a selection of policy areas. For example with children at the centre, it is unlikely that the<br />
Welfare Working <strong>Group</strong> (WWG) appointed by the National-led Government in 2010 to investigate<br />
welfare reform would recommend the<br />
Figure 1.3. <strong>Child</strong>ren’s needs at the centre<br />
imposition of significant sanctions for welfare<br />
recipients who do not meet their “jobseeker”<br />
obligations (see chapter 3 for an overview of<br />
welfare reforms).<br />
The path away from child poverty toward a<br />
better future requires access to adequate<br />
resources and opportunities for all children.<br />
Achieving this requires valuing children in<br />
their own right, combined with a commitment<br />
to provide for all children, irrespective of<br />
parental work status, where families live, or<br />
their cultural backgrounds. This publication is<br />
part of CPAG’s ongoing contribution toward<br />
achieving that objective for all children of<br />
Aotearoa.<br />
Chapter summary<br />
Chapter 2 examines the measurement and nature of child poverty in New Zealand in the context<br />
of the growth in inequality. There is a growing body of evidence that social and income inequality<br />
is harmful to individuals and society as a whole. The group most affected by increasing inequality<br />
and poverty is families with children who rely on income-tested benefits. Chapter 3 outlines the<br />
nature of the recent social security reforms and their effects. It focuses particularly on the negative<br />
effects the proposed welfare reforms are likely to have on the thousands of children in beneficiary<br />
families as a result of the narrow emphasis on paid work. The reform of social security proposed<br />
5 It has sometimes been suggested that children be given a vote exercised by their parents, but this is unlikely to see the<br />
promotion of the interests of disadvantaged children and is not further considered in this report.<br />
9
y the government-appointed WWG has occurred with almost no public discussion or community<br />
input and with selective attention to the available evidence. Chapter 4 then provides an analysis of<br />
Whānau Ora in the context of history, and of continuing high rates of poverty among Māori children.<br />
Chapter 5 focuses on the position of Pasifika children, also significantly over-represented in the<br />
poverty statistics.<br />
Part Two begins with Chapter 6, reviewing and updating CPAG’s analysis of the Working for Families<br />
package. Chapters 7 and 8 take up two specific income support issues of significance for children,<br />
namely the support for new-borns from paid parental leave provisions and <strong>Child</strong> Support. Both of<br />
these issues warrant much more extensive exploration than is possible here. Benefits are one side<br />
of the income-distribution story, and tax is the other. Chapter 9 describes how New Zealand’s recent<br />
tax reforms, with little or no public debate, have again favoured the better-off.<br />
Part Three (chapters 10–14) takes up the relationship between poverty and violence, and poverty<br />
and child abuse, issues which have received little attention in New Zealand. Chapter 11 draws on<br />
the framework provided by the United Nations Convention on the Rights of <strong>Child</strong>ren to review the<br />
legislation specific to children, and some of the outcomes of that legislation. Chapter 12 traverses a<br />
range of issues arising from the effects of poverty on children’s health, an area in which there is now<br />
extensive national and international evidence about the vital links between poverty and children’s<br />
immediate and long-term well-being. Despite being a developed country, New Zealand exhibits<br />
statistics for child health more usually found in impoverished countries in the third world. Housing<br />
is the focus of Chapter 13. Issues of housing accessibility and affordability continue to be critical to<br />
children’s development and well-being. Housing costs represent one of the most serious influences on<br />
children’s living standards, and on transience which in turn impacts on children’s education. Chapter<br />
14, the final chapter in this section, covers other important issues for children around ‘social hazards’,<br />
specifically alcohol, smoking, gambling and loan sharks. As elsewhere, children are frequently the<br />
unrecognised victims in all these areas.<br />
Part Four turns to the questions of education and youth unemployment. The first of the chapters in<br />
this Part (chapter 15) examines issues around early childhood education. It begins with an overview<br />
of recent developments in this area, going on to argue that these have had very little impact on<br />
access for low-income communities, and for Māori and Pasifika households. Chapter 16 focuses on<br />
primary and secondary school education, with particular attention to two key areas: the introduction<br />
of national standards; and the plans for the introduction of Teach First. In both these areas, it is clear<br />
that the interests of children in low-income communities are not well served. Chapter 17 tackles a<br />
major question facing New Zealand: youth unemployment, an area requiring urgent attention for<br />
young people, their communities and future New Zealand society.<br />
The final section, Part Five, contains Chapter 18 which presents pioneering work in New Zealand,<br />
namely the quantifying of the cost of child poverty. It is clear from this analysis that child poverty<br />
constitutes a significant cost for New Zealand, both directly and indirectly. This is followed by a<br />
summary of the chapter recommendations towards ultimately ending child poverty in New Zealand.<br />
10
Chapter 2. <strong>Child</strong> poverty and inequality<br />
Mike O’Brien, 6 M. Claire Dale 7 and Susan St John 8<br />
Introduction<br />
Inequality and poverty in relation to children underpin and shape much of the discussion throughout<br />
this report. In New Zealand, as elsewhere, these are complex issues. The Ministry of Social<br />
Development regularly reports data and analysis relating to household incomes, poverty rates and<br />
hardship. Without these reliable figures it would not be possible to monitor child poverty and inequality<br />
over time and the on-going collection of this data is of critical importance. This chapter summarises<br />
the key data on inequality and child poverty.<br />
Why inequality is an issue<br />
Whatever the mediating factors, it would appear that socio-economic inequalities have an<br />
adverse impact on population health and social outcomes. It is also clear that, by definition, these<br />
inequalities are at least in part socially produced. (Carroll, Casswell, Huakau, Howden-Chapman,<br />
& Perry, 2011, p. 3)<br />
Figure 2.1. Rising income inequality (Source: OECD, 2011c)<br />
6 Dr Mike O’Brien is Associate Professor School of Counselling Human Services and Social Work at the University of<br />
Auckland, and Co Convenor of <strong>Child</strong> <strong>Poverty</strong> <strong>Action</strong> <strong>Group</strong>.<br />
7 Dr M.Claire Dale is Research Fellow with the Retirement Policy and Research Centre at the University of Auckland, and<br />
a researcher and policy analyst for <strong>Child</strong> <strong>Poverty</strong> <strong>Action</strong> <strong>Group</strong>.<br />
8 Dr Susan St John, QSO, Associate Professor of Economics, University of Auckland, co-director of the Retirement Policy<br />
and Research Centre and a member of the Management Committee of <strong>Child</strong> <strong>Poverty</strong> <strong>Action</strong> <strong>Group</strong>.<br />
11
‘Inequality’ refers to the spread and distribution of income and wealth. Measures of inequality provide<br />
a picture of the position of different groups in society and the relationships between those who have<br />
the most and those with the least.<br />
Gini coefficients are one method of showing the extent of inequality in a country. 9 As the Gini coefficients<br />
for income show in Figure 2.1 above, growth in inequality has been a feature of most OECD countries.<br />
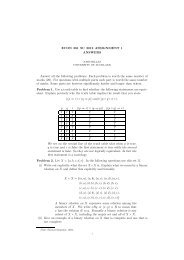
Figure 2.2, below, shows that in New Zealand, inequality increased markedly between the mid-1980s<br />
and late 1990s. The increase was among the most substantial in the OECD and was significantly<br />
above the OECD average. From 2000 the level of inequality as expressed by this measure has been<br />
static or tending to fall. In international terms, however, it remains comparatively high.<br />
Figure 2.2. Inequality in New Zealand, the Gini coefficient (Source: Perry, 2011 Figure D.16)<br />
44<br />
40<br />
Gini coefficient x 100<br />
36<br />
32<br />
28<br />
24<br />
AHC<br />
BHC<br />
20<br />
1980 85 90 95 00 05 2010<br />
HES year<br />
Wealth inequality is more marked than income inequality and is very pronounced in New Zealand.<br />
As shown in Table 2.1, in 2007, the top 10% of wealthy individuals owned 51.8% of total net worth;<br />
the top 1% of wealthy individuals owned 16.4% of total net worth (a likely under-estimate); and the<br />
bottom half of the population collectively owned only 5.2% of total net worth (Cheung, 2007, pp.<br />
7-8). 10<br />
Table 2.1. Percentile distribution of net worth ownership (Source: Cheung, 2007, p. 8)<br />
Percent of total net worth Cumulative (%)<br />
Top 1% 16.4 Top 1% 16.4<br />
Next 4% 21.3 Top 5% 37.7<br />
Next 5% 14.1 Top 10% 51.8<br />
Next 40% 43.0 Top 50% 94.8<br />
Bottom 50% 5.2 All 100.0<br />
9 The Gini coefficient summarises the income differences between each person in the population and every other person<br />
in the population. A difference of, say, $1000 between two high-income people contributes as much to the index as a<br />
difference of $1000 between two low-income people. The Gini scores (x100) range from 0 to 100 with scores closer to<br />
100 indicating higher inequality and those nearer zero indicating lower inequality (i.e., greater equality) (Perry, 2010, p.<br />
123).<br />
10 This compares with the US, where almost 50% of private net worth is held by 5% of the population, and more than 25%<br />
is held by the wealthiest 1% (Isaac, 2007, p. 187).<br />
12
Inequality in New Zealand has a significant ethnic dimension. Māori and Pacific peoples have younger<br />
population age structures than European, and are markedly poorer and less asset rich. Table 2.2<br />
shows the net worth distribution between major ethnic groups, and highlights the differences between<br />
ethnic groups.<br />
Table 2.2. Distribution of population & total net worth, mean and median, by major ethnic group*<br />
(Source: Cheung, 2007, pp. 9-10)<br />
Inequality can affect life chances, health, education and employment opportunities. It is a critical<br />
consideration in understanding and explaining social and economic difference and outcomes for<br />
children in New Zealand.<br />
Inequality and poverty<br />
There is a strong relationship between inequality and child poverty, and countries with lower levels of<br />
inequality demonstrate higher levels of child well-being and lower levels of child poverty. Differences<br />
in child well-being are more extreme in societies with greater income inequality (Hertzman et al.,<br />
2010, p. 468), and, as noted above, New Zealand has an above average level of income inequality in<br />
the OECD. Ridge and Wright (2008) capture the relationship between poverty, inequality and wealth<br />
in their argument:<br />
<strong>Poverty</strong> is inextricably linked to inequality and wealth. It is not just about material, social and<br />
economic resource, it is also about social relationships, social process and the control and<br />
exercise of power. Therefore the study of poverty, inequality and wealth raises fundamental<br />
questions about the organisation of society, social structures, relationships and social justice.<br />
(Ridge & Wright, 2008, p. 1)<br />
Inequality is about the spread of income and wealth between individuals and groups, while “poverty<br />
adds a further dimension of disadvantage” (Ridge & Wright, 2008, p.4). If there is a severe lack<br />
of resources, essential social, material and economic needs cannot be met. In rich countries,<br />
however, the concern is not about absolute deprivation but about a lack of resources that prevents<br />
full participation in society, and a sense of being socially included. In New Zealand, the Ministry of<br />
Social Development reflects the relative poverty approach:<br />
<strong>Poverty</strong> in the richer nations is about relative disadvantage – it is about households and individuals<br />
who have a day-to-day standard of living or access to resources that fall below a minimum<br />
acceptable community standard. (Perry, 2009a, p. 5)<br />
13
As the former CPAG UK director, Professor Ruth Lister, said in her 2010<br />
Sambelll oration:<br />
A society that condones poverty in its midst is not a fair or inclusive<br />
society. So long as a significant minority is unable to participate fully<br />
in the life of the community and enjoy the kind of living standards<br />
taken for granted by the majority because of inadequate material resources, poverty eradication<br />
has to be a primary goal. <strong>Poverty</strong> excludes. It undermines the life chances of children and young<br />
people. Trying to get by on an inadequate income is stressful – particularly for women who tend<br />
to manage poverty and act as its shock-absorbers as they shield other family members from its<br />
full impact. (Lister, 2010)<br />
Non-material aspects of poverty emerge from everyday interactions with wider society, and from<br />
the way people in poverty are talked about and treated by politicians, officials, the media, and other<br />
influential bodies. Non-material aspects of poverty include lack of voice; disrespect, humiliation<br />
and assault on dignity and self-esteem; shame and stigma; powerlessness; denial of rights and<br />
diminished citizenship. All these aspects of poverty are compounded for children.<br />
… the impact of poverty is not only material. Indeed, as a group of low income parents in the<br />
UK told a parliamentary group, ‘the worst thing about living in poverty is the way it gives others<br />
permission to treat you – as if you don’t matter’. People in poverty are all too often treated as if<br />
they don’t matter and as ‘other’ to the rest of society – different and inferior. (Lister, 2010)<br />
While there is no universally agreed international standard to allow between-country comparisons of<br />
poverty rates, 60% of median disposable income (equivalised, that is, adjusted to reflect the composition<br />
of the household) is becoming more widely used as a basis for both measurement and comparison.<br />
However, for international comparisons, poverty rates have been more frequently reported using<br />
a 50% median figure. New Zealand’s poverty rates on this measure in relation to a range of other<br />
countries for the young, the old and the total population is set out in Figure 2.3. On these figures it is<br />
clear that New Zealand’s problem is with child poverty rather than poverty in old age as is the case<br />
in many other countries. As Perry (2011, p. 13) notes, the success story regarding old age poverty<br />
reflects the mix of private<br />
Figure 2.3. Proportion living in poverty (below 50% median income)<br />
provision (mainly mortgagefree<br />
homes), and public<br />
(Source: Perry, 2010, Tables J1, J3, J6)<br />
provision of New Zealand<br />
Superannuation (NZS). This<br />
simple, inclusive, adequate,<br />
universal, basic income<br />
is given to all citizens<br />
from 65 years of age who<br />
meet modest residency<br />
requirements.<br />
14
<strong>Poverty</strong> in New Zealand<br />
There are a number of important considerations in measuring poverty levels and changes over time.<br />
The first of these is the choice of level, with incomes under the 50% poverty line representing a very<br />
low standard for New Zealand’s conditions (Perry, 2011, p. 160). In particular, social assistance<br />
levels are generally in the 50-65% (BHC) range; but the use of any particular percentage should be<br />
verified by independent estimates of what is needed for a minimum standard of living (Perry, 2011, p.<br />
160). In this regard there is some New Zealand analysis that suggests that 60% (but perhaps higher<br />
in Auckland) is a suitable level for New Zealand.<br />
The second important consideration is how to allow for housing costs, one of the most significant<br />
influences on poverty levels. Commonly, poverty figures are reported before housing costs (BHC)<br />
and after housing costs (AHC). The AHC line is calculated by deducting 25% from the corresponding<br />
BHC threshold as an allowance for housing costs. Each household’s AHC income is then assessed<br />
against the chosen threshold (Perry, 2011, p. 162). The problem is that housing costs, especially in<br />
the main centres, tend to be closer to 33%.<br />
Thirdly, there is a choice between relative and fixed or constant-value poverty measures. Thus, when<br />
the median income increases with economic growth, a relative measure looks at the proportion of<br />
the population that falls under the moving median poverty line. This approach measures any change<br />
in poverty relative to what is happening in overall changes in incomes. The alternative approach is:<br />
define a poverty line at a point in time, for example, 60% of the median in the reference year; hold<br />
this constant in real terms; and see if there is any change in the proportion that fall under this fixed<br />
level of income. This is called the ‘constant’ or ‘fixed-value’ poverty rate. The change in the reference<br />
year also explains the discontinuity in the fixed line graph in Fig 2.4.<br />
The effects of different measurement lines and of relative and constant income values are<br />
demonstrated in Figures 2.4 and 2.5 which set out the data for children below poverty lines set at<br />
60%, and before and after housing costs. 11 The 50% relative line is also included, but as discussed<br />
above is not really suitable for New Zealand conditions.<br />
11 The figures show a discontinuity in the fixed line measure at 2007 when the reference year was updated from 1998 to<br />
2007. Backdating these figures gives higher numbers in poverty on the fixed line in previous years as shown in Table 2.3.<br />
15
Figure 2.4. Proportion of children below selected thresholds (BHC): fixed line (CV) and moving line<br />
(REL) approaches compared (Source: Perry, 2011, Figure F.3)<br />
60%<br />
Proportion of children in low-income HHs<br />
50%<br />
40%<br />
30%<br />
20%<br />
10%<br />
Constant value (CV) or 'fixed line' thresholds are<br />
based on the BHC median in a reference year. The<br />
current reference year is 2007. Up to 2007, the<br />
reference year was 1998.<br />
60% REL<br />
60% CV-98<br />
60% CV-07<br />
50% REL<br />
0%<br />
1980 82 84 86 88 90 92 94 96 98 00 02 04 06 08 10 2012<br />
HES year<br />
Comparing Figures 2.4 and 2.5, the constant-value BHC and AHC measures show poverty rates<br />
falling sharply after their peak in the mid-1990s, but declining less sharply on the AHC basis. The<br />
explanation is that, on average, housing costs in the 2000s made up a higher proportion of household<br />
expenditure for low-income households than they did in the 1980s. Despite improvements in housing<br />
policies, such as income-related rents introduced in 2000, and the later accommodation supplement<br />
increases, by 2009 there were still twice as many poor households who spent more than 33% of their<br />
incomes on housing as in the 1980s (Perry,2010, p. 85).<br />
Figure 2.5. Proportion of children below selected thresholds (AHC): fixed line (CV) and moving line<br />
(REL) approaches compared (Source: Perry, 2011, Figure F.4)<br />
60%<br />
Proportion of children in low-income HHs<br />
50%<br />
40%<br />
30%<br />
20%<br />
10%<br />
Constant value (CV) or 'fixed line' thresholds are<br />
based on the BHC median in a reference year. The<br />
current reference year is 2007. Up to 2007, the<br />
reference year was 1998.<br />
60% 98 CV<br />
60% REL<br />
50% REL<br />
60% 07 CV<br />
0%<br />
1980 82 84 86 88 90 92 94 96 98 00 02 04 06 08 10 2012<br />
HES year<br />
16
On the three measures of poverty in Figures 2.4 and 2.5, many New Zealand children are in poverty.<br />
Numerically for 2010 as Table 2.3 shows, 270,000 children fall below the 60% AHC moving line and<br />
are in relative poverty. Of this group there is a worrying 170,000 who fall well below the 60% line, as<br />
shown by the very stringent 50% line measure.<br />
Table 2.3. Numbers of poor children in New Zealand (i.e., number of children in<br />
households with incomes below the selected thresholds) (Perry, 2011, p. 95)<br />
Year BHC AHC<br />
BHC ‘moving line’<br />
60%<br />
AHC ‘moving<br />
line’ 50%<br />
AHC ‘moving<br />
line’ 60%<br />
AHC ‘fixed line’ 60%<br />
(07 ref)<br />
2001 250,000 215,000 310,000 380,000<br />
2004 270,000 200,000 290,000 320,000<br />
2007 210,000 170,000 240,000 240,000<br />
2009 210,000 190,000 270,000 230,000<br />
2010 215,000 170,000 270,000 230,000<br />
Has child poverty improved?<br />
Between 2004 and 2007 the numbers declined on all measures and that can be attributed to the<br />
effect of Working for Families. Since then, relative poverty has increased while the numbers under<br />
the fixed line have fallen slightly. The latest figures for 2010 are based on incomes in 2009 and do not<br />
reflect the effects of the tax changes in 2010, nor the full impact of the recession, or the Canterbury<br />
earthquakes.<br />
Using these relative and fixed-value 60% poverty lines, younger children are more likely to experience<br />
poverty than their older counterparts, as is reflected in Figure 2.6.<br />
Figure 2.6. Proportion of children in low-income households by age (AHC, fixed line)<br />
(Source: Perry, 2010, p. 102. Figure H.1)<br />
60%<br />
Proportions below the threshold<br />
50%<br />
40%<br />
30%<br />
20%<br />
10%<br />
0-11 yrs<br />
60% 98 CV<br />
Fixed line (CV) threshold,<br />
60% of 2007 BHC median, less 25%<br />
60% 07 CV<br />
12-17 yrs<br />
0%<br />
yrs<br />
1980 85 90 95 00 05 2010<br />
HES year<br />
17
What is the best poverty line to use?<br />
To give some idea of actual dollars represented by incomes at the three poverty lines, as shown in<br />
table 2.4 below, at 50% of median income (moving line), a sole parent with 1 child would have just<br />
$446 per week BHC, and $336 per week AHC in 2011. The dollar income for a sole parent with 1<br />
child is $536 BHC, and $404 AHC on the 60% moving line; and on the 60% fixed line, $488 BHC and<br />
$367 AHC in 2011 dollars. Many beneficiaries would find that their actual housing costs would push<br />
them well below the 60% AHC line (Perry 2011 p. 84).<br />
Table 2.4 Weekly income, sole parent, one child, at three poverty lines<br />
2011 income (2011 dollars) Sole parent, one child<br />
50% median income (moving line) BHC $446<br />
50% median income (moving line) AHC $336<br />
60% median income (moving line) BHC $536<br />
60% median income (moving line) AHC $404<br />
60% median income (fixed line) BHC $488<br />
60% median income (fixed line) AHC $367<br />
Internationally there is increased recognition that the role of housing must be taken into account in<br />
determining who is in poverty. The Human Rights Commission has also recently affirmed that it will<br />
track certain measures to assess progress toward the desired outcomes or improvements in welfare<br />
and well-being. The extent of child poverty will be monitored by using the two (60% of median after<br />
housing costs) income poverty lines, one relative and one absolute as described in Figure 2.5. This<br />
reinforces the use of the 60% median income AHC poverty line as the semi-official poverty line in<br />
New Zealand.<br />
CPAG believes the relative, 60% AHC poverty measurement, provides the best basis for examining<br />
the position of the poorest in relation to the rest of the community, a critical consideration in looking<br />
at poverty levels. However, it is necessary also to monitor fixed-value line 60% AHC poverty as any<br />
worsening on this measure means that there are more families who are not only relatively worse off but<br />
are also worse off in absolute terms. <strong>Further</strong>more however, counting children below a particular level<br />
of income as ‘in poverty’ needs to be supported with independent data on current living standards.<br />
Why did child poverty change 1980s–2000s?<br />
The benefit cuts in 1991 significantly increased poverty rates generally, but particularly for children.<br />
<strong>Child</strong> poverty rates rose steeply to unprecedented levels in the mid-1990s on both the constant value<br />
(35%) and the relative measure (29%) after housing costs as shown in Figure 2.5. From the late<br />
1990s to 2007, better economic conditions helped improve the constant value poverty rates, and the<br />
relative rate also fell.<br />
When the Government finally acted on child poverty by improving family<br />
assistance with its Working for Families (WFF) package (see chapter 6),<br />
child poverty rates fell from 28% in 2004 to 22% in 2007 (using the 60% of<br />
median relative income threshold). WFF transferred considerable financial<br />
support to low- to middle-income ‘working’ families with children, who also<br />
gained from improvements in employment in this period.<br />
18
But by 2009, after the early impacts of the global financial crisis, the relative AHC child poverty rate<br />
had risen to 26%. Using the fixed line, the 2010 child poverty rate was around 22%, the same as in<br />
2009 and in the 1980s (B. Perry, 2010, p. 84). The fixed line child poverty rates reflect the stagnation<br />
in real terms of low incomes over this period. In the meantime, real incomes have risen and the<br />
median income (and the poverty line) is higher in real terms. As Figure 2.5 shows, in 2010, the AHC<br />
60% moving line child poverty rate of 26% was double the 13% of the mid-1980s. Figure 2.5 also<br />
shows, consistent with the WFF focus on families in work, using the more stringent poverty line of<br />
50%, by 2010, 16% of children remained in poverty, only a marginal improvement from 2004 when<br />
19% were below this line.<br />
Measuring living standards<br />
Figures 2.4 and 2.5 above use poverty lines based on income. But a lack of income is only one<br />
aspect of poverty, albeit a critical one. A living standards approach developed in the last decade<br />
measures a number of other important components of living standards. While it is difficult to find a<br />
precise and agreed measure for an ‘adequate standard of living’, the Living Standards reports from<br />
the Ministry of Social Development provide a very good basis for establishing such a measure in New<br />
Zealand (Jensen, Sathiyandra, & Matangi-Want, 2007; Perry, 2009b).<br />
The Economic Living Standards Index (ELSI) covers the full spectrum of material well-being from<br />
low to high living standards and is based around four components: ownership of goods; extent of<br />
economising; participation in social life; and a self-rating.<br />
The position of different age groups on the living standards measures are shown in Figure 2.7. The<br />
lowest living standards (severe, significant and some hardship) are reflected on the left hand of each<br />
age band, with improved living standards reading across to the right. In New Zealand in 2004, 26%<br />
of children were living in serious or significant hardship, compared to 4% of those aged 65 and over<br />
(Ministry of Social Development, 2006b). By 2008, reflecting the WFF spending, the numbers had<br />
dropped to 19% of children in these categories of hardship (Perry, 2009a).<br />
Figure 2.7. Distribution of ELSI-3 scores by age group (2008) (Source: Perry, 2009b, p. 50)<br />
50<br />
46<br />
Population percentage<br />
40<br />
30<br />
20<br />
10<br />
0<br />
31<br />
27<br />
26<br />
25<br />
22 22<br />
23<br />
23<br />
23<br />
22<br />
20<br />
17<br />
15<br />
14<br />
14<br />
12<br />
11<br />
10 10<br />
10<br />
9 9<br />
8<br />
8<br />
8<br />
7<br />
6 6 6 6<br />
3<br />
2<br />
2 2<br />
0-17 years 18-24 years 25-44 years 45-64 years 65+ years<br />
These poorest children in New Zealand are found disproportionately in sole parent households, with<br />
the hardship rate for sole parent families around four times that for those in two-parent families (39%<br />
and 11% respectively). But sole parents who are working have a hardship rate of only 20%, well<br />
below that for sole parent beneficiary families (54%). Overall beneficiary families with dependent<br />
children have a hardship rate of around five times that for working families with children (51% and<br />
19
11% respectively). Their living standards profile is worse than for other beneficiaries as Figure 2.8<br />
shows. However, importantly, as Perry (2009a, p. 53) notes:<br />
as there are many times more working families than beneficiary families, there are around the<br />
same number from each group in hardship – around half the children in hardship are from working<br />
families.<br />
Figure 2.8. Distribution of ELSI-3 for beneficiary EFUs by presence of children (2008)<br />
(Source: Perry, 2009a, p. 51)<br />
40<br />
Population percentage<br />
30<br />
20<br />
10<br />
18<br />
22<br />
11<br />
24<br />
15<br />
10<br />
30<br />
21<br />
22<br />
17<br />
7<br />
3<br />
0<br />
No children<br />
1<br />
With children<br />
0<br />
The next living standards survey is not until 2012, but some data in the Household Economic Survey<br />
that may be used to update the living standards measure annually.<br />
<strong>Child</strong> <strong>Poverty</strong> Internationally<br />
<strong>Child</strong> poverty in comparative studies is often measured by the proportion of children with an<br />
equivalised family income below 50% of the median family income of the total population (OECD,<br />
2009a, p. 34). On this indicator, all the Nordic countries are outstanding performers. Denmark, for<br />
example, has around one in 40 children being poor, while as many as one in four children in the US<br />
live in poor families, despite it being one of the richest countries (Figure 2.9).<br />
On a broader basis, the OECD report uses three indicators to measure the material well-being of<br />
children: the average disposable income in families with children under age 18; a relative poverty rate<br />
for children under 18 and the proportion of 15 year olds deprived of basic necessities for education<br />
Figure 2.9. Percentage of children living in poor households in OECD<br />
(below 50% of median equivalised income), circa 2005 (OECD, 2009a, p. 34)<br />
20
elevant to school performance (OECD 2009a, p.33). On that OECD measure, New Zealand ranked<br />
21 st of the 30 countries included (OECD, 2009a, p. 23, Table 2.1).<br />
It is now recognized that the first few years of a child’s life are the most critical for the child’s<br />
development (Gluckman & Hayne, 2011). It is therefore concerning that OECD (2009b) figures<br />
appear to show New Zealand to be one of the lowest investors in early childhood, and have one of<br />
the worst outcomes for children (Grimmond, 2011).<br />
The OECD collect 20 indicators of child well-being such as suicide rates, infant mortality, low birth<br />
weight, proportion of children in overcrowded homes, literacy, low income, and teenage births for<br />
member countries. For youth suicide for example, New Zealand’s rate is 15.9 per 100,000 15-19<br />
year olds, compared to Greece’s rate of 1.3. New Zealand does 12.2 times worse, and has the worst<br />
ranking in the OECD. Obviously it is important that each country has measured each indicator the<br />
same way. These allow comparisons on each indicator but the OECD does not itself calculate an<br />
overall index of child well-being, pointing to the limitations in the data and lack of an agreed way to<br />
do it (OECD, 2009b).<br />
Grimmond (2011) does attempt a rough and ready calculation of an overall relative ranking by<br />
averaging each country’s relative performance for each indicator. The lowest overall scores, he<br />
suggests, indicate the best overall child outcomes. While international comparisons are always<br />
fraught with difficulties, New Zealand’s 28 th position out of 30 OECD countries is indicative of poor<br />
well-being outcomes for children. Comparisons of spending on children internationally are equally<br />
fraught, but as to be expected, low spending is associated with poorer outcomes. However, Grimmond<br />
(2011) highlights that the Netherlands, with very good well-being scores, spends less than other high<br />
scoring countries. This suggests that policy design is of great importance.<br />
The figures for New Zealand show spending is well under the OECD average, but they predate the<br />
Working for Families package. If more recent well-being figures do not show improvement, it may be<br />
that the extra spending has been less effective than it could be.<br />
Why does child poverty matter?<br />
The New Zealand Treasury captures one important reason for the focus on poverty:<br />
Typically those with better health status tend to have greater productivity, higher incomes and<br />
longer working lives, all of which provide an opportunity to accumulate greater net wealth.<br />
(Anastasiadis, 2010, p. 33)<br />
There is, however, an even more fundamental consideration, namely that children only have one<br />
chance to grow and develop and the resources and opportunities which they receive as children are<br />
critical to them as children and also affect their adult lives. <strong>Child</strong>ren cannot alter these resources and<br />
opportunities for themselves; adults, both parents and the wider society, determine the outcomes<br />
for children. <strong>Child</strong>ren have the right to a stable and happy, safe, secure and fulfilling life as children<br />
regardless of whether that makes them more productive in the economy later.<br />
A potentially important influence on the health status of an individual as a child is the socio-economic<br />
status of their parents, as reflected in, and measured by, the parent/s’ levels of education, income,<br />
and occupation. A related question is the extent to which childhood health status influences their<br />
subsequent education and labour market outcomes as adults. 12 For example, Kaitaia in Northland<br />
12 Enright and Scobie (2010, p. 68) suggest that health could play a role in the intergenerational transmission of economic<br />
status.<br />
21
is one of the poorest regions in New Zealand: 49% of children were identified as being born in the<br />
bottom two most-deprived deciles (Rudd, 2010). A research project in 2010 found that the number of<br />
rheumatic fever cases in Northland is increasing, and one in 100 children had heart damage caused<br />
by previous undiagnosed rheumatic fever, which starts with an untreated sore throat (Department of<br />
Labour, 2011b). The New Zealand Medical Association Journal says rheumatic fever and the heart<br />
disease it causes reflect “gross and intolerable health inequalities” (J. McGregor, 2011, p. 19). All<br />
these indicators point to the likelihood of significant economic and social hardship and poverty for<br />
these children’s adult lives.<br />
Another reason to be concerned about child poverty is that generational cycles of high income are<br />
common in the rich countries, but so are cycles of low income: in the US almost 50% of children<br />
born to low-income parents become low-income adults. The rate is also high in the UK at 40%,<br />
and in Canada at about 30%. Even in the Nordic countries, where overall child poverty rates are<br />
low, a disproportionate fraction of low-income children become low-income adults (Corak, 2006). As<br />
societies, we need to protect children from poverty, both for their own well-being and development<br />
as children and with a view to longer-term economic and social outcomes; refusing to make this<br />
investment and commitment is a recipe for economic and social failure, a failure which is both<br />
predictable and preventable (Gluckman & Hayne, 2011).<br />
The discussion in this report demonstrates that child poverty is not inevitable but is the avoidable<br />
consequence of badly designed or inadequately considered policy. Figure 2.3 above shows that,<br />
while a higher proportion of the populations in the US and Australia experience poverty, a greater<br />
percentage of children in New Zealand than in Australia experience poverty. Overall, New Zealand’s<br />
policies have resulted in very few of our elderly experiencing poverty, and we have succeeded in this<br />
more so than the US, the UK, Australia or even Norway. If we can achieve this outcome for our aged<br />
population, we can develop, implement and resource better policies to achieve it for our children.<br />
In the year ended June 2011, with GDP of around $200 billion, nearly $9 billion was spent on New<br />
Zealand Superannuation (NZS), a universal pension provided to approximately 500,000 eligible<br />
superannuitants, while only $1.7 billion was spent on the Domestic Purposes Benefit which is used<br />
to support most of the 235,000 children and their parent/carer living in beneficiary households (see<br />
Table 2.3). There seems to be little intergenerational equity in the government’s treatment: support<br />
for superannuitants has been very effective in preventing poverty among older New Zealanders<br />
which is a good thing, but equivalent levels of support have not been provided for children.<br />
<strong>Child</strong>ren, poverty and social security<br />
While, as indicated above, child poverty is not limited to sole parent beneficiary families, such families<br />
are significantly over-represented among those living below the poverty line. Table 2.5 shows the<br />
numbers and age distribution of children currently living in households receiving a benefit; most<br />
of these are children living in sole parent households in receipt of the Domestic Purposes Benefit<br />
(DPB).<br />
22
Table 2.5. Ages of children dependent on recipients of a main benefit<br />
(Ministry of Social Development, 2011)<br />
Employment statistics in the recession demonstrate that women and young people are the expendable<br />
workers. The number of people receiving the unemployment benefit rose during the December 2010<br />
quarter to reach 67,084 people, the highest figure in more than six years, and 30% higher than<br />
December 2005. Younger people, aged 18–24 years, made up 34% (17,000) of the 44,000 increase<br />
in those unemployed, although they comprise only 17% of the working-age population (Johnson,<br />
2011b, p. 31). For sole parents, most of whom are women, employment opportunities gained during<br />
the boom years were lost during the recession.<br />
Figure 2.10 shows the trends in the proportion of the working age population receiving the DPB<br />
during the last five years, trends which reflect changes in the employment prospects. In 2011, despite<br />
the recession, there is still a smaller percentage of the population in receipt of this benefit than there<br />
was in 2001 (4.1% compared with 4.6%). However, Figure 2.10 also demonstrates that the numbers<br />
on the DPB in 2011 are as high as they were in 2006 when the work incentive tax credit in WFF was<br />
introduced (see Chapter 6).<br />
Figure 2.10. Trends in proportion of working-age population receiving Domestic Purposes Benefit at<br />
end of March 2011<br />
(Source: MSD Benefit Fact Sheet: http://www.msd.govt.nz/about-msd-and-our-work/publications-resources/statistics<br />
benefit/2011-national-benefit-factsheets.html<br />
Percent<br />
5.0%<br />
4.5%<br />
4.0%<br />
3.5%<br />
3.0%<br />
2.5%<br />
2.0%<br />
1.5%<br />
1.0%<br />
0.5%<br />
0.0%<br />
2001 2002 2003 2004 2005 2006 2007 2008 2009 2010 2011<br />
Year<br />
Percent working aged population<br />
23
Presentations at the Welfare Forum at the University of Auckland in September 2010 highlighted<br />
the many difficulties experienced by sole parents, and hence their children, in a recession when<br />
the policy focus is on paid work. 13 Interviewees in CPAG’s What work counts? also reported major<br />
difficulties in both accessing and maintaining employment (Dale, Wynd, St John, & O’Brien, 2010).<br />
As well as entrenching poverty in these sectors of the population, the absence of employment<br />
opportunities for sole parents and young people and the strengthened discourse around ‘welfare<br />
dependency’ as exemplified in the Ministry of Social Development’s Future Focus literature and the<br />
WWG’s reports, cast them in the role of the undeserving poor. The noticeable change in the public<br />
policy rhetoric from welfare to workfare has significant consequences for children, as is reflected in<br />
this report.<br />
What is child poverty like in 2011?<br />
The statistical data on inequality and poverty provides a range of useful information about the position<br />
of children and families, but the nature of their collection via surveys means that the latest available<br />
figures do not necessarily reflect current conditions. It is therefore useful to monitor other indicators.<br />
Foodbank usage is one of those indicators.<br />
At the Auckland City Figure 2.11. Auckland City Mission Annual Total Food Parcel Numbers<br />
Mission, a major 1996-2011 (projected to June 2011)<br />
centre co-ordinating 70 (Source: D. Robertson, Auckland City Missioner/CEO)<br />
foodbanks in Auckland<br />
and Northland, demand<br />
for food parcels climbed<br />
through the economic<br />
boom years, decreased<br />
a little in 2006-8, but by<br />
2008-9 it was climbing<br />
again approaching 10,000<br />
parcels by the close of<br />
the June 2011 year. That<br />
pattern of demand, shown in Figure 2.11, is mirrored in other parts of the country. Mangere Budgeting<br />
Service also reports a large increase in demand in 2011. This foodbank tries to give no more than<br />
three food parcels in six months to any given family because they don’t want to be seen as a crutch,<br />
but chief executive Darryl Evans says: “when you know someone is genuinely not able to feed the<br />
kids, who am I to say no to them?” (S Collins, 2011).<br />
The New Zealand Council of Christian Social Services’ (NZCCSS) Vulnerability Report (2011, p.<br />
1) notes that, between March 2009 and March 2011, prices overall increased by 6.6% (food prices<br />
by 6%, and petrol by 30%), but average hourly earnings only increased by 3.4%. Early childhood<br />
education charges increased by 11.7% in 2011 alone (2011, p. 2). It is not surprising, then, summary<br />
instalments (an alternative to bankruptcy) have increased dramatically (2011, p. 6), and more families<br />
in desperation are turning to loan sharks (see chapter 14, Social Hazards).<br />
These indicators of social distress are paralleled by reports of third world diseases, homelessness,<br />
poor dental health, hunger and family dysfunction as discussed in the following chapters.<br />
13 See Proceedings of the Welfare Forum 2010 at www.cpag.org.nz<br />
24
Despite the wealth of information on the levels and significance of poverty and inequality, and the<br />
importance of ensuring a minimum acceptable community standard, the editorial of the February<br />
2011 issue of the New Zealand Medical Journal reports:<br />
<strong>Child</strong>hood diseases related to poverty and crowded housing are still prevalent in New Zealand 14<br />
and are a national shame... Recent OECD data indicate that New Zealand spending on children<br />
is considerably less than the OECD average (OECD, 2009b). The biggest shortfall is for spending<br />
on young children on whom New Zealand spends less than half the OECD average. The OECD<br />
concludes that New Zealand needs to take a stronger policy focus on child poverty and child<br />
health. (Sharpe, 2011)<br />
<strong>Child</strong> poverty in Aotearoa continues to reflect how little value is placed on the needs of children. Yet<br />
it would be more rational, if only for reasons of self-interest, to provide better conditions for all the<br />
children in New Zealand. Like the rest of the Western world, our population is ageing numerically<br />
and structurally. Although we have the highest birth rate in the developed world, maintaining a<br />
‘replacement’ level at 2.1, almost all future growth will be at the older ages. We need to prepare, as<br />
Jackson (2011) argues, for dramatic changes in the ratio of young to old.<br />
In 2011 in New Zealand at least one in five children lives in severe or significant hardship, and at<br />
least one in four children lives below the semi-official poverty line. With the consequent limitations on<br />
their long-term health, education, and ability to participate in society, how will increasing numbers of<br />
elderly be supported?<br />
Recommendations<br />
• Adopt an official poverty line at 60% of the contemporary median, disposable, after housing costs,<br />
household income;<br />
• Also monitor poverty on a fixed line basis;<br />
• Supplement these measures by regular surveys of hardship;<br />
• Set net income for those on benefits so that no-one is under the poverty line;<br />
• Pledge to end child poverty in New Zealand by 2020;<br />
• Acknowledge the vital social and economic contribution made by good parenting;<br />
• Create a senior Cabinet position with responsibility for children, such as a Minister for <strong>Child</strong>ren, to<br />
support the move toward a child-centred approach to policy and legislation; and fund child-impact<br />
assessments of existing national and local policies;<br />
• Monitor all major indicators of child poverty and report these on a regular basis with specific target<br />
reductions to be met on the way to ending child poverty by 2020.<br />
14 New Zealand <strong>Child</strong> & Youth Epidemiology Service (2009).<br />
25
Chapter 3. Work, Families and <strong>Poverty</strong><br />
Mike O’Brien, 15 Louise Humpage 16 and Donna Wynd 17<br />
Introduction<br />
<strong>Left</strong> <strong>Behind</strong> (2008) concluded by noting that the reforms to social assistance which had been<br />
established to that point:<br />
not only place more of the burden of poverty on the shoulders of the poorest families, but also<br />
fail to acknowledge, let alone address, its underlying causes. The rhetoric around welfare reform,<br />
stripped of its doublespeak, carries a simple message: the only valuable contribution a person<br />
can make to society is an economic one.... As with the costs of global warming, it is time the<br />
debate broadened to consider what sort of future we want for our children and grandchildren....<br />
New Zealand’s welfare reforms are mean spirited, lacked vision, and risk further eroding our<br />
social cohesion. (St John & Wynd, 2008, p. 44)<br />
The arguments expressed then have been reinforced by the developments in welfare provision and<br />
coverage in the three years that have elapsed since that report. Indeed, as this chapter and others<br />
in this volume indicate, that emphasis on work and the associated neglect of children’s needs has<br />
become more strident. The ‘mean spirited’ approach, lacking a constructive and positive vision and<br />
eroding social cohesion have been consolidated and strengthened by subsequent policies, reflected<br />
most recently in the reports from the Government-appointed Welfare Working <strong>Group</strong> (WWG). The<br />
task of this chapter is to set out those changes and, equally importantly, to locate the changes within<br />
a broader focus on welfare and welfare reform. This is both in terms of the international debates on<br />
welfare and welfare provision and in the light of the evidence around the effects and consequences<br />
of the directions for reform.<br />
Welfare to Work<br />
The current (2008–2011) government’s approach to social<br />
security and income support has been reflected in the Minister<br />
of Social Development and Employment, Paula Bennett’s phrase:<br />
“an unrelenting focus on work”. While undoubtedly containing an<br />
element of political rhetoric, it does capture this Government’s<br />
focus and emphasis as reflected in both the terms of reference<br />
given to the WWG, and the <strong>Group</strong>’s reports (Welfare Working<br />
<strong>Group</strong>, 2010a, 2010b). The terms of reference were focused<br />
heavily on reducing benefit ‘dependency’ (and welfare costs) by<br />
moving beneficiaries into paid work wherever possible; making<br />
beneficiaries ‘independent’; and reviewing welfare delivery.<br />
Framed within a very loose terminology of ‘welfare dependency’,<br />
the WWG produced a range of recommendations based around<br />
eight themes. These themes were: a stronger work focus from more people; reciprocal obligations; a<br />
long-term view; committing to targets; improving outcomes for Māori; improving outcomes for children;<br />
a cross-government approach; and more effective delivery (Welfare Working <strong>Group</strong>, 2011, pp. 1-2).<br />
15 Dr Mike O’Brien is Associate Professor School of Counselling Human Services and Social Work at the University of<br />
Auckland, and Co Convenor of <strong>Child</strong> <strong>Poverty</strong> <strong>Action</strong> <strong>Group</strong>.<br />
16 Dr Louise Humpage is a lecturer in Sociology at the University of Auckland.<br />
17 Donna Wynd is a researcher and policy analyst for <strong>Child</strong> <strong>Poverty</strong> <strong>Action</strong> <strong>Group</strong>.<br />
26
Although the whole process was predicated on the alleged problem of ‘dependency’, the term<br />
itself was simplistically defined as six months’ continuous benefit receipt. The frame within which<br />
the analysis, discussion and recommendations was built is captured neatly in the discussion on<br />
reciprocal obligations:<br />
individuals who enter the system who can work should take all reasonable steps to secure paid<br />
work and they should be supported and encouraged by policy settings and a responsive service<br />
delivery agency to find paid work. (Welfare Working <strong>Group</strong>, 2011, p. 2)<br />
The WWG’s terms of reference explicitly excluded from their consideration “adequacy of income from<br />
welfare” (other than in the context of the gap between welfare and work), National Superannuation,<br />
or the tax benefit interface and Working For Families Tax Credits (Welfare Working <strong>Group</strong>, 2010d).<br />
By excluding these areas from the WWG’s consideration and by framing the discussion primarily<br />
as an issue of beneficiary behaviours, Government and the WWG were building on an approach to<br />
social security that had gathered momentum throughout much of the previous decade. However,<br />
the WWG took the approach much further with its myopic focus on paid work and on the labour<br />
supply dimensions of welfare reform. The WWG’s focus on changing the lives and behaviour of<br />
beneficiaries, and its failure to attend to the demand for labour in the context of a volatile labour<br />
market (other than by passing anecdotal reference to the submissions of some employers), were<br />
accompanied by a complete failure to explore what welfare reforms might be required to meet goals<br />
of reducing and eliminating poverty and improving human well-being. For the WWG, well-being was<br />
equated with ‘participation in paid work’.<br />
The WWG’s approach to welfare can only be described as residual and neoliberal, given that it is<br />
based very heavily around responsibilities rather than rights, and on a minimal welfare state. This<br />
emphasis on responsibilities (and particularly the responsibilities of beneficiaries) is reflected in a<br />
range of neoliberal ideas about, and approaches to, income support and social security in which<br />
state assistance is kept to a minimum and accompanied by processes of monitoring and control,<br />
and sanctions for non-compliance. We return to this issue below; first we need to locate the WWG’s<br />
approach alongside recent changes to income support and social security.<br />
Increasing participation in paid work had been one of the goals of the two<br />
previous amendments introduced in 2007 to the Social Security Act 1964.<br />
The then Minister of Social Development and Employment, David Benson-<br />
Pope, included the following statement of principles, effectively instructions<br />
for those charged with administering the Act:<br />
a) work in paid employment offers the best opportunity for people to achieve social and economic<br />
well-being;<br />
b) the priority for people of working age should be to find and retain work;<br />
c) people for whom work may not currently be an appropriate outcome should be assisted to plan<br />
for work in the future and develop employment-focused skills;<br />
d) people for whom work is not appropriate should be supported in accordance with this Act<br />
(Social Security Act 1964, Section 1B, inserted by section 23 of the Social Security Amendment<br />
Act 2007).<br />
27
The Social Assistance (Future Focus) legislation introduced by the National government in 2010<br />
also heavily emphasised work rather than security or adequacy of social security. To signal this<br />
emphasis more clearly the Bill was renamed as the Social Assistance (New Work Tests, Incentives,<br />
and Obligations) Amendment 2010. In the original Bill, the government noted that “the main objective<br />
of the changes is to ensure a fairer system of social assistance with an unrelenting focus on work”<br />
(Future Focus Bill, 2010). The Bill then went on to say:<br />
the changes reflect and reinforce the principles that underpin the Social Security Act. These<br />
are that: work in paid employment offers the best opportunity for people to achieve social and<br />
economic well-being; the priority for people of working age should be to find and retain work;<br />
people for whom work is not possible at the moment should be assisted to plan for work in the<br />
future and develop employment focused skills. (Future Focus Bill 2010)<br />
The latter two changes in the legislation reflected this emphasis.<br />
Significantly, the Ministry of Social Development’s Regulatory Impact Statement stated that it would<br />
be impossible to assess whether the legislation was effective:<br />
there is no research currently available which accurately quantifies the size and behaviour<br />
response from these changes in policies. This prevents estimates, with a degree of accuracy<br />
required, from being made of the number of people who will move from benefit to work over a year<br />
as a result of the proposed changes. (Ministry of Social Development, 2010a, para 4)<br />
<strong>Further</strong>more, the Bill was judged to be in breach of the Human Rights Act 1993, on the basis that it<br />
discriminated on the grounds of sex, marital status and family status, and that the limitation on the<br />
right to be free from discrimination which arose from clauses in the Bill could not be justified under<br />
the Bill of Rights Act 1990 (Office of the Attorney-General, 2010).<br />
The approach taken in these legislative changes and in the Welfare Working <strong>Group</strong>’s report stands in<br />
marked contrast to the approach adopted by the Alternative Welfare Working <strong>Group</strong> (O’Brien et al.,<br />
2010a, 2010b). The Alternative Welfare Working <strong>Group</strong> was established by Caritas, Anglican Social<br />
Justice, and Beneficiary Advocacy Federation of New Zealand in response to the WWG process. It<br />
argued that changes to the welfare system required attention to a range of fundamental questions<br />
including: economic and employment growth; fair, appropriate and consistent treatment by staff in<br />
Work and Income; and improved benefit levels, particularly for families with children. Its approach<br />
to welfare reform argued strongly that the definition of “work” could not, and should not, be limited<br />
to paid employment but needed to extend more widely to include caring for both dependent children<br />
and dependent adults. In contrast to the WWG, the Alternative Welfare Working <strong>Group</strong> argued that<br />
welfare ought to be provided on the basis of “the unrelenting pursuit of well-being” (O’Brien et al.,<br />
2010b).<br />
Welfare, work and poverty<br />
Far from reflecting and reinforcing the principles that underpin the Social<br />
Security Act, recent changes to the legislation signal a significant departure<br />
from a key goal of social security: benefit adequacy and poverty prevention.<br />
The 1972 Royal Commission on Social Security set out a basis for establishing<br />
benefit levels that it said should be based on a sense of belonging and<br />
participation. That is, benefits ought to enable beneficiaries to have a sense<br />
28
that they belong in the society and are able to participate in the life of that society. Thus, the benefit<br />
levels should not lead to situations and experiences in which benefit recipients felt like outsiders who<br />
experienced lives, circumstances and standards of living significantly below those experienced in<br />
the society generally. The basis for establishing benefit levels were the wage levels of a building and<br />
engineering labourer, and the lower quartile of adult male earnings (Royal Commission on Social<br />
Security, 1972b).<br />
Clearly, ‘belonging and participation’ no longer serve as a basis for assessing benefit levels. The<br />
research on living standards undertaken in recent years by the Ministry of Social Development<br />
(Jensen et al. 2006) demonstrates that significant numbers of families and households relying on<br />
benefit income have restricted or severely restricted living standards. Jensen et al. (2006, p. 101),<br />
for instance, reported that 22% of families with dependent children were living in severe or significant<br />
hardship. This compares with 10% of households without children and 4% of those aged over 65<br />
(Jensen et al., 2006). Similarly, protection from poverty as a basis for minimum benefit levels is no<br />
longer stipulated in either the legislative requirements or policy frameworks for social security. Nor<br />
does protection from poverty serve as a basis for considering changes and developments in welfare<br />
provision, as seen in the deliberate omission of benefit adequacy from consideration by the WWG.<br />
The WWG’s final report<br />
(Welfare Working <strong>Group</strong>,<br />
2011, p. 37) refers to the<br />
need for incomes to be at<br />
“a decent minimum income<br />
level” for those who are<br />
unable to earn but there is<br />
no discussion of what this<br />
minimum should be or how<br />
it should be set. Indeed,<br />
the recommendation for a<br />
standard benefit set at the<br />
level of the unemployment<br />
benefit would cut the benefit<br />
rate for those receiving an<br />
Invalid’s benefit. 18<br />
The turn to work has been a<br />
feature of changes to welfare<br />
provision and delivery for over a decade, not just in New Zealand, but internationally. The emphasis<br />
has been on the role of paid work with special attention given to the labour force participation of<br />
groups such as single parents. Throughout the OECD sole parents have been “incentivised” to return<br />
to paid work through measures such as tax credits and subsidies for costs such as childcare. The<br />
use of sanctions to ensure benefit recipients respond as required has also been a feature of these<br />
reforms as have been wage subsidies for low-paid workers.<br />
These international developments are located within a framework that has been given the heading<br />
‘active citizenship’ by both policymakers and academic commentators. However, that term lacks<br />
18 Thus the WWG set aside the reasons for the varying rates of the varying benefits: whether or not there are children to be<br />
supported, or special health needs that involve extra costs.<br />
29
clarity and precision (Andersen, Guillermard, Jensen, & Pfau-Effinger, 2005; Andersen & Jensen,<br />
2005). <strong>Further</strong>more, this lack of clarity and precision has been accompanied by a judgement in which<br />
‘active’ citizenship is contrasted with ‘passive’ citizenship. The former is described as laudable and<br />
defined in positive terms while ‘passive’ citizenship is described in critical and negative terms, and is<br />
judged to be both ineffective and inappropriate. The WWG (2011) reports and earlier documents from<br />
Clark and Maharey (2001) incorporate these distinctions, although it must be said that the pejorative<br />
dimensions are stronger in the WWG approach, to which we will return below.<br />
The significance of the emphasis on ‘paid work’ and ‘active citizenship’ in moulding public perceptions<br />
is twofold. First, it represents and reflects a significant political shift in the approach to social security,<br />
income support and welfare. It envisages a limited role for the state while emphasising greater<br />
responsibilities and reduced rights for beneficiaries. Second, and equally importantly in the New<br />
Zealand context, the new rhetoric has been accompanied by a punitive tone 19 and by a set of policies<br />
which have emphasised paid work. These policies have had serious harmful consequences for<br />
children living in households where their carer is not in paid work. <strong>Further</strong>more, in New Zealand,<br />
as illustrated in Table 3.1 below, the WWG (2011) moved beyond ‘active’ to ‘work-focused’, further<br />
removing from view the state’s obligation to provide support for its citizens: 20<br />
Table 3.1. Passive Welfare to Work-Focused Welfare (Source: Welfare Working <strong>Group</strong>, 2011, p. 57)<br />
Passive welfare Work-focused welfare 20<br />
Focused on the provision of income support<br />
Work expectations, employment supports and<br />
payments reflect arbitrary benefit categories<br />
Limited obligations and low levels of investment<br />
in employment supports<br />
Limited organisations incentives to reduce longterm<br />
dependence<br />
Focused on helping people find paid<br />
employment<br />
Work expectation, employment supports,<br />
and payments are personalised to individual<br />
circumstances<br />
High levels of obligations and support to<br />
secure employment (even prior to receiving<br />
financial assistance)<br />
Strong organisational incentives to reduce<br />
long-term dependence<br />
The focus on the responsibilities of beneficiaries to obtain paid employment rather than their right to<br />
income support reflects an important and fundamental shift in the conception of citizenship and in<br />
the relationship between the individual and the state. Extension of the social rights of citizenship has<br />
been a hallmark of the New Zealand welfare state, and welfare states internationally, through much<br />
of the latter half of the 20th century. However, the last two decades have seen increasing emphasis<br />
on responsibilities, framed within the language of ‘active citizenship’ (Hvinden & Johansson, 2007).<br />
The ‘active citizen’ is responsible for his/her own welfare and the role of the state is described as<br />
‘empowerment’, reflected in greater individual responsibility, rather than on service provision and<br />
enhancement and extension of the rights of citizens.<br />
Anderson and Guillemard (2005) suggest that the prospects and implications of the emphasis on<br />
active citizenship remain uncertain; however, the outcomes of recommendations from the WWG, if<br />
implemented, are not uncertain. In particular, the lack of attention to the interests, position and needs<br />
of children in households reliant on a social security benefit can only mean the consolidation and<br />
19 The punitive tone has not been so much in evidence elsewhere.<br />
20 While the term ‘work focused welfare’ is used by the WWG, it is used in the context of ‘active’ welfare, the word ‘active’<br />
being used in the headings for the next two paragraphs in the Report after the Table.<br />
30
entrenchment of their poverty and severely restricted living standards. Those children whose parent/<br />
carer is able to secure paid work and sufficient hours of work to be eligible for income supplements<br />
through the tax system may move above the poverty line. However, citing the OECD, the WWG<br />
states that if New Zealand could achieve rates of sole parent employment in line with the best<br />
performing OECD countries, we could reduce child poverty rates by one quarter (Welfare Working<br />
<strong>Group</strong>, 2010ba). This would still leave between 120,000 and 150,000 children living in poverty. The<br />
WWG is completely silent on the prospects for an adequate or secure income for this group of<br />
children, and on how the emphasis on paid work for beneficiary families with children has already<br />
been a major contributor to high levels of child poverty in New Zealand.<br />
There is, of course, a fundamental contradiction in the emphasis on paid work. If one partner in<br />
a relationship is working more than 30 hours, then the other partner is not required to undertake<br />
paid work in order to receive government financial assistance through in-work tax credits. Caring<br />
work is clearly of lesser status than paid work and it is only a choice for those who have an existing<br />
supporting relationship.<br />
Alongside the threat of poverty faced by those relying on income support payments, there is an even<br />
more fundamental consideration arising from the narrow focus on paid work. The emphasis on paid<br />
work denies and denigrates the significance of the work of caring, particularly caring for dependent<br />
children and, to a lesser extent, caring for dependent adults. Although not always explicitly articulated,<br />
the focus on paid work carries both a suggestion that caring for dependent children is not ‘work’ and,<br />
perhaps even more significantly, carries an implication that such work is not particularly important.<br />
While official statements may say otherwise, the consistent message contained in policies that aim<br />
to limit the provision of social assistance is that ‘caring work’ is secondary and not highly valued.<br />
Indeed, it is as if caring work is an annoying inconvenience and interruption to the important real and<br />
meaningful purpose of human life: engaging in paid work.<br />
In addition, the WWG’s emphasis on responsibilities rather than rights incorporates a far more<br />
punitive approach to welfare. Alongside the heavy emphasis on paid work, this approach includes a<br />
series of recommendations around monitoring and control over the lives of beneficiaries (particularly<br />
young people) with the threat of sanctions for non-compliance. Such sanctions and controls are to<br />
be extended to beneficiaries who have an additional child while receiving a benefit; those who might<br />
need additional financial assistance because of inadequate benefits; teen parents; those who do<br />
not meet their obligations; and those who do not meet alcohol or drug test requirements (Welfare<br />
Working <strong>Group</strong>, 2011, pp. 22–23). While the WWG’s discussion on sanctions notes a requirement<br />
for monitoring and safeguarding the interests of children in households where sanctions are applied,<br />
there is no guarantee that those children would be protected from poverty; indeed they are likely to<br />
be among the most vulnerable children.<br />
Increased applications for hardship grants and food parcels have been direct consequences of the<br />
poverty arising from inadequate benefit levels. In 2009, 201,384 Ministry of Social Development<br />
clients were given a Special Benefit or Temporary Additional Support; this compares with 117,276<br />
the previous year (Ministry of Social Development, 2010b, p. 152, Table TS.2). This increase has<br />
occurred in a policy environment in which there has been closer scrutiny of applications, an approach<br />
which will be tightened even further if the recommendations of the WWG (2011) are implemented.<br />
Those recommendations include proposals for management of the benefit for some beneficiaries<br />
and greater use of budgeting services. The increased demand resulting from changes which require<br />
31
eferral to a budgeting service as a condition for receipt of some hardship grants has led to budgeting<br />
services requesting additional funding from government to meet this demand (New Zealand Herald,<br />
2010).<br />
It is clear from all recent research that children in workless households face the highest risks of<br />
poverty and lower living standards (Johnson, 2011a; Perry, 2009a, 2009b). Paid work would improve<br />
the living standards for those children whose carer could obtain consistent and regular work which<br />
paid an adequate wage. However, the very high proportion of children in benefit households who will<br />
remain in poverty represents the failure of the ‘work first’ and ‘unrelenting focus on work’ approaches.<br />
The failure of work first is also evident in the number of children in poverty in households where at<br />
least one adult is in full-time work. Current approaches to welfare reform mean that those children<br />
will live in even more severe hardship than they do currently. Tellingly, there is no discussion in the<br />
WWG report about the need for Government’s social and economic policies to be focused around<br />
employment and job creation and job growth, a key dimension of both reciprocal obligations and<br />
the ‘work first’ focus. It is here that the responsibilities and individualising aspects of the WWG’s<br />
approach to ‘active citizenship’ are most clearly and starkly revealed.<br />
In the book Why We Need a New Welfare State (2002), Esping-Andersen argues that changing<br />
economic and social frameworks and structures require shifting the basis upon which social security<br />
and income support systems have been built and developed. He argues that the changing nature of<br />
work and issues surrounding children demand changes in government welfare provision. Significantly,<br />
he argues for a welfare framework which provides effective support and protection for all children;<br />
and one in which the changing nature of work is reflected in the regulations linking employment<br />
and welfare support. Running through his discussion is a strong emphasis on ensuring that income<br />
support and social security provisions reduce levels of poverty and contribute to, and enhance,<br />
human well-being. Those aims, goals and objectives are completely missing from the direction of<br />
welfare reform in New Zealand over the last 20 years. Implementation of the recommendations of the<br />
WWG and continued pursuit of the existing directions in welfare reform will only take us further away<br />
from achieving those goals, and broaden and deepen child poverty in New Zealand.<br />
Recommendations<br />
• Review and adjust benefit levels to ensure that families with children are not below the poverty<br />
line;<br />
• Acknowledge the work of caring for dependants by ensuring that this work is treated as being of<br />
equal status to paid work;<br />
• Reject WWG recommendations which fail to meet the above objectives and which treat<br />
beneficiaries as second-class citizens.<br />
32
Chapter 4. The Whānau Ora Approach<br />
Mamari Stephens 21<br />
Introduction<br />
To what extent might the Whānau Ora approach, as launched in April 2010, really benefit the lives of<br />
Māori children of those whānau in, or on, the edges of poverty?<br />
At one level, it is appropriate to consider how the Whānau Ora<br />
approach will be applied within the edifice that comprises our<br />
social security system, including welfare benefits. Various<br />
commentators have presumed that Whānau Ora is to be “the<br />
biggest shake-up of the welfare system in decades” (New<br />
Zealand Herald, 2010), or that Whānau Ora is an initiative<br />
that will fill in “gaps in the modern welfare state” (Espiner, 2010). Indeed, Māori are assumed to<br />
be empowered to determine their own welfare outcomes: “70 years after the introduction of the<br />
welfare state, Māori can finally do welfare their own way” (Armstrong, 2010). Notwithstanding this<br />
commentary, there is some considerable risk that the Whānau Ora approach will have little impact<br />
in decreasing the numbers of Māori on benefits, although it may well enable those who remain on<br />
benefits to be better able to survive and perhaps alleviate financial distress.<br />
This risk arises because social security is fundamentally dependent on the notion of the autonomous<br />
individual who suffers one or more identifiable social contingencies (such as unemployment or old age,<br />
for example). Social security operates to enable the state to step into that individual’s shoes by way<br />
of providing income replacement or income adjustment (and some other limited types of assistance)<br />
until such time as that individual can re-enter the economy. The entire benefit structure, as it has<br />
been implemented and enacted since 1938, is simply anathema to the Whānau Ora collective and<br />
tikanga Māori approach. There will be ways to incorporate the Whānau Ora thinking at a strategic<br />
level within this system, but history shows the wrecks of a number of ships that have run aground on<br />
that shore. The 1986 Pūaoteatatū, report, and Department of Social Welfare bicultural strategy (“Te<br />
Punga”) were important initiatives of their time, aimed at improving Māori engagement in achieving<br />
better service delivery to Māori and better social security outcomes for Māori (Department of Social<br />
Welfare, 1994; Ministerial Advisory Committee on a Māori Perspective for the Department of Social<br />
Welfare, 1988). Arguably, none of these initiatives has truly achieved either aim.<br />
The context in which Whānau Ora evolved is also important for understanding the impact the approach<br />
might have in the alleviation of poverty, including child poverty. At a political level, Whānau Ora is<br />
another result of ongoing Māori efforts to effect real decision-making power over social outcomes for<br />
Māori as well as improving those social outcomes for Māori. Put another way, Whānau Ora seeks to<br />
achieve for Māori both true tino rangatiratanga and the real benefits of equal citizenship within social<br />
policy areas. In this respect, there are lessons to be learned from what has already been done. Such<br />
lessons can be derived from certain programmes already in existence that comprise current childcentred<br />
or whānau-focused initiatives such as the Early Start and Family Start initiatives.<br />
Of prime importance is the centralisation of whānau in the design and implementation of the Māori<br />
Health Strategy, He Korowai Oranga in 2002. The experiences in the health field of nearly a decade<br />
21 Māmari Stephens, Lecturer and Project Co-Leader: the Legal Māori Project Te Kura Tātai Ture Faculty of Law, Victoria<br />
University of Wellington Te Whare Wānanga o te Ūpoko o te Ika a Maui.<br />
33
under the Māori Health Strategy suggests that Whānau Ora, in its application to social services,<br />
is likely to provide real and substantive Māori decision-making and engagement in social policy<br />
making as well as Māori design and implementation of social initiatives within communities (Ministry<br />
of Health, 2002 , p.iii). However, as suggested by the experiences in health and in existing familycentred<br />
programmes, it may take at least a few years for such changes to result in measurable<br />
lessening in the inequities that create poverty within Māori whānau and communities.<br />
Given the high likelihood that the Whānau Ora approach will struggle to make an impact on the<br />
implementation of the social security system, and the considerable time needed for increased Māori<br />
decision-making and engagement in social policy to result in measurable change in poverty rates for<br />
whānau Māori, poverty, for many Māori children, will remain the daily reality in the short to medium<br />
term.<br />
Māori and <strong>Poverty</strong><br />
There is no need to replicate the enormous amount of data which show clearly the economically<br />
disadvantaged position of Māori. In fact, the Whānau Ora Taskforce Report (Whānau Ora Taskforce,<br />
2010, p. 15) summarises this:<br />
Despite limitations, current data suggest that whānau members face a disproportionate level of<br />
risk for adverse outcomes, as seen in lower standards of health, poorer educational outcomes,<br />
marginalisation within society, intergenerational unemployment and increased rates of offending.<br />
<strong>Further</strong>, in response to socio-economic hardship, a range of problems are likely to co-exist<br />
within the same household, affecting health, employment, behaviour, education, and lifestyle<br />
simultaneously. In addition to socio-economic determinants, some studies have shown that even<br />
when social and economic circumstances are taken into account, Māori individuals still fare worse<br />
than non-Māori.<br />
Table 4.1 shows the extent of income inequality for Māori in relation to other ethnic groups: Between<br />
1988 and 2008 median income for Māori increased by $3,300 while for the population as a whole it<br />
increased by $4,400.<br />
Table 4.1. Real equivalised median household income (BHC) by ethnicity 1988 to 2008<br />
($2008) (Source: Perry, 2009a: Table D.5)<br />
1988 1990 1992 1994 1996 1998 2001 2004 2007 2008<br />
Euro/Pakeha 25,100 25,000 22,500 22,100 23,000 25,100 25,600 28,800 29,500 31,000<br />
NZ Māori 20,800 18,800 15,300 15,400 18,400 19,400 20,800 21,500 21,000 24,100<br />
Pacific 20,400 17,900 16,200 14,500 15,900 17,700 17,100 19,600 23,000 22,300<br />
Other 22,600 21,700 21,400 16,100 18,500 15,900 24,900 20,900 26,300 25,400<br />
All 23,900 23,400 21,100 20,400 21,600 23,500 00 24,100 25,900 27,400 28,300<br />
The disadvantaged position of Māori in relation to overall income inequality is reflected too in the<br />
hardship data in the early (as yet preliminary) data from the 2008 Report on Living Standards. Here<br />
too, the position of Māori is significantly worse than the population overall as demonstrated in Figure<br />
4.1 below. The scale moves from ‘severe hardship’ on the left to a ‘very good’ standard of living on<br />
the right-hand side.<br />
The 2008 Living Standards preliminary research also notes that Māori and Pacific households have<br />
a hardship rate two to three times higher than other ethnic groups. As recent Ministry of Social<br />
34
Development data<br />
shows, Māori children are<br />
twice as likely as Pākehā<br />
to be living in a poor<br />
household at below 60%<br />
of the median household<br />
income (after housing<br />
costs are accounted<br />
for), a fact the report<br />
identifies as reflecting the<br />
relatively high proportion<br />
of Maori children living in<br />
sole parent beneficiary<br />
families and households<br />
(Perry, 2009a, 2009b). 22<br />
Figure 4.1. Distribution of ELSI-3 scores by ethnicity, 2008 LSS<br />
(Source: Perry, 2009b, p. 52, Figure E2.6)<br />
The context of Whānau Ora<br />
The idea<br />
Rather than a defined programme, Whānau Ora is an idea or philosophy that underpins a framework<br />
for working with families. This framework is based on exploiting and increasing strengths within<br />
whānau rather than focusing on fixing the deficiencies exhibited by the individuals within that whānau.<br />
Interventions are created by whānau in conjunction with whānau support workers, and are aimed at<br />
ensuring whānau participation in the community and positive results for whānau instead of focusing<br />
interventions on individuals who present with complex needs. This is an approach that has been<br />
described as resonating not only with Māori, but with all Pacific peoples (Tu’itahi, 2010):<br />
a strengths-based approach is derived from the resilient and tenacious values and principles of<br />
the collective such as whānau or bigger human formations such as communities.<br />
The framework<br />
In order to give some structure and flesh to the original notion of Whānau Ora, a taskforce was<br />
created and charged with creating a usable framework for the implementation of the whānau-centred<br />
approach. This was to be an ‘evidence-based framework that will lead to:<br />
• strengthened whānau capabilities;<br />
• an integrated approach to whānau well-being;<br />
• collaborative relationships between state agencies in relation to whānau services;<br />
• relationships between government and community agencies that are broader than contractual;<br />
• improved cost-effectiveness and value for money.<br />
22 By June 2009, 43% of DPB recipients were Māori.<br />
35
The nominated taskforce carried out some consultation and created the resulting Whānau Ora<br />
framework as represented in the diagram below (Figure 4.2).<br />
Figure 4.2. Whānau Ora Framework (Whānau Ora Taskforce, 2010, p. 7)<br />
The framework was presented to the Crown as being underpinned by six key principles (Whānau<br />
Ora Taskforce, 2010):<br />
• Ngā kaupapa tuku iho (the Māori values, beliefs and obligations that guide a whānau in day-today<br />
life);<br />
• Whānau opportunity (the notion that all whānau should have ‘chances in life that will enable<br />
them to reach new heights’);<br />
• Best whānau outcomes (the understanding that the success of Whānau Ora is to be measured<br />
by increased whānau capacity to achieve well-being for Whanau and its members);<br />
• Coherent service delivery (the establishment of unified intervention to ensure that the divisions<br />
and distinctions between agencies involved with whānau do not frustrate, subvert, or undermine<br />
the needs of the whānau);<br />
• Whānau integrity (the presumption that all whānau have a code of responsibility that would<br />
ensure dignity, accountability and innovation. This principle is important to ensure that each<br />
whānau is strengthened in its ability to follow such a code, notwithstanding stressors or events<br />
that may undermine or subvert it);<br />
• Effective resourcing (whānau must be resourced according to their needs, in order to achieve<br />
the best possible results for that whānau. Also, results must reflect the resources utilised with<br />
whānau, as demonstrated by clearly set out indicators of success);<br />
• Competent and innovative provision (acceptance of the fact that to be successful, Whānau<br />
Ora will need to ensure skilled practitioners work with whānau who are able to “go beyond crisis<br />
intervention” to assist whānau to build their own capacity).<br />
36
It is yet to be seen if, over time, the principles set out above will attain the sort of respected status<br />
that are enjoyed by other social policy instruments such as the Woodhouse Report enumerating<br />
the principles of the ACC scheme (Royal Commission to Inquire into and Report Upon Workers’<br />
Compensation, 1967), or the McCarthy Report that sets out retrospectively the principles upon<br />
which our social security system was deemed to be founded in 1972 (Royal Commission on Social<br />
Security, 1972a). Nevertheless the Whānau Ora principles and their framework deserve attention for<br />
the important characteristic that distinguishes the Taskforce’s report from those earlier publications.<br />
The entire social security system (comprising social assistance by way of benefits and social insurance<br />
by way of ACC) has, at its core, the concept of the individual who has been stopped from earning an<br />
income, or prevented from earning a full income due to the operation of a social contingency such as<br />
personal injury, childrearing, disability, or unemployment. While both the McCarthy and Woodhouse<br />
reports identify that such individuals belong in family units that also require support, and that the<br />
community is responsible to some degree for providing social security to those individuals, the<br />
mechanisms of delivery (such as income replacement and income adjustment) require engagement<br />
with an individual. Case management centres on individual needs, support is provided on the basis<br />
of individual deficiencies. The notion of the free individual is the core organising principle at the heart<br />
of our social security system, and also at the heart of our notion of criminal liability, the law of private<br />
obligations, and even at the heart of our democratic system.<br />
The Whānau Ora approach subverts the primacy of the individual, and yet those who will implement<br />
the approach must continue to work within a legal, governmental and political system that is formed<br />
and informed by this principle. Some exploration of the nature of the social security system as it<br />
pertains to Māori may clarify the size of the obstacle Whānau Ora faces in trying to make headway<br />
in families that are reliant on support from that system.<br />
Māori and Social Security<br />
Māori have had a complicated relationship with the New Zealand social security<br />
system from the passage of the Social Security Act 1938 and the more ad hoc<br />
welfare measures implemented before 1938. Despite consistent Māori efforts<br />
to adapt to and change the social security from the outside, unsurprisingly the<br />
system has been unable to deal effectively with Māori collectivist ways of living<br />
or desire for self-determination and sovereignty.<br />
Problems of individualisation of Māori needs<br />
Ultimately, as with other countries implementing formal social security (as opposed to informal social<br />
security relying on kin-based or charitable aid) the New Zealand social security system, in common<br />
with other industrialised nations, created an individualised system of entitlements whereby the State<br />
stood in for the (typically male) wage-earning labourer who, by reason of social contingency, had<br />
been excluded from working (Stephens, 2011, p.132). If a man lost his job, state-provided income<br />
replacement could ensure that the worker and ‘his’ family could at least survive at a very basic level,<br />
and the worker could eventually be returned to economic productivity. If a woman was widowed or<br />
deserted by her spouse, the state could then ‘step into’ the shoes of the absent male wage labourer,<br />
thereby ensuring that the family could survive and eventually return to economic productivity once<br />
the needs of the children no longer required full-time care, or could themselves enter into the labour<br />
market. Such a social investment would prove less costly to the state than the costs that might be<br />
37
incurred if families were allowed to break down entirely by being forced into reliance on charity or<br />
family members.<br />
It took a great deal of time for Māori to fit into this very limited picture of an economically productive<br />
society. Throughout the first half of the 20th century Māori were rebuilding after the traumas of the<br />
19 th century had decimated the population. As the Māori population began to rebound after World War<br />
II, a predominantly rural population with close ties to traditional tribal social and cultural structures<br />
transformed into a predominantly urban population, often separated from land and tribal structures<br />
and those traditional means of welfare. 23<br />
Considering the massive changes that took place in Māori<br />
society, it is interesting to note that Māori attitudes to the new<br />
social security system established from 1938 were decidedly<br />
ambivalent. Renowned Ngāti Porou leader, politician and<br />
scholar Sir Apirana Ngata on the one hand, feared that Māori<br />
would become increasingly disenfranchised from their traditional<br />
tribal lands and culture as a result of social security benefits. In<br />
his view Māori ought to be able to retain their tribal identity and<br />
provide for their own. On the other hand, other important Māori<br />
leaders such as T.W. Rātana, charismatic prophet and leader<br />
of the politically influential Rātana movement, saw important<br />
opportunities in the growth of the welfare state for Māori to attain<br />
a level of social equality that had been denied them (Cheyne,<br />
O’Brien, & Belgrave, 2005).<br />
Rātana Church in Raetihi<br />
Indeed, a citizenship-based discourse which emphasises commonality between Māori and Pākehā in<br />
New Zealand has a long history. Formal discrimination against Māori ended in 1935 with the election<br />
of the Labour Government, which cemented its alliance with the Rātana political movement in 1936<br />
(Henderson, 1963). The movement provided successful Rātana candidates for the four guaranteed<br />
Māori electoral seats, and the alliance between Rātana and Labour pursued assimilationist policies<br />
that sought to achieve Māori equality with other New Zealanders and socio-economic development. 24<br />
The Māori contribution to New Zealand’s role in World War II, as exemplified by the exploits of the<br />
Māori Battalion, also led to high Māori expectations that they would be accepted as full citizens within<br />
mainstream society and attain a level of control over their own affairs. For example, with the beginning<br />
of World War II, Apirana Ngata urged Māori enlist for military service in a 1940 pamphlet entitled The<br />
Price of Citizenship, an important expression of an idea of common citizenship as demonstrated<br />
by Māori and Pākehā participation in the armed struggle for national defence. Notwithstanding his<br />
view that universally applied benefits under the Social Security Act 1938 were, in large measure,<br />
dangerous to Māori abilities to manage their own destinies, he saw no contradiction in a full-throated<br />
support of the Māori war effort on the basis of shared citizenship: 25<br />
23 For a very useful account of the critically important role urbanisation has had in the reformation of Maori communities,<br />
see Durie (2005).<br />
24 Māori have had guaranteed electoral representation since the passage of the Māori Representation Act 1867. For a full<br />
account of the establishment and history of the Māori seats see Wilson (2010).<br />
25 “Response to war – Maori and the Second World War”, URL: http://www.nzhistory.net.nz/war/maori-in-second-world-war/<br />
response, (Ministry for Culture and Heritage), updated 20 Oct 2008. See also Meredith (2000).<br />
38
We are participants in a great Commonwealth, to the defence of which we cannot hesitate to<br />
contribute our blood and our lives. We are the possessors of rights which we must qualify to<br />
exercise, also of obligations which the Maori must discharge always in the future as he has done<br />
in the past. We are of one house, and if our Pakeha brothers fall, we fall with them. How can we<br />
ever hold up our heads, when the struggle is over, to the question, “Where were you when New<br />
Zealand was at war?”<br />
Given the Māori sacrifice in World War II, hopes were high in the weeks and months leading up to the<br />
passage of the Māori Social and Economic Advancement Act 1945 (Hill, 2004). This new legislation<br />
was supposed to herald a new dawn of Māori cooperation and involvement in social decisionmaking<br />
with the State and the Native Affairs Department (later to be known as the Māori Affairs<br />
department, now defunct). In reality the new dawn of the post-war era heralded several grey decades<br />
where Māori aspirations were often submerged within the overall drive towards assimilation. Even<br />
during the height of the assimilationist era, many examples of differential treatment still persisted in<br />
practice. Such discrimination was brought to light in the Pūaoteatatū (Daybreak) 1986, report by the<br />
specially convened Ministerial Advisory Committee on a Māori Perspective for the Department of<br />
Social Welfare (Ministerial Advisory Committee on a Māori Perspective for the Department of Social<br />
Welfare, 1988).<br />
In social policy the tension between ideas of common citizenship<br />
and long-lived notions of rangatiratanga is particularly starkly<br />
observed because social laws and mechanisms are supposed<br />
to be universally applied, tribal and community affiliation<br />
notwithstanding. Yet, in line with the notion that Māori have the<br />
right to control their own destinies, Māori have been consistent<br />
in calling for greater control of resources and decision-making over Māori families and whānau<br />
development. This consistent thread can be seen throughout the 20th century, and continues today.<br />
The early drafts of the Māori Social and Economic Advancement Bill of 1945, for example, were<br />
drafted by a Māori working party convened by Eruera Tirikatene and included substantial measures<br />
for Māori decision-making and a reconfiguring of the Native Affairs Department that were mainly<br />
rejected. Such pressure for Māori control over social policy began to re-emerge strongly in the public<br />
view in the 1970s and 1980s (Hill, 2004).<br />
Similarly the Pūaoteatatū report reiterated the call for Māori to have Māori control over decisionmaking<br />
for Māori social well-being (Ministerial Advisory Committee on a Māori Perspective for the<br />
Department of Social Welfare, 1988, para 72):<br />
As we travelled around the country, the most consistent call we heard was for Maori people to be<br />
given the resources to control their own programmes. We have responded to this in ways that do<br />
not discriminate against people of any culture while enabling Maori people to share and to control<br />
where applicable the allocation of resources in communities.<br />
Despite this ongoing call for Māori to have such control, the Hon. Pita Sharples also used a recent<br />
speech to underscore his concerns of an increasing prevalence for treaty settlements between iwi<br />
and the Crown to contain agreements on social provision, which in his view, despite the call of<br />
rangatiratanga, must remain a Crown responsibility (Sharples, 2010):<br />
Persistent disparities between Māori and non-Māori, and the failure of government to deliver<br />
services in ways that resonate with Māori communities, are ongoing. And they seem to require<br />
39
claimant groups to spend valuable negotiations effort and funding on getting an assurance that<br />
government will do the basic job that taxpayers fund it to do. So I am extremely concerned about<br />
the development of social and environmental accords in Treaty settlements the need for these<br />
accords shows.<br />
This view encapsulates, to an extent, the conflict between the Māori drive to reclaim rangatiratanga<br />
while at the same time seeking to achieve social equality with other New Zealanders that can only<br />
be financed by the state. No other body exists other than the State with the resources to advance<br />
the equal participation of Māori in New Zealand society, or indeed the survival of large numbers of<br />
Māori throughout the country in times of need and crisis. Recently, measures to enhance or provide<br />
for more Māori input into the social security system specifically have focused on intensive case<br />
management, and the development of partnerships with some iwi in creating further and better job<br />
opportunities for Māori (Ministry of Social Development, 2010d). The social security system itself is<br />
neither challenged nor changed by these sorts of initiatives.<br />
Whānau Ora, then, as a ‘grand idea’ and initiative may herald greater Māori involvement in decisionmaking<br />
with regard to social policy than has previously been achieved. A greater level of rangatiratanga,<br />
in the sense of greater influence and control over social policy may well be achievable. Whether such<br />
an achievement will enhance the citizenship and rangatiratanga for whānau Māori within the social<br />
security system is, as yet, questionable.<br />
He Korowai Oranga<br />
The collectivist whānau-centred approach is neither entirely novel nor new. As mentioned in the<br />
Introduction, the Whānau Ora approach primarily evolved out of substantial policy work done in the<br />
development of the Māori Health Framework, He Korowai Oranga in 2002. The overall aim of the<br />
strategy is “Whānau ora: Māori families supported to achieve their maximum health and well-being”<br />
(Whānau Ora Taskforce, 2010).<br />
The Māori Health Strategy may have, in conjunction with other policy measures, some positive impact<br />
on health outcomes for Māori. Recent data analysis suggests a significant causal link between the<br />
implementation of pro-equity health strategies (incorporating He Korowai Oranga) and improving<br />
mortality indicators (Tobias, Blakely, Matheson, Kumanan Rasanathan, & Atkinson, 2009). This<br />
internationally reported research investigated trends in mortality rates in New Zealand for Māori and<br />
Pākehā between 1951 and 2006. In particular the study identified causal links between the neoliberal<br />
reforms of the late 1980s and 1990s and widening disparity in mortality rates, as well as the<br />
implementation of pro-equity strategic health measures (incorporating He Korowai Oranga) and a<br />
narrowing of that disparity gap (Tobias, et al., 2009, p.1720):<br />
…the pattern seen in New Zealand of widening then narrowing ethnic health inequalities coinciding<br />
with neoliberal followed by pro-equity changes in social and health policies suggests that both<br />
changes in the distribution of social determinants and an appropriate health system response<br />
may be required to achieve timely gains in health equity. The New Zealand experience implies<br />
that action by the health sector alone is necessary but not sufficient to address health inequalities.<br />
The study also went on to suggest that the lag between the implementation of pro-equity policies and<br />
observable results may be relatively short (Tobias, et al., 2009, p.1720):<br />
40
Thus policies designed to improve daily living conditions and address the structural determinants<br />
of the health of indigenous populations (or ethnic minorities) by improving their relative economic<br />
position may yield health equity benefits within 5 years.<br />
Other more qualitative research carried out with Māori health providers indicates that there has been<br />
some ambivalence among providers about the effectiveness of He Korowai Oranga and the ability for<br />
the strategy to deliver actual health benefits for Māori at a practical level (Boulton, Simonsen, Walker,<br />
Cumming, & Cunningham, 2004).<br />
While Whānau Ora evolved primarily from the health sector, other long-running “family centred”<br />
programmes managed by the Ministry of Social Development are also designed to assist whānau<br />
and work alongside whānau to achieve better whānau outcomes. Two examples of such intervention<br />
are Early Start and Family Start. These programmes will undoubtedly have some level of influence<br />
on the delivery of Whānau Ora, if only because many of the Whānau Ora providers will also be<br />
Family Start (and in Christchurch, Early Start) providers. 26 The experiences of these programmes<br />
may provide some important lessons for the delivery of Whānau Ora.<br />
Early Start<br />
Early Start is a Christchurch-based initiative, funded by the Family and Community Services unit of<br />
the Ministry of Social Development, whereby family/whānau workers may be allocated to qualifying<br />
families to support those families with an early intervention programme from the time of a child’s<br />
birth up to 36 months to achieve better health, education and welfare outcomes. 27 A randomised<br />
trial-based evaluation of the Christchurch-based initiative was carried out in 2005, and the evaluation<br />
report acknowledged that 90% of the Early Start client base were in receipt of welfare benefits.<br />
Accordingly, the initiative included within it a range of measures designed to assist clients to achieve<br />
improved economic circumstances. The report stated (D. Fergusson, John Horwood, Ridder, &<br />
Grant, 2005, p.40):<br />
Encouraging family economic and material well-being: Since many participants in the Early Start<br />
programme were single parents, they were often subject to a series of economic limitations that<br />
spanned welfare dependence, economic deprivation and financial hardship. These difficulties in<br />
turn were likely to exacerbate other issues facing families. To address this issue the goals of Early<br />
Start spanned the following areas:<br />
• Reducing levels of welfare dependence.<br />
• Encouraging the use of budgeting and budgeting services.<br />
• Encouraging workforce participation.<br />
• Encouraging forward economic planning and saving.<br />
In the evaluation, Early Start clients and control groups were compared on a series of measures of<br />
economic and material well-being including welfare reliance; family income; family debt; parental<br />
workforce participation; and the adequacy of accommodation. While significant levels of success<br />
were observed for other aspects of the initiative there was no evidence that the intervention aimed at<br />
assisting Early Start clients to improve their economic fortunes had any observable effect on those<br />
26 See http://www.tpk.govt.nz/en/in-focus/whanau-ora/providers/ for a list of current Whānau Ora providers.<br />
27 Early Start was recently assessed with other home-based intervention programmes for efficacy in preventing child abuse<br />
and neglect. This assessment includes a description of the development of the programme.<br />
41
clients when compared with those in the control group who did not receive such intervention (D.<br />
Fergusson, et al., 2005).<br />
Family Start<br />
The Family Start programme was implemented on a national basis due to three primary concerns that<br />
arose out of government-commissioned research on disadvantaged families. Firstly, disadvantage<br />
in a socio-economic sense will often be self-perpetuating and children born in families experiencing<br />
such disadvantage were at higher risk of experiencing such disadvantage themselves. Secondly,<br />
and relatedly, children from families where the main long-term source of income was welfare benefits<br />
were three times more likely than other children to end up in receipt of such benefits themselves in<br />
adult life. The third factor arising from this research was the fragmentation and gaps in the services<br />
such vulnerable families received. Comprehensive research reviews had shown that results from<br />
international and New Zealand home-based family intervention programmes had led to “mixed findings<br />
with regard to individual programme effectiveness” (Centre for <strong>Child</strong> and Family Policy Research,<br />
2005, p.11). These factors led to the implementation of Family Start in 1998, now maintained as an<br />
initiative that is part of the Strengthening Families Strategy.<br />
Like Whānau Ora, Family Support is also strengths based (concentrating on identifying family<br />
strengths and working with families to make the most of those strengths). 28 Some identified success<br />
criteria for evaluation of the Family Support programme included (among others) the following socioeconomic<br />
indicators for long-term success within the families of vulnerable children:<br />
• More independent lifestyle, including less benefit dependency;<br />
• Stable living situation including standard and security of housing, materials met;<br />
• Adults in employment or training.<br />
While the Family Start programme is designed to provide focus on the needs of children, unsurprisingly,<br />
the two top goals recorded by participating caregivers in the evaluation (2005, p.49) included:<br />
• Achieving better educational/training; and<br />
• Achieving better employment/income.<br />
One of the strongest successes of the Family Start programme during the period of evaluation<br />
(2002–2003) was that the percentage of caregivers in employment rose from 13% to 40% (Centre<br />
for <strong>Child</strong> and Family Policy Research, 2005 , p.103). This change was seen to account for increased<br />
vehicle ownership and less reliance on others to meet transport needs. The report stated this result<br />
was encouraging, but did not affect benefit reliance in any way (Centre for <strong>Child</strong> and Family Policy<br />
Research, 2005, p.103):<br />
It is interesting to note that, despite the significant increase in employment rates, the percentage of<br />
caregivers identifying a government benefit as their main source remained essentially unchanged<br />
across the two years (around 60%). This is probably linked to the type of work being undertaken,<br />
which was largely unskilled, low paid and part time. However, there are other known benefits<br />
associated with being in the workforce aside from financial reimbursement, such as extended<br />
28 See also the Family Start interventions provided by Māori providers such as Kōkiri Marae at http://www.kokiri.org.nz/<br />
index-2.html.<br />
42
social networks and increased self-esteem. All these workforce benefits have the potential to<br />
have positive impacts on caregivers and their children.<br />
This unchanged benefit reliance is consistent with the results also found in the evaluation of the<br />
Christchurch-based Early Start programme mentioned above. The evaluations of the Early Start<br />
and Family Start initiatives suggest that, while participating families may be assisted to make better<br />
budgeting choices and gain low-paid and low-skilled work, it is less likely that such families will be<br />
able to shift off the benefits by virtue of these interventions. Therefore, low income and relative<br />
poverty will remain a serious issue for such families. Indeed, the fact of poverty itself for these<br />
families was considered by the Family Start workers themselves to comprise significant obstacles<br />
to the success of the interventions (Centre for <strong>Child</strong> and Family Policy Research, 2005, p.83). Put<br />
more simply, poverty is a barrier to the potential effectiveness of measures that would assist in the<br />
alleviation of poverty (Centre for <strong>Child</strong> and Family Policy Research, 2005, p.83):<br />
<strong>Poverty</strong> and a serious lack of material resources (including means of transport) were problems that<br />
often hindered progress. Lack of suitable, affordable housing in some areas (especially Nelson)<br />
was a significant problem, contributing to overcrowding and associated health issues for families.<br />
However, ensuring that families received good budgeting advice could make a significant difference in<br />
member families being able to cope better with low incomes. In the evaluation report a comment from<br />
Work and Income regarding Family Start’s effectiveness identified this as an important improvement<br />
(Centre for <strong>Child</strong> and Family Policy Research, 2005, p.95):<br />
Families have got their budgets under control,<br />
they are less in debt, they are paying their<br />
rent and power and have the ability to buy<br />
food. Their personal appearance is improved<br />
and their children are attending school. Some<br />
mums are looking at training to upskill. One<br />
sole parent we would not give up on … she<br />
had the hardest life … When Family Start<br />
came along a particular person took her<br />
on, she’s turned around, her appearance,<br />
children are going to school, and budgeting.<br />
Family Start slowly weaned her off and got her<br />
independence back, it was a slow process.<br />
They provided intensive support, went and<br />
got the kids ready for school, paid the power,<br />
were there when the kids got home from<br />
school. It allowed her to see another way.<br />
These observations and the fact that benefit<br />
reliance remained constant despite the Family<br />
Start intervention suggests that poverty is likely<br />
to remain prevalent despite such intensive family-based intervention. On the other hand empowering<br />
families to make better decisions with the incomes they have may well be a feasible and achievable<br />
goal for such interventions.<br />
43
Whānau Ora may well be able to effect such improvements, but previous experience suggests<br />
that Whānau Ora-based intervention may not achieve a significant change in benefit reliance. As<br />
discussed earlier, the unchanging, individualistic nature and structure of the social security system<br />
may contribute to its ongoing presence in the lives of whānau regardless of the level of intervention.<br />
While Whānau Ora may well succeed in assisting whānau to utilise their strengths and improve their<br />
conditions, there will be no flexibility or cognisance taken of whānau-specific needs in the delivery of<br />
income support or income replacement.<br />
This chapter has no suggestions as to what sort of reform would be necessary to ensure that the<br />
structure of social security can meet the needs of whānau as well as of individuals. There is no doubt<br />
that social security is what stands between many whānau and utter destitution. What is needed is<br />
a revisioning of our social security system, a fundamental review that the Welfare Working <strong>Group</strong><br />
abjectly failed to deliver. Until such change can be brought about it is unlikely that interventions such<br />
as Whānau Ora can make much difference to the relative poverty levels experienced by whānau.<br />
Whānau Ora may well make such poverty in the lives of Māori children more bearable and survivable,<br />
a good outcome in itself, but perhaps all New Zealand children deserve better.<br />
Recommendations:<br />
• A true, fundamental review of the social security system that does not threaten the amount of<br />
income support that is given to families in need, but seeks to identify ways to make the existing<br />
system less individualistic and more responsive to whānau needs;<br />
• This review needs to be carried out in true conjunction with Māori;<br />
• That Whānau Ora providers give assistance and training in social security provisions to whānau<br />
to ensure whānau are fully apprised of their entitlements.<br />
44
Chapter 5. New Zealand Pacific <strong>Child</strong>ren<br />
and Their Families<br />
Teuila Percival 29<br />
Introduction<br />
Within two decades, almost one in five of children in New Zealand will be Pacific (Ministry of Social<br />
Development, 2010b; Statistics New Zealand, 2010b). With their predicted growth in numbers,<br />
Pacific will be major contributors to New Zealand’s economic and social success or its failure. Pacific<br />
children’s health and educational success are critical foundations not just for the Pacific Communities<br />
but for the whole country.<br />
Pacific children in New Zealand<br />
“Pacific”, is an inclusive term of convenience used to describe an increasingly diverse population<br />
group in New Zealand. Hailing from the many Islands of the South Pacific, the most numerous are<br />
Samoan, Cook Island, and Tongan with smaller numbers from other islands (Statistics New Zealand<br />
and Ministry of Pacific Island Affairs, 2010a). Pacific people in New Zealand are an increasingly<br />
heterogeneous group with over half now being New Zealand born (Statistics New Zealand and<br />
Ministry of Pacific Island Affairs, 2010a) and two thirds of Pacific young people today identifying with<br />
more than one ethnic group (Helu, Robinson, Grant, Herd, & Denny, 2009).<br />
New Zealand has made considerable progress over the past decades. Pacific children however,<br />
have a very different experience with continuing disparate health and social outcomes compared<br />
with other New Zealand children. Pacific people are particularly vulnerable economically due to<br />
lower educational levels, a labour force predominantly in ‘blue collar’ low-paid jobs, low-median<br />
household incomes, and high unemployment. The effect of welfare reforms and market rents in<br />
the 1980’s and 90’s was to push more Pacific families and children into poverty (Ministry of Social<br />
Development, 2007). The recent global economic recession has also impacted on Pacific children<br />
both with measures of poverty and hardship and health (The <strong>Child</strong>ren’s Social Health Monitor, 2009).<br />
There are some positive gains such as retention of language in some Pacific ethnic groups (Helu, et<br />
al., 2009), increasing numbers of Pacific children enrolling in pre-school education (Statistics New<br />
Zealand and Ministry of Pacific Island Affairs, 2010a) and a dramatic reduction in Pacific meningococcal<br />
disease following the 2004 MenzB mass vaccination campaign (O’Hallahan, McNicholas, Galloway,<br />
O’Leary, & Roseveare, 2009). But these gains, important as they are, continue to be overwhelmingly<br />
subsumed by poor Pacific health, less educational success and increasing economic hardship.<br />
Infant mortality (death rate before the first birthday) is often used as a marker of national child wellbeing.<br />
Pākehā and Māori infant mortality in particular has declined over the past decades (Ministry of<br />
Health, 2004). Pacific mortality has essentially remained unchanged. Current Pacific infant mortality<br />
is above 6 per 1000 live births compared with less than four for non-Pacific–non-Māori (The New<br />
Zealand <strong>Child</strong>rens Social Health Monitor, 2011).<br />
Pacific children do not live in isolation. Their lives are inextricably linked to the well-being of parents<br />
and wider community.<br />
29 Dr Teuila Percival, QSO, MBChB, FRACP. Consultant Paediatrician, KidzFirst <strong>Child</strong>rens Hospital, CMDHB. Director of<br />
Pacific Health, School of Population Health, University of Auckland.<br />
45
Pacific families in New Zealand<br />
Low household incomes and the marked inequality between Pacific incomes and other New<br />
Zealanders shape health, educational and social outcomes for our families. Pacific median household<br />
income is lower than non-Pacific people (Ministry of Social Development, 2007, 2010b). However the<br />
additional financial commitments of Church, and remittances to extended family back home in the<br />
Islands, result in Pacific families having even less money available for themselves (Tumama Cowley,<br />
Paterson, & Williams, 2004). Essentials such as healthcare for children may take second place to the<br />
other priorities of rent and cultural commitments. Pefi Kingi (2008) writes of Pacific families:<br />
..the family is the cornerstone of personal life from birth to death, and identity can centre on one’s<br />
roles, duties and responsibilities within the family… it maybe that collective well-being is awarded<br />
a higher priority than that of the individual, particularly if that individual is a sick child. (Craig,<br />
Taufa, Jackson, & Han, 2008, p. 12)<br />
Unemployment affects not only income and social status but also physical and mental health and<br />
community participation. Pacific unemployment continues to be higher than for other New Zealanders,<br />
and as Figure 5.1. shows,<br />
Figure 5.1. Quarterly Unemployment Rates by Total Response Ethnicity<br />
the trend is worsening with<br />
Quarter 4 (December) 2007 to Quarter 3 (September) 2010 (Source: The<br />
the recent global financial<br />
<strong>Child</strong>ren’s Social Health Monitor, 2011)<br />
downturn such that the Pacific<br />
unemployment rate was<br />
almost 14% in 2010 (Helu, et<br />
al., 2009), and reached 15.5%<br />
by June 2011 (Department of<br />
Labour, 2011a).<br />
<strong>Poverty</strong>, particularly when<br />
it is an entrenched part of<br />
childhood, is associated with<br />
poor health, education, and<br />
economic outcomes. Such<br />
outcomes cast a long shadow<br />
extending into adult life (Aber<br />
& Bennett, 1997).<br />
A Ministry of Health report (2008) shows that 40% of Pacific children are growing up in poverty. Benefit<br />
cuts, increased housing costs and high unemployment rates have contributed to this continuing<br />
poverty since 1990 (see Figure 5.2).<br />
The Ministry of Social Development’s Living Standards report documents Pacific families with<br />
dependent children as being more likely to be living in hardship than other ethnic groups (Ministry<br />
of Health, 2008). The proportion of Pacific children living in severe hardship at 30% almost doubled<br />
between 2000 and 2004 (see Figure 5.3). With another 31% living in ‘significant’ or ‘some’ hardship,<br />
New Zealand had over 60% of Pacific families living in hardship by 2006 (Ministry of Health, 2008).<br />
Hardship measures include children having to share a bed, not being able to afford to go to the<br />
doctor, being unable to afford shoes and wet-weather clothing, and not going on school outings<br />
because of cost.<br />
46
Figure 5.2. Proportion of <strong>Child</strong>ren in Low Income Households by ethnicity 1982-<br />
2004 (Source: Ministry of Health, 2008).<br />
Figure 5.3. Living Standards of Families with Dependent <strong>Child</strong>ren in New Zealand by ethnicity (2004)<br />
(Source: Ministry of Social Development, 2006b)<br />
Health and well-being<br />
<strong>Child</strong>ren grow up in families. The health of families, in particular that of the adults who are Pacific<br />
children’s caregivers, impacts on them directly and indirectly via household income and ability<br />
to access resources and healthcare. Pacific adults in New Zealand as a population group have<br />
poorer health than most New Zealanders with the double burden of high rates of non-communicable<br />
diseases and infectious diseases, together with continuing high rates of avoidable premature<br />
mortality (Ministry of Health, 2005a; Novak, 2007). The picture is of an adult Pacific population with<br />
poor health determinants, of low household income and high unemployment, high prevalence of<br />
intermediate risk factors such as obesity and hypertension, and high prevalence of diseases such as<br />
diabetes and ischaemic heart disease (Ministry of Health, 2005a; Novak, 2007).<br />
47
Most notably, Pacific have not shown the same reduction in all age mortality seen with Māori and<br />
Pākehā (Blakely, Tobias, Atkinson, Yeh, & Huang, 2007). Effectively this has seen an increase in the<br />
disparity between Pacific life expectancy and that of other New Zealanders. This burden of disease<br />
and avoidable mortality in the adults who are the caregivers for our Pacific children impacts on<br />
children’s well-being and ability to access resources including healthcare.<br />
Pacific children also experience Figure 5.4. Hospital Admissions due to Pneumonia in <strong>Child</strong>ren and<br />
poorer health than other New Young People 0-24 Years by Ethnicity, 1996-2006 (Source: Craig, 2008)<br />
Zealand children. The Ministry<br />
of Health (2005a) identified a<br />
number of Pacific child health<br />
concerns, including the highest<br />
child rates of obesity, highest<br />
child hospitalization rates for<br />
acute and chronic respiratory<br />
and infectious disease and<br />
serious skin infection. Recently<br />
the New Zealand <strong>Child</strong> and<br />
Youth Epidemiology Service<br />
has published four reports on<br />
the health of Pacific <strong>Child</strong>ren<br />
and Young People in New<br />
Zealand (Craig, Anderson, Taufa, & Jackson, 2009; Craig & et al., 2011; Craig, McDonald, Wicken,<br />
Reddington, & Taufa, 2010; Craig, et al., 2008). These reports also document the continuing poor<br />
health of Pacific children in New Zealand. For example, pneumonia is one of the leading causes for<br />
hospitalising children (see Figure 5.4).<br />
Pacific children’s rates of hospitalisation are the highest in New Zealand, being twice that of Māori<br />
and four times that of Pākehā (Craig, et al., 2008). As shown in Table 5.1, acute rheumatic fever<br />
in Pacific is twice that of Māori and 50 times that of Pākehā (Craig, et al., 2009). This potentially<br />
preventable condition with serious long-term cardiac sequelae is associated with poverty (Craig, et<br />
al., 2009) and overcrowding (Jaine, Baker, & Venugopal, 2011).<br />
The pattern of high Pacific child hospitalisation rates shown in Table 5.1 is also apparent for other<br />
acute infectious diseases, such as cellulitis, meningitis, gastroenteritis and asthma. 30 Pacific children<br />
also seem to present to hospital with more advanced or severe disease raising concerns with barriers<br />
to accessing both primary and secondary care (Grant, 2001). A similar pattern is seen in Pacific adults<br />
with more advanced disease presenting late to primary and secondary healthcare (Novak, 2007).<br />
The lack of health service co-ordination and the continuing financial costs involved are barriers for<br />
our low-income Pacific households.<br />
30 See Chapter 12, <strong>Child</strong>ren’s health in Aotearoa.<br />
48
Table 5.1. Risk Factors for Hospital Admission due to Acute Rheumatic fever in <strong>Child</strong>ren and Young<br />
People 0-24 Years, New Zealand 2003-2007 (Source: Craig, 2009)<br />
Maternal health is particularly important to child health. Notably high rates of obesity in Pacific women<br />
and poor antenatal care attendance (Ministry of Health, 2005a) affect Pacific infant morbidity and<br />
mortality and late foetal deaths (Craig, et al., 2010; Stacey et al., 2011). As with much of the morbidity<br />
seen with Pacific children, many of these deaths are preventable with access to effective healthcare<br />
and improved socio-economic circumstances.<br />
The most important determinant of Pacific children’s health status and continuing health inequality<br />
is poverty. A policy environment that addresses child poverty is a critical part of reducing health<br />
inequality for our children.<br />
Appropriate healthcare can be an effective means to address inequalities. The New Zealand<br />
Healthcare sector has developed some programmes which have been effective for Pacific children<br />
such as the Healthy Housing programme (G. Jackson et al., 2011a) and the MenzB national<br />
immunization campaign (O’Hallahan, et al., 2009). Both of these programmes were cognisant of<br />
Pacific disparities and built into their design strategies to achieve specific Pacific targets. Mainstream<br />
Primary HealthCare and the Primary HealthCare strategy have failed to address child health<br />
inequalities and to effectively reach those most in need such as Pacific.<br />
Education enrolment, retention and qualifications are important for the health and economic<br />
success of a population. Our Pacific children, along with Māori, are more likely to leave school<br />
without qualifications than other New Zealanders (Statistics New Zealand and Ministry of Pacific<br />
Island Affairs, 2010b). The education sector is showing some improvements both with Pacific preschool<br />
enrolments and NCEA 1 achievement in schools. In 2008, 76.3% of Pacific achieved NCEA 1<br />
compared with 59.7% in 2005 (Statistics New Zealand and Ministry of Pacific Island Affairs, 2010b).<br />
Given the critical role that education plays as a determinant of health and socio-economic success,<br />
this provides a small degree of optimism for Pacific people.<br />
The Fonofale Model<br />
There are other dimensions for Pacific when considering well-being. Puloto-Endemann’s Fonofale<br />
model depicts the determinants and areas of Pacific health and well-being (Pulotu-Endemann,<br />
2009). With its Pacific holistic view it has been used previously to describe negative social and health<br />
effects on Samoan children (Lindsay & Percival, 2011). With the aiga or family as the foundation, and<br />
culture providing shelter for physical, spiritual, mental health and socio-economic status (see Figure<br />
5.5), it can also be used to describe and explain the negative effects of surrounding stressors such<br />
as economic recessions or welfare reform. It can also give some insight into the resiliency seen in<br />
Pacific children.<br />
49
The model reminds us of all that<br />
is important for Pacific children’s<br />
well-being: family, culture,<br />
social connections, economic<br />
security, environment, mental<br />
and physical health and could<br />
be a framework for designing<br />
integrated strategies and<br />
interventions for Pacific.<br />
Figure 5.5. Fonofale Model (Source: Puloto-Endemann, 2009)<br />
Pacific children are an important<br />
group for all communities in New<br />
Zealand, not just for their own<br />
ethnic communities. Their wellbeing<br />
is part of the well-being of<br />
the nation. To achieve traction<br />
in the reduction of the enduring<br />
disparities in their health and<br />
socio-economic circumstances requires a commitment from leaders in Pacific communities through<br />
to Government agencies and parliamentarians.<br />
Health services certainly have a role but the most important strategies will need to affect all<br />
determinants of child poverty, overcrowding and education.<br />
There is no great virtue in encouraging healthy lifestyles in poor areas without also attempting to<br />
redress the structural inequalities that limit human lives and aspirations.....<br />
In short, health promotion will be of limited value if it is not accompanied by fundamental changes<br />
that guarantee human dignity and full inclusion in society and the economy. (Professor Sir Mason<br />
Drurie, Mauri Ora, 2001)<br />
Recommendations<br />
Seek a commitment from leaders in Pacific communities, Government agencies, and parliamentarians<br />
to:<br />
• Address inequalities with appropriate healthcare;<br />
• Design integrated strategies and interventions for Pacific peoples.<br />
50
PART TWO<br />
Chapter 6. Working for Families<br />
Susan St John 31<br />
Introduction<br />
In the run up to the 2011 budget, Working for Families (WFF) was portrayed in the media by various<br />
commentators as overly generous, something nice to have, and an ill thought out, costly election<br />
bribe that Labour had used to win the 2005 election. For example:<br />
Dropping Working for Families, interest-free student loans and “free” early childcare would be the<br />
fastest way to reduce the budget deficit. (Hickey, 2011)<br />
Yet the scheme is not nearly as generous, well-designed<br />
or inclusive as the Australian scheme (see Appendix 3).<br />
Moreover the changes announced in the 2011 budget, while<br />
subtle and masked with soothing words about ‘gradual<br />
change’, are profoundly bad for families.<br />
WFF was not new in 2005 when it came in, but built on the existing framework of family assistance,<br />
and made a significant difference for families that met the work test. 32 Without the improvement in<br />
weekly child payments by 2007 when WFF was fully implemented, child poverty would have been<br />
very much higher. Nevertheless WFF has by no means been an unqualified success, nor have the<br />
2011 Budget changes been the kinds of reforms that were needed.<br />
<strong>Left</strong> <strong>Behind</strong> (2008) outlined the horrendously complex system of child-related tax credits that now<br />
comprise WFF. Unbelievably, in 2011 the system has become even more cumbersome, with few<br />
families understanding all the various parts of the package and the different rules that apply. Worse<br />
still, the complexity has served to produce a new raft of anomalies and inequities. One problem is<br />
WFF was not designed for recessions or catastrophes. Another is that it is based on a model of the<br />
labour market that was more appropriate to the middle of last century than today. Still another is that<br />
WFF is inconsistent with other family policies such as <strong>Child</strong> Support.<br />
But the needed changes are still possible. The Labour party in Opposition now is rethinking WFF:<br />
Annette King now admits Working for Families did not fully solve the child poverty problem, and<br />
that the children of beneficiaries also need to be lifted out of poverty. “There is an issue we’ve got<br />
to address now,” says King. “One hundred and thirty thousand kids were lifted out of poverty with<br />
Working for Families, but our work’s not finished. We’ve got another group of kids who haven’t<br />
benefited from that at all. And that’s people who are on benefits. We’ve got to rethink our policy<br />
in terms of how do we have an element of universality for our children in the way we give it to our<br />
old people. It’s unfinished business.” (Laugesen, 2009)<br />
31 Dr Susan St John, QSO, Associate Professor of Economics, University of Auckland, co-director of the Retirement Policy<br />
and Research Centre and a member of the Management Committee of <strong>Child</strong> <strong>Poverty</strong> <strong>Action</strong> <strong>Group</strong>.<br />
32 CPAG would like to thank Valmai Copeland, Inland Revenue Department, for her constructive comments on Chapter 6.<br />
This does not in any way imply IRD endorses the views expressed in this chapter.<br />
51
The biggest problem is that the design of Working for Families does not put the needs of the child at<br />
the centre. It manages to exclude the poorest children, and its critical purpose has become lost in a<br />
morass of arguments over entitlements, overpayments, abatements and work tests.<br />
According to the OECD’s 2011 report on family well-being:<br />
Family benefits need to be well designed to maintain work incentives, but they need to be effective<br />
in protecting the most vulnerable, otherwise we risk creating high, long-term social costs for future<br />
generations. (OECD, 2011b)<br />
Summary of background<br />
Family assistance in the form of per child, per week payments that go to<br />
the caregiver are widely used in developed countries to alleviate family<br />
poverty and to provide some acknowledgment that children reduce the<br />
parents’ ability to pay tax at all income levels. 33 Payments for children<br />
can be in the form of universal child benefits, tax exemptions, tax rebates<br />
or tax credits. <strong>Left</strong> <strong>Behind</strong> (2008) outlined how, by 1986, New Zealand<br />
had evolved a simple system in which all children, whether in families on benefits or in work, with<br />
high or low incomes, were entitled to a flat rate per child Family Benefit, and low-income families<br />
were entitled to an additional child-related tax rebate called Family Support. We had a nice balance<br />
between universal and targeted payments and most people understood the system. Moreover the<br />
payment was directly linked to the child and not to the source of parental income.<br />
But then, in the radical 1991 Budget, the Family Benefit was added to<br />
Family Support, and all child-related financial assistance became incometested<br />
against joint parental income. While this was an extreme policy,<br />
Family Support was at least paid to the caregiver, regardless of whether or<br />
not the family was reliant on a benefit. Unlike welfare payments, however,<br />
there was no automatic adjustment for inflation and income thresholds<br />
were rarely increased. Over the 1990s the real value of Family Support<br />
was eroded at the same time as child poverty emerged as a major social<br />
issue in New Zealand (St John & Craig, 2004).<br />
Policy took a turn for the worse in the 1996 Budget. Families were given a much needed catch-up<br />
for inflation, but many low-income children were excluded from the bulk of the increase: while Family<br />
Support was increased by $20, $15 was separated off and denied to children whose parents were<br />
on a benefit. This $15 per week per child payment was initially called the Independent Family Tax<br />
Credit (IFTC), reflecting its role as a reward for not being ‘dependent’ on the state. In 1996 the IFTC<br />
was renamed the <strong>Child</strong> Tax Credit (CTC), and under WFF was reinvented to become the In-Work<br />
Tax Credit (IWTC).<br />
By the late 1990s, child poverty in New Zealand had become an embarrassment and in 2002 the<br />
Labour government vowed to ‘eradicate it’ (Ministry of Social Development, 2002). Yet it was not<br />
until the 2004 budget that ‘Working for Families’ was announced, with a two-year phase-in for<br />
increased family assistance beginning in 2005. WFF included a range of improvements such as<br />
increased Accommodation Supplement and childcare subsidies. The major thrust, however, was a<br />
33 For example a two-adult and two-children household is not in the same ‘horizontal’ position as a two-adult household on<br />
the same gross income. The household with children does not enjoy the same standard of living and hence does not have<br />
the same ability to pay tax.<br />
52
very significant increase in financial assistance for children in ‘working’ families.<br />
CPAG provided a detailed analysis of this package in late 2004, welcoming the catch-up spending,<br />
but expressing alarm that many families in the poorest circumstances gained very little (St John &<br />
Craig, 2004). The package, managed by the Inland Revenue department (IRD) appeared to increase<br />
Family Support (later renamed the Family Tax Credit (FTC) significantly for all, but the Government<br />
had taken the opportunity to use this extra assistance to offset a range of cuts to benefits, so that<br />
many families were left simply ‘no worse off’.<br />
The new In-Work Tax Credit (IWTC) that replaced the CTC from 1 April 2006 was much more<br />
generous, at $60 a week for families with up to three children and an additional $15 a week for the<br />
fourth and subsequent children. However, like the CTC before it, families on benefits were denied the<br />
IWTC; and those not on benefits had to meet new work tests to qualify. The requirement of 20 hours<br />
of work for a sole parent and 30 hours for a couple appeared to be a hangover from past policy and<br />
had not been thought through for the realities of the modern, more casualised labour market. The<br />
requirement of 20 hours for a sole parent is quite excessive when compared to only 30 hours for a<br />
couple where there is an extra adult to provide care.<br />
Criticism of the WFF package in 2004 was not well-received politically. The argument that the<br />
poorest of poor children had been left out fell on deaf ears, and the Government claimed to have no<br />
money left to help beneficiaries further. Then in 2005, in a surprise show of pre-election generosity,<br />
an additional $500 million was found to raise the threshold for the joint parental income test from<br />
$27,500 to $35,000, and to reduce the rate of abatement from 30% to 20%. The effect of this was to<br />
push the IWTC well up the income scale as it is abated after the FTC.<br />
The justification was that the previously higher effective marginal tax rates on low and middle incomes<br />
countered the work incentive thrust of the Government’s intentions. Nevertheless, if work incentives<br />
were the objective, it was also unfortunate that the opportunity was not taken to revisit the design of<br />
the IWTC, or its on-going relevance. In other words, if increasing the threshold and reducing the rate<br />
of abatement were now going to provide a work incentive, why was a separate IWTC necessary?<br />
By the year ending June 2011, the total cost of WFF tax credits was $2.8 billion, made up of the<br />
FTC ($2.2 billion) and the IWTC ($592 million), with 2011 rates set out in Table 6.1. Adjustments for<br />
inflation for all parts, except the IWTC, occur when cumulative inflation exceeds 5%. However the<br />
2010 Budget froze the threshold at $36,827 and the 2011 Budget made further changes discussed<br />
below.<br />
Table 6.1: WFF weekly child payments from 1 April 2011 – children under 15*<br />
Weekly Support*<br />
Family Tax Credit, first child $88<br />
Family Tax Credit, each additional child $61<br />
In Work Tax Credit, one to three children<br />
Plus $15 for each additional child<br />
$60<br />
Threshold, joint income $36,827<br />
Rate of abatement 20%<br />
*Higher rates apply for older children. In 2011, the rates for a first child if 16 or over is $101, a subsequent child if 13-15<br />
is $69 and a subsequent child if 16 or over is $91. See www.ird.govt.nz<br />
53
In 2011, WFF abates from $36,827 at a rate of 20 cents for each extra dollar of family income. So,<br />
for example, a family with five children can still access some part of the IWTC up to an income of<br />
$145,042. 34 It is possible for a caregiver in a five-child, high income family to be receiving some<br />
IWTC up to $90 a week without any paid work requirement from the caregiver. The extent of the wide<br />
difference in the treatment of those who are entitled to only the FTC is shown in Figure 6.1<br />
Figure 6.1: WFF Tax credits- Average entitlement with and without the IWTC*<br />
Source: http://www.ird.govt.nz/aboutir/external-stats/social-policy/wfftc/social-policy-wfftc.html<br />
*Note: Other minor work related tax credits are included in total.<br />
2008 marked the end of New Zealand’s seven-year period of sustained economic ‘golden weather’,<br />
the beginning of the world financial crisis and a protracted recession. In the past, when parents on a<br />
low income needed to go onto a benefit, their Family Support could usually be expected to increase<br />
as a result of their lower income. Now, because the IWTC is tied to paid work, family assistance for<br />
low income families fails to provide this cushion. The caregiver loses $60 a week, or more for bigger<br />
families, just at the time when their children require more assistance, not less, to help escape the<br />
economic and social exclusion that undermines their future.<br />
The IWTC appears to be difficult to administer fairly, and the take-up and compliance for low-income<br />
families are complex. As jobs are lost in the on-going recession, children whose parents access a<br />
main benefit can experience a sharp drop in living standards. However, the IRD may continue to<br />
pay the IWTC, but only in some circumstances. For example, in the aftermath of the Christchurch<br />
earthquake the website says:<br />
To get either the IWTC or MFTC payment, couples must normally work at least 30 hours a<br />
week between them, and single parents must work at least 20 hours a week. If, because of an<br />
earthquake, you don’t work these hours, you may still receive the in-work tax credit. If you’re not<br />
sure if your circumstances qualify you as “normally” working the required hours, please contact<br />
us. 35<br />
If a family loses work for reasons other than an earthquake, they may feel that they too deserve to be<br />
regarded as ‘normally working the required hours’. In fact, enquiries into the circumstances in which<br />
the IWTC is paid after an earthquake reveals limited applicability requiring an on-going employment<br />
relationship with the firm and on-going payments from the firm. There must be no benefit being paid<br />
34 See IRD http://www.ird.govt.nz/wff-tax-credits/entitlement/.<br />
35 See http://www.ird.govt.nz/resources/a/a/aa069100442f22a4add9bf4e9c145ab7/ad70.pdf.<br />
54
from Work & Income. So, a few families affected by the earthquake will be protected while others,<br />
whose children have the same needs, will lose out. The remodelled welfare state increasingly serves<br />
to provide a minimal subsistence safety net which operates in an arbitrary way rather than a social<br />
security safeguard.<br />
Other WFF tax credits<br />
So far the focus has been on two major tax credits: the FTC and the IWTC. In addition, families<br />
may also be entitled to the Parental Tax Credit (PTC) and the Minimum Family Tax Credit (MFTC).<br />
The relationships are set out in Table 6.2. Both the PTC and the MFTC are highly work-focused and<br />
problematic as a result.<br />
Table 6.2. Working for Families Tax Credits (Source: IRD website)<br />
Tax Credit Abbreviation Nature of payment<br />
Family Tax Credit FTC <strong>Child</strong>-related weekly supplement<br />
In-Work Tax Credit<br />
Minimum Family Tax Credit<br />
Parental Tax Credit<br />
IWTC<br />
MFTC<br />
PTC<br />
<strong>Child</strong>-related weekly supplement with work<br />
requirement<br />
Minimum Family income top- up with 100 per cent<br />
abatement- with work requirement<br />
NZ$150 a week for 8 weeks for new child<br />
No receipt of benefit<br />
No paid parental leave<br />
The PTC is discussed more fully in Chapter 7. Depending on the work-related income, up to $150 a<br />
week is payable for up to eight weeks when a new baby is born. This is added to the FTC and abated<br />
against annual income. Like the IWTC, it is not adjusted for inflation. The order of abatement is FTC<br />
first, then the IWTC, and finally the PTC. Just as the IWTC leaves out the poorest children, those<br />
babies whose parents do not satisfy the off-benefit rule are not eligible for the PTC.<br />
The MFTC is not child-related but is paid only to families with children. It is designed to provide a<br />
guaranteed minimum family income for those working the required number of hours per week (20 for<br />
a sole parent and 30 for a couple). The level in 2011 is $22,204 net, regardless of the composition<br />
of the family, with FTC and the IWTC paid on top. The MFTC is reduced by one dollar for each<br />
additional dollar of disposable income earned. Thus it resembles a welfare benefit but with an even<br />
more severe abatement rate. Few families are receiving this payment.<br />
The house of tax credits is illustrated in Figure 6.3. The tax credits above the minimum family income<br />
line are the means by which additional children are recognised.<br />
Figure 6.3: House of tax credits<br />
Parental tax credit<br />
In-Work tax credit<br />
Family tax credit<br />
Minimum Family tax credit<br />
$22,204 net guaranteed<br />
income floor<br />
Earned income<br />
It is difficult for families receiving family assistance to understand the impact of earning more income<br />
because rather than an itemised report, they are given a total WFF tax credit amount on their tax<br />
55
econciliations, even though different credits are treated differently for abatement purposes. The<br />
severe abatement of the MFTC is of concern, as families may find at the end of year that they have<br />
to repay, dollar for dollar, any unanticipated income they have earned.<br />
Table 6.3 shows the effect of moving from the Domestic Purposes Benefit (DPB) and working 19<br />
hours per week at the minimum wage, to working 20 hours and getting the MFTC and the IWTC.<br />
The gain in disposable income from moving off the DPB is around $64 a week. However, there is<br />
no incentive for the sole parent to work any more than 20 hours a week until they can work around<br />
35 hours a week, because the MFTC abates at 100 cents for each additional dollar of net income,<br />
resulting in no increase in income for the additional hours worked.<br />
Table 6.3 Sole parent working 19 hours on DPB and 20 hours on MFTC<br />
DPB<br />
MFTC<br />
19 hours $ 247.00 20 hours $260.00<br />
tax $43.23 $27.30<br />
ACC* $4.99 $5.20<br />
net earnings per week $198.79 $227.50<br />
DPB net max $288.47 MFTC max $427.00<br />
net DPB after loss benefit<br />
($100-247)<br />
$225.10 Net MFTC $199.50<br />
IWTC $60.00<br />
FTC- 1 child $88.00 $88.00<br />
disposable income $511.89 $575.00<br />
Total government cost $313.10 $347.50<br />
less tax paid on earnings $43.23 $27.30<br />
Net government cost $269.88 $320.20<br />
*Different assumptions about ACC give slightly different results<br />
It is very important to understand that while the move from being employed for just below 20 hours<br />
a week and in receipt of a benefit, to being employed for 20 hours and not receiving a benefit,<br />
is technically a move off welfare to ‘independence’, in reality is no such thing. A large amount of<br />
assistance is provided by the state in each case, and in the Table 6.3 example, the government<br />
actually pays more when the sole parent is on the MFTC rather than the DPB. The main difference<br />
is that the name for the assistance from the government has changed.<br />
In both cases, the cost of the DPB and the MFTC respectively are offset by any <strong>Child</strong> Support paid by<br />
the liable parent. The total cost of the DPB in particular is given gross of these recovered payments<br />
and so overstates the expenditure by the state.<br />
The Welfare Working <strong>Group</strong> Report<br />
The Government-appointed Welfare Working <strong>Group</strong>’s (WWG) final report, Reducing Long Term<br />
Benefit Dependency, 2011, might have been expected to take a close look at the way the tax credits<br />
work and their role in relieving poverty by encouraging work. However, the WWG’s terms of reference<br />
explicitly excluded WFF and any consideration of the adequacy of the benefit system, despite the<br />
56
Government-appointed Tax Working <strong>Group</strong>’s report including a plea for a thorough investigation of<br />
the tax/welfare interface.<br />
The WWG’s final report uses the term ‘paid work’ 242 times while ‘unpaid work’ does not appear<br />
once. Caregiving of young children by their parents is invisible and unvalued. Parents are either paid<br />
workers or ‘jobseekers’, but not nurturers caring for the next generation of New Zealanders. For the<br />
WWG, the only way out of poverty is via paid work, and the only acknowledgement of the role of tax<br />
credits (as illustrated in Table 6.3) is a nod in the direction of expecting them to provide the necessary<br />
support.<br />
The WWG proposes a range of reforms to sort out 'feckless' sole parents. To illustrate how these<br />
would operate they create a composite case study of ‘Nikki ‘who has two children, aged three and six,<br />
works part-time at night, and has just separated from her partner (Welfare Working <strong>Group</strong>, 2010c,<br />
p. 59). Under the current rules, Nikki would receive the DPB and not be expected to work until the<br />
youngest child is aged 6. Under the WWG proposals she would become a ‘jobseeker’, and a benefit<br />
would be unnecessary because her ‘co-ordinator’ (a private sector case worker paid to move people<br />
off benefits) will arrange free childcare at the local kindergarten, an Accommodation Supplement,<br />
and help her claim WFF from the IRD, and claim <strong>Child</strong> Support from her ex-partner. As if by magic,<br />
Nikki “continues working and also looking after her children” (Welfare Working <strong>Group</strong>, 2010c, p. 59).<br />
This facile case study obscures the bothersome reality that Nikki actually faces, including dealing<br />
with the separation, interacting with the IRD, maintaining her expected output at her place of work,<br />
and finding affordable day-care that fits the limited daytime hours she is now able to work. When<br />
Nikki’s partner moves out, the family may continue to have the same financial arrangements for rent<br />
and other outgoings, and stay off a benefit as they attempt to work things out. Once notified of the<br />
separation, however, the IRD cuts off the IWTC, and bills Nikki for any overpayments because she<br />
is not working 20 hours per week.<br />
If Nikki, now a ‘jobseeker’ finds the required 20 hours of paid work during day-care hours, her income<br />
is topped up, as described above, with the MFTC. With the IWTC of $60 each week plus the FTC,<br />
she is better off than on a benefit because the government is giving her a huge wage subsidy through<br />
the tax system. However, she is intensely vulnerable to any loss of hours of work that may render her<br />
ineligible for both the IWTC and the MFTC.<br />
Under the current rules, if Nikki remained on a benefit, earning $100 a week would give her around<br />
$80.50 extra net income. 36 Under the WWG proposals, extra earnings would be abated much<br />
more harshly in order to teach her that she should really be in full-time work. The WWG (p.108)<br />
recommends that the threshold be lowered from $100 to $20 a week and an abatement of 55% of<br />
net benefit apply for any extra income over $20. From earning an extra $100 per week, after tax and<br />
abatement, she would gain less than $40. It must be remembered also that GST at the higher rate of<br />
15% is extracted when she spends this money.<br />
The WWG’s reasoning appears to be: working full time at the minimum wage gives people much<br />
more money than they would get on benefits. Therefore beneficiaries need to work full-time and<br />
be sharply penalised for working only part-time to reinforce the point. For sole parents with child<br />
rearing responsibilities who can only manage a few hours of work a week, this policy suggestion is<br />
particularly perverse.<br />
36 Tax at 17.5% and ACC at 2%.<br />
57
Oops we had a recession<br />
When the Labour-led Government developed WFF, it did not factor in the possibility of a deep<br />
recession in New Zealand, nor did it envisage events such as the global financial crisis or disasters<br />
like the Pike River mine explosion in 2010, and the Christchurch earthquakes in 2010 and 2011.<br />
In 2009 the National-led Government recognised that families were losing their jobs through no fault<br />
of their own and announced the ReStart Package. 37 This package had several parts but for families<br />
the key part was called ‘ReCover’. This allowed families that had been made redundant to retain the<br />
IWTC for 16 weeks.<br />
ReCover was a stopgap quick-fix creating two classes of unemployed: the deserving and the<br />
undeserving. A written question in parliament (Green Party, 4 March 2011) revealed that by January<br />
2011 when it was phased out, only 2,281 families had received a full ReCover payment. The Minister<br />
was unable to give numbers for those who did not go on a benefit but became ineligible for the IWTC<br />
because their hours of work were too low.<br />
As 2011 unfolds, rather than the promised economic bounce-back, it is clear that the Government’s<br />
tax shift (see Chapter 8) has been impotent to restart the economy. The economy has been severely<br />
crippled by the Christchurch earthquakes but no new Restart Package has been announced to<br />
support all affected families. As discussed above, while a few parents may have kept their entitlement<br />
to the IWTC because they fulfilled special limited earthquake criteria when they lost hours of work,<br />
other unfortunate families who needed to go on a benefit, or who lost an on-going relationship with<br />
the former employer also lost the IWTC. 38<br />
The OECD cautioned several years ago that the conditionality on work may magnify some income<br />
losses for those whose earning or working hours fall below entitlement to in work benefits. New<br />
Zealand has ignored this caution.<br />
Because severe economic downturns can have marked effects on the earnings distribution,<br />
policymakers should review whether the eligibility conditions and payment profiles of existing<br />
[in work benefits] are appropriate or should be adapted in order to exploit their potential as a<br />
measure that cushions income losses during a recession. (Immervoll & Pearson, 2009, p. 46)<br />
Even without the recession, the requirement of a fixed number of hours of work a week is inappropriate<br />
with ‘just in time’ and casual employment very common in a modern labour market.<br />
Evaluating Working for Families<br />
The objectives of WFF conflate two goals: poverty reduction and work incentives. As noted earlier,<br />
the dramatic rise in child poverty in the 1990s led to the Labour-led Government’s pledge in 2002<br />
to make eliminating it a top priority. This concern was clearly a factor in designing the IWTC, and is<br />
explicitly stated as a goal of the WFF package. Along with improved childcare subsidies, the IWTC<br />
was specifically designed to:<br />
… make work pay by supporting families with dependent children so work effort is rewarded;<br />
ensure income adequacy, with a focus on low and middle income families with dependent children<br />
to address issues of poverty, especially child poverty. (Centre for Social Research and Evaluation<br />
& Inland Revenue Te Tari Taake, 2007)<br />
37 See http://www.cbnz.org.nz/files/restart-factsheet180209.pdf.<br />
38 Those who were injured and on ACC may keep the IWTC. Anyone who was employed and has an accident after 1<br />
January 2006 is treated differently to others who lose their jobs or had their accident before this time.<br />
58
Thus the IWTC part of the WFF policy was supposed to get sole parents back to work and to reduce<br />
child poverty. The unacknowledged trade-off was that using one instrument to achieve two goals<br />
was going to compromise at least one of the objectives. To ‘make work pay’ using a tool that was<br />
designed to meet the costs of children and reduce their poverty inevitably meant that some children<br />
would be treated differently to others. In the absence of a commitment to reducing the poverty of<br />
all children, some would be ‘left behind’ (St John & Craig, 2004). Moreover as <strong>Left</strong> <strong>Behind</strong> (2008)<br />
noted, moving sole parents off benefits is not an adequate or accurate measure of whether life has<br />
improved for them or for their children.<br />
Design issues<br />
The basic theory was that work provides the route out of poverty but that work incentives were<br />
required and they would be effective. Thus a work incentive should ‘make work pay’, by creating<br />
an income gap between those in paid work and those not in paid work. The designers of the IWTC<br />
paid no attention to international advice that care would need to be taken in creating such a gap<br />
so that the latter group were not made worse-off as that would simply increase poverty (Pearson &<br />
Immervoll, 2008, p. 2).<br />
The IWTC is a most unusual ‘in work benefit’. It does not reward an extra hour of work, as would for<br />
example a lower tax rate, but provides a lump-sum to families who met the work-based criteria. The<br />
‘income effect’ of the IWTC unambiguously acts to reduce work effort, while the ‘substitution effect’<br />
towards more work is only operable if the qualification point of 20 hours a week for a sole parent and<br />
30 hours for a couple can be achieved. The incentive is to reach the required hours of work, if that is<br />
possible, but no more.<br />
There appeared to be no theory or international basis for applying an in-work benefit only for those<br />
with children. Few countries use a child-related work incentive (Human Rights Tribunal, 2008, p. 10).<br />
Almost no attention was paid to Australian policy where there has never been a child-related payment<br />
to encourage work, and where all low income children are treated the same (see Appendix 3).<br />
Moreover the IWTC is unusual in being paid to the caregiver not the worker. In the development of<br />
the policy, the officials recognised both that: ‘payments of family assistance to the principal carer is<br />
in the best interests of the child’; and that: ’payment of the [IWTC] cannot easily be untangled from<br />
the other elements of family assistance’. 39 Thus confirming that, despite its name, the IWTC is just a<br />
part of weekly family assistance to be used in the interests of the child.<br />
It is possible, and appears to have been the case in New Zealand, to be trapped by circular thinking<br />
as the following illustrates:<br />
[In Work Benefits] provide additional benefits to low-income families, so reduce the incidence<br />
of poverty among those families with children. They also increase the incentive to work, and as<br />
poverty rates among those in work are lower than those out of work, any increase in the number<br />
of parents moving into work would reduce child poverty. (Pearson et al, 2008, p. 13)<br />
Is work itself the way out of poverty? Or is it the way out of poverty because the state makes it pay<br />
with sufficient subsidies? Sometimes the justification is the belief that any attachment to the labour<br />
force creates future opportunities for well-paid work that will eventually provide an unsubsidised path<br />
out of poverty. Recent research in Canada has thrown into doubt the value of work incentives for<br />
achieving any such long-term benefit, but this evidence was not adduced in the IWTC development<br />
39 See cabinet paper Dec 2003, p. 24 (Ministry of Social Development, 2004a).<br />
59
(St John & Dale, 2010b). Nor was attention paid to the obvious: if work incentives are used as a major<br />
and direct method of addressing poverty, there is a risk of creating and perpetuating an underclass<br />
who cannot access the incentive and who thus must remain, by definition, in poverty.<br />
Prior to implementation, studies showed the expected impacts of WFF on employment could be<br />
expected to be minimal. Sole parents would have a small increase and second earners in dualincome<br />
households a small decrease [in hours of work] (Ministry of Social Development, 2004a,<br />
p. 29).<br />
Then, before the policy was implemented, the Government announced the increased threshold and<br />
lower abatement as described above. A priori, this was expected to provide a strong incentive to<br />
increase work effort to the new threshold. For those above the new threshold the effect was more<br />
ambiguous. By the time the complete WFF package was fully implemented in 2007 there was no<br />
clear connection between the original rationale for the IWTC and its final form.<br />
Official evaluation<br />
When WFF was introduced, the MSD and the IRD were given a very large budget to monitor and<br />
evaluate Working for Families (Dalgety, 2010a, 2010b; Dalgety, Dorsett, Johnston, & Spier, 2010). St<br />
John and Dale (2010a) concluded that the economic evaluation became an endpoint of the process,<br />
and there was little broader critical analysis that might suggest improvements, or even a fundamental<br />
rethinking of policy. The wrong questions were asked, and the researchers were too easily satisfied<br />
with their statistical analysis without asking if their results were meaningful. In essence the evaluators<br />
were happy to show, using a standard statistical technique, a marginal increase in the numbers of<br />
sole parents working that they attributed to the IWTC. 40 However the figures (Table 6.4) clearly show<br />
that by December 2010 the numbers on the DPB were back to their pre-WFF levels.<br />
If the sustained increase in employment due to the IWTC is in fact zero, then the cost of over $500<br />
million means that this in-work benefit has an infinite cost per extra job. If the purpose was also to<br />
’make work pay’ it is still difficult to justify. The IWTC is paid well up the income scale. A caregiver with<br />
several children on a family income of over $100,000 may still receive it, even though s/he does not<br />
do any paid work and where the primary earner does not need a payment to make work pay.<br />
Table 6.4. Numbers on the various benefits as at December, 2000-2010<br />
(Source: Work & Income website)<br />
End of quarter<br />
Unemployment<br />
Benefits<br />
Domestic<br />
Purposes<br />
Benefits<br />
Sickness<br />
Benefits<br />
Invalids<br />
Benefits<br />
Other<br />
main<br />
benefits<br />
All main<br />
benefits<br />
December 2000 146,692 109,663 33,560 56,711 45,681 392,307<br />
December 2002 118,139 109,290 39,426 65,779 34,825 367,459<br />
December 2004 65,969 109,339 45,648 72,543 26,200 319,699<br />
December 2006 38,796 100,309 48,650 76,816 22,070 286,641<br />
December 2007 22,748 98,154 49,093 80,082 19,655 269,732<br />
December 2008 30,508 100,282 50,896 83,501 20,989 286,176<br />
December 2010 67,084 112,865 59,988 85,105 27,665 352,707<br />
40 While the technique, using difference-in-differences analysis may have been standard, the choice of the comparator of<br />
unemployed people aged 15-65 years in this case is highly questionable (St John & Dale, 2010).<br />
60
Even between 2004 and 2007 when numbers on the DPB fell, there were numerous other factors<br />
at work. The labour market was exceptionally tight and unemployment itself was falling rapidly. The<br />
minimum wage was increased a total of 33% from NZ$9 per hour to NZ$12 between 2004 and 2008.<br />
In addition, the WFF tax credits threshold was higher and abatement lower than it had been, childcare<br />
subsidies and access improved markedly, and case management can be expected to have<br />
helped.<br />
Exits from benefits may not have entailed a significant increase in hours of work as the fall in numbers<br />
of DPB recipients was greatest among those people with an existing attachment to the labour market.<br />
As Table 5.3 illustrates, merely getting off the DPB and into 20 hours’ low-paid paid work may actually<br />
cost the government more and the argument that ’work is the way out of poverty’ is only true when<br />
tax credits are used to make work pay.<br />
It is also highly likely that some employment of those who are subsidised may be at the expense of<br />
those who are not. Displacement may also occur between partnered women and sole parents as<br />
the incentives for partnered women to work under WFF are, in fact, reduced. This appeared to have<br />
been borne out in the official evaluation:<br />
The difference-in-differences and longitudinal regression modelling results provide evidence<br />
that couples with children were less likely to both be in employment after WFF, by around two<br />
percentage points. (Dalgety, 2010a)<br />
Is it less important that partnered women work? Are their children’s needs different? Do they not<br />
face the same risk of losing touch with the labour market? As with other aspects of the evaluation<br />
the Ministry did not seem to understand that a ‘statistically significant’ result is not the end point of an<br />
evaluation that should be concerned with whether the social outcomes are worth the money spent<br />
(McCloskey & Ziliak, 2008).<br />
Was the child poverty goal achieved?<br />
In terms of meeting poverty objectives, by 2008, the WFF package had reduced child poverty on<br />
official measures (see Chapter 2). The fall in child poverty rates from 2004 to 2007 for children<br />
in ‘working’ households was large (39% to 12%). Thus WFF helped to significantly reduce the<br />
proportion of poor children who came from ‘working’ families. Nevertheless about one in three of all<br />
poor children still came from families where at least one adult was in full-time work. It is clear that<br />
without WFF, hardship rates would have been even higher, but they still remained above the EU-25<br />
median (Perry, 2010).<br />
For 2008 the MSD reported that one in five children (19%) was still in the lowest two categories of<br />
living standards:<br />
They are without a doubt …..experiencing serious hardship and unacceptably severe restrictions<br />
on their living conditions for citizens in a developed nation like New Zealand. (Perry, 2009b, p. 46)<br />
Importantly:<br />
…child poverty rates in workless households are consistently several times higher than<br />
those for children in working households (three to four times higher in 1992 to 2004, six to<br />
seven times higher in 2007 and 2009 after WFF). WFF had little if any impact on the poverty<br />
rates for children in workless households. (Perry, 2010, p. 109)<br />
61
The extent to which poor children, in benefit-dependent or ’workless’ families who by definition miss<br />
out on a substantial part of the WFF tax credits, experience poverty is illustrated in Figure 6.4.<br />
Figure 6.4. <strong>Poverty</strong> rates for children in ‘workless’ and ‘working’ households<br />
(AHC 60%, fixed line) (Source: Perry, 2010, p. 109)<br />
100<br />
80<br />
Income related<br />
rents introduced<br />
Proportion (%)<br />
60<br />
Benefit cuts<br />
40<br />
WFF raises incomes of those<br />
in work more than for those<br />
(remaining) on benefit<br />
20<br />
workless HH<br />
0<br />
1980 85<br />
HH with one or more adults FT<br />
90 95 00<br />
HES year<br />
05 2010<br />
The problem is not that the IWTC failed to reduce child poverty but that the reduction was selective.<br />
It applied only in those families who met the work criteria, and excluded those children who needed<br />
it most: the poorest children. Even the official evaluation concedes:<br />
The WFF changes met the “income adequacy” objective as low and middle income families<br />
received the bulk of the increased expenditure, and child poverty rates were reduced for lower<br />
income families with at least one adult in paid work. However there was no significant change in<br />
hardship rates for beneficiaries with children. (Dalgety, 2010b, p. ix)<br />
Human Rights Breaches by the IWTC Alleged<br />
The IWTC is a significant payment for children but is denied to the poorest children, in effect leaving<br />
them behind, in poverty. The IWTC is not insubstantial, for example it is worth 40% of total WFF<br />
tax credits for a family with one child (NZ$60 out of $NZ148 per week) and its net value is around<br />
20% of the sole parent benefit. One way of looking at the size of the problem is to see that since the<br />
introduction of the IWTC, families that have been denied this payment for their children have had a<br />
cumulative loss from their asset base of around $2.5 billion.<br />
Rebuilding the asset-base and reversing debt accumulation by poor families will now be a very<br />
challenging task requiring strong redistributive policies on many fronts. However, removing the<br />
discrimination by adding the IWTC to the FTC would provide a targeted payment to families below<br />
the median income and would have an immediate and significantly positive effect on the measured<br />
child poverty rate.<br />
In a challenge to the Government, a class action: CPAG v Attorney General, was heard in the Human<br />
Rights Review Tribunal in mid-2008. CPAG claimed the IWTC constitutes unlawful discrimination<br />
under Part 1A of the Human Rights Act 1993 and breaches New Zealand’s obligations under the<br />
United Nations Convention on the Rights of the <strong>Child</strong>. The history, documents and decisions of<br />
this protracted legal challenge can be accessed at www.cpag.org.nz and a summary is provided in<br />
Appendix 1.<br />
62
CPAG’s argument was that the IWTC is part of weekly family assistance to help meet the needs<br />
of low income children but access is determined by the parents’ employment status and hence the<br />
payment is discriminatory. The outcome is to reduce the poverty of those children whose parents are<br />
in work while leaving the children of those who do not qualify further behind. Māori and Pacific Island<br />
children are disproportionally affected.<br />
A profound issue that human rights ought not be conditional on paid work is illustrated by the CPAG<br />
case, as discussed by Amanda Reilly (Bedggood & Gledhill, 2011):<br />
…. it is suggested that caution should be exercised when characterising the right to work as the<br />
fundamental underpinning of other rights. Unless it is possible to guarantee paid work to every<br />
single person regardless of the state of the economy, and individual’s state of health or their care<br />
responsibilities, tying the enjoyment of other rights too closely to the right to work can lead to<br />
injustice. It should also be noted that Article 11 of the International Covenant on Economic, Social<br />
and Cultural Rights separately guarantees a right to an adequate standard of living which is not<br />
contingent on paid work. The decision of the Tribunal in the <strong>Child</strong> <strong>Poverty</strong> <strong>Action</strong> <strong>Group</strong> case that<br />
the discrimination and disadvantage suffered by the children of beneficiaries by the In-Work Tax<br />
Credit is justified because of the work incentive it provides to the parents of such children seems<br />
at odds with the Covenant read as a whole. (Reilly, 2011)<br />
In a 100-page judgment, the Tribunal upheld the claim of discrimination against 230,000 of the<br />
poorest children in New Zealand (22% of all children under 18) who do not benefit from the IWTC:<br />
We are satisfied that the WFF package as a whole, and the eligibility rules for the IWTC in<br />
particular, treats families in receipt of an income-tested benefit less favourably than it does<br />
families in work, and that as a result families that were and are dependent on the receipt of an<br />
income-tested benefit were and are disadvantaged in a real and substantive way. (Human Rights<br />
Tribunal 2008: para 192)<br />
While the decision that discrimination has been proven is significant and of international interest,<br />
the declaration CPAG was seeking: that the IWTC was illegal under the Act, was not achieved. The<br />
decision has been appealed and is to be heard in the High Court in September 2011.<br />
2011 Budget changes<br />
As noted, in the lead-up to the 2011 Budget, WFF was repeatedly painted in the media as too<br />
generous, and a suitable target for axing in order to reduce the Government’s budget deficit. In the<br />
budget the Minister of Finance announced that the WFF threshold is to be reduced from $36,827<br />
in 2011 to $35,000 by 2018, and the rate of abatement of the WFF payments is to rise from 20% to<br />
25% over the same period.<br />
The various business comments on the changes were approving if disappointed that they were<br />
not more dramatic. The changes were claimed by the media to created ‘winners and losers’. For<br />
example, Simon Collins wrote in the NZ Herald that a low income, four-child family was to gain<br />
around $14 by 2012 while a top income family lost only around $8. This analysis was quite simplistic<br />
but added to the reassurance from the government that the sacrifice required was minimal and<br />
manageable. A family on a high income with multiple children was even found to proclaim that ‘Cut<br />
in tax credits good move’ (NZ Herald, 20th May).<br />
63
Unfortunately, in reality, these changes signal a harsh direction, especially as the government has<br />
promised that there will be no further changes (presuming continuous election until 2018). In justifying<br />
the changes the Minister of Finance claimed:<br />
The cost of Working for Families has roughly doubled from about $1.5 billion in 2005/06 to about<br />
$2.8 billion this year. That kind of growth is no longer sustainable and without changes the scheme<br />
would quite quickly become unaffordable. (Bill English, Beehive news release, 19th May)<br />
However the data from the budget (Figure 6.5) tell a different story. The strong growth shown to 2008<br />
was a result of WFF being phased in from 2005. WFF was in large part a catch up programme as<br />
family assistance had fallen far behind in real terms, and far behind comparable countries such as<br />
Australia.<br />
Far from showing Figure 6.5. Working for Families expenditure (Source: Budget 2011)<br />
rapid growth, nominal<br />
expenditure on WFF<br />
slowed markedly between<br />
2009 and 2010, was<br />
static between 2010 and<br />
2011, and for the financial<br />
year 2012 growth was<br />
projected to be zero. This<br />
is surprising as one might<br />
have expected a growth in<br />
nominal expenditure given the GST inflation adjustments to WFF in 2010 and lower family incomes in<br />
the recession. The lack of expenditure growth may reflect in part that the threshold was frozen in 2010<br />
and the IWTC is not indexed. However, it is likely also to reflect that as WFF is currently designed, the<br />
Government actually saves money when low-income families lose work as entitlement to the IWTC<br />
is lost at the same time. A properly designed family assistance programme would provide a cushion<br />
in a recession and protect children.<br />
Table 6.5 sets out the actual impact of the budget policy direction and contrasts it with that in<br />
Australia. The figures are illustrative only, using the example of a one-child family sitting at the current<br />
threshold. The 2011 New Zealand Budget projected a cumulative 5% inflation adjustment in 2012,<br />
2014, 2016, and 2018. Although the Australians adjust annually, the same method has been used for<br />
both Australia’s and New Zealand’s calculations. By 2018, wages will have risen with inflation and<br />
growth, but it is assumed conservatively that gross wages grow only as fast as inflation.<br />
The results indicate that by 2018 this illustrative family is getting only $120 a week (including the<br />
IWTC) as compared to $180 with full indexation. The 2018 threshold of $35,000 in New Zealand is<br />
the equivalent of $29,000 in 2011 dollars which is only slightly over the minimum wage.<br />
A family in Australia who gets the maximum of their tax credits today by 2018 gets A$206 per week as<br />
the full entitlement. The 2011 New Zealand threshold is already only 81% of the Australian threshold<br />
or 61% if compared in New Zealand dollars. By the time we get to 2018 the New Zealand unadjusted<br />
threshold is 64% of the Australian one.<br />
The contrast is even more stark if one of the children is a newborn. For that first year of the child’s<br />
life, by 2018 a New Zealand family who today sits at the current threshold gets $143 per week with<br />
64
abatement from NZ$35,000. An Australian family gets $311 per week with abatement of only part of<br />
it from A$55,000.<br />
Table 6.5 Comparing New Zealand and Australia: 1 child under 15 family at current threshold<br />
Year ended March 2,011 2012 2014 2016 2018<br />
New Zealand (NZ$)<br />
Threshold if indexed $36,827 $38,668 $40,602 $42,632 $44,763<br />
Threshold as per 2011 Budget $36,827 $36,350 $35,900 $35,450 $35,000<br />
Abatement 20% 21.25% 22.5% 23.75% 25%<br />
Effect of inflation on wages $36,827 $38,668 $40,602 $42,632 $44,763<br />
1 child
Work & Income wants to know about every single extra dollar that comes the way of the sole parent,<br />
including any helpful payments from the other parent or from the extended family. The IRD and Work<br />
& Income definitions of what constitutes a relationship are inconsistent, with Work & Income keen<br />
to say there is a relationship if there is evidence of financial support. Work & Income peers into the<br />
bedrooms of the poor to see if the sole-parent is co-habiting and therefore not entitled to a benefit; on<br />
the other hand, the IRD, even less qualified in social matters, peers into the bedrooms of the poor to<br />
see if she is not co-habiting so that she can be denied the IWTC for her children. Families can receive<br />
a terrifying torrent of letters from different parts of the IRD and Work & Income and become totally<br />
confused and very anxious, especially when overpayments of WFF are alleged along with demand<br />
for interest payments on debts accrued.<br />
The IWTC can be paid to a mother while she is in a relationship even if she is not in paid work, providing<br />
her partner works 30 or more hours. However, any overpayment becomes her debt even when it is<br />
an increase in his income that has caused it. If they split up, and even if they remain independent<br />
from the benefit system and he continues as before to support her in a full-time care-giving role, she<br />
loses entitlement to the IWTC and is thus liable for repaying any so-defined ‘overpayment’. The workbased<br />
logic appears to be that because she is living on her own she should now be expected to work<br />
20 hours a week outside the home. There is no regard for the needs of the young child, nor for her<br />
primary duty of care. The interests of the child have completely vanished from the policy.<br />
It is possible for a sole parent to receive demands for reassessed WFF tax credits for previous tax<br />
years. While the IRD will write off such assessments in cases where she has no money, this is a<br />
very scary time for her. <strong>Further</strong>more, under the newly adopted definitions of ’family scheme income’ 42<br />
payments from grandparents trying to assist their struggling children and grandchildren may also be<br />
treated as family income for abatement.<br />
Shared care has emerged as another issue. If a couple is separated, the WFF is apportioned provided<br />
the other parent provides care 5/14th of the time in each fortnight. This might be every second<br />
weekend and some overnight stays. It is therefore possible for a sole parent to get a reduced WFF<br />
of only $56.37 even though s/he has the child all of the days of the entire working week and cannot<br />
work, while the other parent gets $91 because the IWTC is not apportioned for shared care and only<br />
those in work are entitled. If the couple are not separated, the at-home parent would be paid all of the<br />
WFF money. There is no justice in the in-work parent getting the bulk of the child payments based on<br />
spurious definitions of entitlement.<br />
As the Human Rights Tribunal decision clearly states, the IWTC is a payment for children.<br />
The Crown’s argument that the challenged tax credits cannot be described as ‘child-related’ has<br />
no basis whatsoever in the evidence we heard. (Human Rights Tribunal, 2008, p. 63)<br />
It is also noted that the criteria for shared care are different for WFF and <strong>Child</strong> Support (see Chapter<br />
8). This causes an enormous amount of confusion. If the tax credits were associated solely with the<br />
child rather than work status of the parents, they could be left un-apportioned, with only <strong>Child</strong> Support<br />
adjusted and then, only if genuine shared care of a significant nature was in place.<br />
42 Legislation designed to reduce the ability of higher-income families to reorder their affairs and use vehicles such as trusts<br />
and PIEs to limit their income and maximise their WFF.<br />
66
Conclusions and key recommendations<br />
Almost all developed countries offer generous tax relief related to family size, and often a universal<br />
child benefit is also provided (see Appendix 1 for a discussion of universal child benefits). New<br />
Zealand has a flimsy ‘house of tax credits’, with far too much child-related assistance conditional<br />
on meeting a fixed ‘hours of work’ requirement that is no longer appropriate in the modern labour<br />
market. In fact, the reality for many families is ‘just in time’ employment with uncertain hours, low<br />
wages, short-term contracts and long hours spent travelling to and from child-care and multiple<br />
workplaces. If children are sick, uncertain employment arrangements add to the stress faced by<br />
many parents. Families with uncertain incomes also face the possibility of an end of year tax liability<br />
if they take the complicated WFF tax credits.<br />
If we could start with a clean slate it might be possible to design the ideal system. Unfortunately,<br />
policy-makers must take existing policy and start with that. To begin to deal effectively with child<br />
poverty, the first requirement must be to remove the insidious discrimination in the IWTC. While the<br />
IWTC has never been indexed, it is still a very significant element of WFF. If $60 were added to the<br />
Family Tax Credit (formerly Family Support) for the first child, and the IWTC was abandoned, those<br />
currently excluded from the IWTC would receive a significant boost to their incomes. If approximately<br />
150,000 low-income families are currently not in receipt of the IWTC, the annual cost would be about<br />
$450 million. This would be highly targeted redistribution, as only the poorest families would gain.<br />
The Parental Tax Credit must likewise be unhinged from its work-based criterion and focused on the<br />
needs of all new-borns in low income families.<br />
Once this discrimination is removed, consideration should be given to bringing New Zealand back<br />
to a more balanced approach by universalising part of the FTC. That way, less income is subject to<br />
abatement. Also, all parts of WFF must be properly indexed, although there is a case for a smaller<br />
rise in the threshold.<br />
The pretence of being independent from the state by the use of the MFTC should be abandoned along<br />
with its draconian abatement rate and hours worked requirement. The formula for the abatement of<br />
benefits when there is additional income needs should be improved. The threshold needs to be<br />
raised substantially to reflect inflation and the rate of abatement reduced. This way, families with<br />
children, especially sole parents, can supplement their incomes seamlessly without working the long<br />
hours stipulated by current policy. Such an approach would be more in keeping with the realities of<br />
the labour market, and would provide greater security of income as well as giving parents greater<br />
flexibility to prioritise their children’s needs. This does not preclude mentoring parents back into the<br />
full-time paid work or study, once the needs of their children have been met. It does however require<br />
greater community commitment to helping parents with young children through the first years of their<br />
children’s lives.<br />
Recommendations<br />
• Remove all ‘hours worked’ requirements from child-based family assistance;<br />
• Reverse the decline in Working for Families as set out in the 2011 budget for the years 2012-2018;<br />
• Simplify to make Working for Families more understandable;<br />
• Abolish the In Work Tax Credit and add $60 per week to the first-child Family Tax credit;<br />
67
• Fully adjust the Family Tax credit for inflation every year. Leave the rate of abatement at 20%;<br />
• Administer all payments of the Family Tax credit through the IRD and pay the full amount to one<br />
caregiver. No shared care apportionment;<br />
• Abolish the Minimum Family Tax Credit and allow more flexibility for those on part benefits;<br />
• Raise the first $100 market income threshold for abatement of the Domestic Purposes Benefit to<br />
$180 per week and the second $200 threshold to $250. Extend the 30 cents in the dollar abatement<br />
of net benefit, effective between $180 and $250, to all beneficiaries with young children;<br />
• Eventually universalise $20 of the Family Tax Credit for each child under 5 as part of a return a<br />
commitment to the principle of inclusion; but only if accompanied by an increase in the progressivity<br />
of the tax scale and not at the expense of meeting poverty reduction among the poorest.<br />
68
Appendix 1. CPAG V Attorney General: Background to the case 2002-2011 43<br />
Since the Labour Government first introduced discrimination against the children of beneficiaries into<br />
its family assistance policies in 1996, CPAG has been concerned with the impact of these policies on<br />
child poverty. While CPAG complained to the Human Rights Commission in 1996, the Government<br />
was not at that time subject to the Human Rights Act 1993 (HRA). However, on 31 December 2001,<br />
an amendment to the HRA came into effect which made the Government, its agencies and anyone<br />
who performs a public function, accountable for any unlawful discrimination under the HRA (Part 1A).<br />
In 2002, CPAG formally challenged the Government under Part 1a of the Human Rights Act 1993.<br />
CPAG argued that children, denied part of their family assistance based on the work status of<br />
their parents, were denied the support they needed to keep them out of poverty. At that time the<br />
discriminatory policy in question was called the <strong>Child</strong> Tax Credit.<br />
In 2004 in recognition of the growing problem of child poverty in New Zealand and concerns about<br />
benefit dependency the then Government announced a package of social assistance for families<br />
called ‘Working for Families’ (WFF) as described in Chapter 6. The policy reforms had two relevant<br />
primary purposes: child poverty alleviation and providing a work incentive. One aspect of the WFF<br />
package was the In-Work Tax Credit (IWTC), a payment for families of $60 per week that replaced<br />
the <strong>Child</strong> Tax Credit. The IWTC was designed to both alleviate child poverty and provide a work<br />
incentive. The Government enacted legislation making eligibility for this payment dependent on<br />
being ‘off-benefit’ and working a required numbers of hours: 20 hours a week for a sole parent and<br />
30 hours a week for a couple. Before it came into force, the Government amended the legislation<br />
to make the IWTC payable to families higher up the income scale (by increasing the abatement<br />
threshold and lowering the abatement rate). From 2006, the case was about the IWTC as that had<br />
replaced the <strong>Child</strong> Tax Credit.<br />
There was a series of arguments from the Crown both about the substantive issues and arguments<br />
of a legal nature, including an argument that CPAG could not take a case under the HRA because<br />
CPAG was not itself directly affected. The Office of Human Rights Proceedings (OHPR) acted on<br />
behalf of CPAG and provided the legal advice. In 2005 the Tribunal ruled that CPAG did have a<br />
right to take the case. The decision is an important human rights law precedent because it affirms<br />
the right of non-government organisations to challenge policy on human rights grounds, without the<br />
organisations themselves having to be affected by any discrimination. The Crown appealed this<br />
decision, but the High Court Judge ruled that the decision did not lie within his jurisdiction and the<br />
Tribunal’s decision was, therefore, in order.<br />
The case was heard in mid-2008 by the Human Rights Review Tribunal in Wellington. The record<br />
of the Tribunal proceedings in 2008 amounts to nearly 10,000 pages. This includes 21 statements of<br />
evidence (totalling over 300 pages), which refer to more than 250 documents (totalling nearly 8,000<br />
pages) and a transcript of over 1,000 pages, which was produced contemporaneously at the hearing.<br />
The Tribunal found that the IWTC is discriminatory because it is available to working families but not<br />
beneficiary families and this disadvantages children in beneficiary families. The test of discrimination<br />
includes proving that harm is caused and the Tribunal was satisfied it was. However, the Tribunal<br />
also found that the discrimination was justified in a ‘free and democratic society’. Therefore, the<br />
Tribunal refused to issue a Declaration of Inconsistency.<br />
43 Full details of the steps along the legal process and associated legal documents are available at www.cpag.org.nz.<br />
69
Following the Tribunal’s decision, CPAG filed an appeal in the High Court. As the appeal was<br />
inadvertently filed several days late, CPAG needed to seek leave to appeal out of time. In 2009, the<br />
Court granted this application and the appeal was set down for hearing in 2010. However, in mid-<br />
2010, the Crown sought to recall the Court’s decision allowing the appeal to proceed (on the basis<br />
of a later Court of Appeal decision). The hearing date had to be abandoned while this issue was<br />
considered by the Court. In late 2010, the Court rejected the Crown’s recall application, which meant<br />
that the appeal could proceed.<br />
CPAG is appealing the Tribunal’s finding on justification and the Crown has appealed the Tribunal’s<br />
finding that the IWTC is discriminatory. The appeal is set down for a hearing in the High Court<br />
commencing 5th September 2011. CPAG argues that the legislative measure is inconsistent with<br />
the right to be free from employment status discrimination, guaranteed in the New Zealand Bill of<br />
Rights Act 1990. Even when due deference is given to the executive and legislative branch of the<br />
Government of New Zealand for its capacity and competence to determine legislation in the area of<br />
social and economic policy, this discrimination is still not able to be demonstrably justified, in a free<br />
and democratic society.<br />
CPAG wishes to thank the Human Rights Proceedings Office, and the lawyers Frances Joychild,<br />
Jenny Ryan and Cathy Rogers for their exemplary work on this important case.<br />
70
Appendix 2. Is a universal child benefit the answer?<br />
It is tempting to answer that a universal child benefit should be considered for New Zealand.<br />
Historically, New Zealand’s universal child benefit supported egalitarianism and strengthened social<br />
inclusion. The unfortunate fact, though, is that starting from where our tax and welfare systems are in<br />
2011, a universal child benefit could not provide an immediate solution to child poverty.<br />
While many on both sides of the political spectrum understand and appreciate the merits of a universal<br />
child benefit, there is a lot of confusion about the nature and purpose of family financial assistance.<br />
It is important therefore that we understand the history of New Zealand’s original universal Family<br />
Benefit and assess the calls to return to a universal <strong>Child</strong> Benefit in the context of how society and<br />
the economy has changed since the post-war period when the Family Benefit was actually worth<br />
something and meant something.<br />
Tax exemptions for children were introduced in 1914 but were of benefit to only a few higher income<br />
families. Means-tested family allowances were introduced in 1926 under the Family Allowances Act:<br />
The distinctive features of the New Zealand scheme lie in its being financed wholly at the expense<br />
of the general taxpayer and in providing for all families below a stated income-level, regardless of<br />
the employment or otherwise of the parents. (R. M. Campbell, 1927, p. 369)<br />
It was not until 1946, after the end of World War II, that family allowances were extended to all<br />
children on the same basis. The Family Benefit was a per child cash payment that went to the<br />
mother. A tax exemption could still be claimed by the principal income earner in the family for the<br />
children (McClure, 1998).<br />
Unfortunately, those on the highest tax rate with the most money got the most advantage from having<br />
a tax exemption. If your extra income is taxed at 60% an exemption of $100 saves you $60, but if you<br />
earn less and are taxed at 10%, you only save $10. This inequity was recognised in 1979, when the<br />
exemption, worth on average about $3 per child per week, was added to the Family Benefit of $3 per<br />
child per week. From 1979, New Zealand’s universal <strong>Child</strong> Benefit was a flat, $6 per child per week.<br />
In 1979, $6 per child per week 44 was a meaningful amount of money. When abolition of the Family<br />
Benefit was announced in 1990, it had lost considerable value because it was never adjusted for<br />
inflation. Perhaps because it had been reduced to only a token payment it was an easy target for<br />
those who wanted to get rid of it.<br />
People who remember when the Family Benefit was in place as a universal family payment are right<br />
to see its advantages. They remember it was very simple and accessible, with a very high take-up<br />
rate; and it was paid to the mother exclusively so there was never any argument about whether or<br />
not it should be divided in shared care arrangements. It was for the mother to use for the benefit of<br />
the child, but often it featured as the only income that she controlled in her own right, so it was very<br />
popular amongst women. Another fondly remembered feature was that the Family Benefit could<br />
be capitalised for the purchase of the first home, and it enabled many low income families in New<br />
Zealand to become proud home-owners.<br />
By 1990 we were making two kinds of payments to families. One was a targeted per child per week<br />
tax-credit called Family Support, which started to reduce at quite a low level of total family income.<br />
The other payment was the universal $6 per week Family Benefit. It appeared that extra money we<br />
44 $33 a week in 2011 terms according to the Reserve Bank’s inflation calculator.<br />
71
could save by not paying the $6 at the top end could be used to improve what we were doing at the<br />
bottom end. Unfortunately, when the National Government abolished the Family Benefit in 1991, it<br />
did so by simply adding it to Family Support so that the whole of family assistance became a targeted<br />
payment that did not give one extra dollar to those at the bottom. All it did was to save the state<br />
money, the extra saved was not re-distributed to the poorest families.<br />
The silence over the demise of the universal Family Benefit was very hard to understand. One<br />
would have thought that women’s groups would have been vocal in supporting the retention of that<br />
benefit, properly adjusted for inflation. The first lesson to be learned was that arguing that an existing<br />
universal payment ought to be continued and expanded is far easier than arguing for it to be reinstated<br />
once it is gone. The second is that more targeting of existing payments does not mean the<br />
poor will be better off.<br />
The New Zealand welfare system changed from a balanced mix of targeted and universal income<br />
support to a highly targeted system following the radical policy upheavals of the early 1990s.<br />
By eliminating payments that could be claimed by the better-off, many people believed that<br />
redistribution to the poor would become more generous and effective. Such an expectation was<br />
held by at least some social liberals in the 1980s. In the 1990s, it became clear that the targeting<br />
process marginalises welfare recipients while facilitating wage and tax cuts. The reason for the<br />
observed result of diminished rather than enhanced social provision for the poorest is clear. The<br />
more that social assistance is means‐tested, the longer the income range over which benefit<br />
abatement (ie clawbacks) must occur, and/or the higher the rate of abatement must be. To limit<br />
this undesirable impact of targeting, benefits must be kept as low as possible. Hence the position<br />
of the poor worsens over time. (St John & Rankin, 2009)<br />
During the 1990s the Government’s method of expansion of Family Support was of concern to CPAG.<br />
For example, in 1996, the introduction of the so-called <strong>Child</strong> Tax Credit was the beginning of the<br />
discrimination against families in receipt of welfare assistance within the Family Tax Credit System.<br />
In 2001, CPAG argued that the <strong>Child</strong> Tax Credit, then a $15 per week payment for those not on<br />
a benefit, should be replaced with a universal family benefit set at $15 per week per child. <strong>Child</strong><br />
<strong>Poverty</strong> <strong>Action</strong> <strong>Group</strong> estimated that this would cost $510 million per year, and children from low<br />
income families would receive an extra $250 million. The problem now is that we are in a completely<br />
different world to that of the first half of the twentieth century. If we were to make the In Work Tax<br />
Credit universal now, it would be prohibitively expensive with unjustified gains at the top end for<br />
families who have already had their incomes enhanced by generous tax cuts.<br />
During the first decade of the new millennium, the over-all income inequality in society has become<br />
much more pronounced (see Chapter 3). There is a huge divide between the poorest families and the<br />
wealthiest families who are living lives of extravagance that could hardly be dreamed of in the post<br />
war egalitarian period. Today, in 2011, there is severe child poverty amongst 20% of New Zealand’s<br />
children, many of whom are children of parents that are denied the In Work Tax Credit.<br />
What, then, can we do? Should we pay every child, say, $50 per week to help solve this problem?<br />
If we did that as an addition to Working For Families, it would be extraordinarily expensive: $50 is<br />
about $2,500 per year, and we have 1 million children so that is roughly $2.5 billion annually to give<br />
every child in New Zealand an extra $50 a week on top of Working For Families. That much money<br />
is simply not available in the 2011 or in foreseeable future budgets. Although on the surface it might<br />
72
appear to address child poverty, it is unrealistic, especially given the low tax rates that now apply to<br />
the top incomes.<br />
Another option would be to do away with Working for Families and re-distribute those funds as a<br />
universal payment. Unfortunately, doing the calculations shows that Working for Families costs $2.8<br />
billion annually, and divided among 1 million children is just over $50 per week per child. Currently,<br />
the poorest working family in New Zealand gets $148 a week for the first child, and another $61 for<br />
the second child under 15 and more for older children. Clearly, a universal payment would deliver far<br />
less than Working for Families for those low income working families. Even for those not getting the<br />
IWTC, such a payment would make them worse off than they are currently.<br />
While universal provision is desirable, it is not sensible or fair to argue for that until we are adequately<br />
providing tax credits at the lowest end of the income distribution. Extending the In Work Tax Credit<br />
(cost $450 million) as suggested in this chapter, is a much more cost effective policy. If we argue for<br />
a universal component now, we are arguing to pay child benefits to the wealthy who have become<br />
considerably more wealthy than they were a decade ago, while those who were poor have become<br />
comparatively and often actually, poorer.<br />
In summary<br />
There are very good arguments for a universal payment, but in 2011 we have very wide income<br />
disparities and we do not have progressive taxation to fund redistribution. In addition, the poorest<br />
children miss out on payments in the current system because payments are tied to their parents’ paid<br />
work activity, not solely to income.<br />
A universal payment alone is incapable of addressing child poverty with the current restrictions: fiscally<br />
it would mean that in order to make a payment to children that alleviated poverty, the payment level<br />
would have to be so high that we could not do it without either raising the top tax rates considerably to<br />
pay for it, or sacrificing some other worthy spending. Eliminating poverty has to be the first priority and<br />
this requires targeting assistance to the lowest income families. It would be possible (and desirable)<br />
to have a universal dimension, comparatively small initially, but the most significant assistance in the<br />
immediate future will need to be targeted at the poorest children. This could be the first step towards<br />
a universal payment for all children.<br />
73
Appendix 3. Lessons from Australia<br />
New Zealand has long been described as a ‘laggard’ in family assistance compared to other OECD<br />
countries (Bradshaw, Finch, & Eardley, 2003). Despite Working for Families, New Zealand now<br />
falls well behind Australia both in the generosity and in the design of family assistance. In addition<br />
there are many niggardly and unsatisfactory aspects to WFF as outlined in this chapter. Profoundly<br />
different to New Zealand, in Australia child-related weekly payments are the same for all children,<br />
regardless of the source of their parents’ low income, just as they were in New Zealand before 1996.<br />
There are a number of features of the Australian system that make it far simpler, far more generous<br />
and humane than New Zealand’s. One critical feature is that most aspects are adjusted annually for<br />
inflation. But that is just the start.<br />
Families are entitled to a range of benefits and tax credits, a major one is the Family Tax Benefit A<br />
(see Table 6.6). The maximum amount of Australian Family Tax Benefit A does not begin to reduce<br />
until parents have an income of A$45,211 and the reduction is only 20 cents for every dollar of<br />
income received over the threshold until a base weekly amount of around $40 a week per child is left.<br />
Above $94,316 (plus an additional $3,796 for each child after the first) the abatement recommences<br />
at a rate of 30%. The income thresholds are annually adjusted for inflation.<br />
Table 6.6. The maximum amount of Family Tax Benefit A (Australia)<br />
Rates for 2011 (Source: Family Assistance Office (Australia)<br />
For each child<br />
Aged under 13<br />
Aged 13-15<br />
Aged 16-17*<br />
Aged 18-24*<br />
Per week*<br />
A$94.32<br />
A$118.48<br />
A$39.65<br />
A$48.42<br />
Note: payment includes the Family Tax Benefit Part A supplement (A$726.35 per child for the 2010–11 financial year). The<br />
supplement can only be paid after the end of the financial year. The Australian dollar figures have not been converted<br />
to $NZ dollars, in 2011 the rate is around NZ$1 = A$0.75.<br />
*The budget 2011 increased the payment for older teenagers to the 13-15 rate.<br />
In addition, as shown in Table 6.7 Family Tax Benefit B is paid on a per family basis to families<br />
where the principal earner’s income is less than A$150,000 pa.<br />
For two–parent families it is the income of the lower earner that affects how much Family Tax Benefit<br />
B the family will receive. The lower earner can have income up to A$4,745 per annum and still<br />
receive the maximum rate of Family Tax Benefit Part B. Payments are reduced by 20 cents for each<br />
dollar of income earned over A$4,745. Single parents automatically receive the maximum amount of<br />
Family Tax Benefit Part B if they have an income of A$150,000 or less per annum.<br />
Table 6.7. The maximum amount of Family Tax Benefit B (Australia)<br />
Rates for 2011 (Source: Family Assistance Office (Australia)<br />
For each family where the<br />
youngest is aged<br />
under 5<br />
Aged 5-15<br />
Per week*<br />
A$75.18<br />
A$54.47<br />
Note: the principal earner’s income must be under A$150,000<br />
74
If the child is a new baby and the family do not qualify for paid parental leave there is a further<br />
A$5,294 Baby Bonus payable equivalent to A$102 a week for the year. The cut out income for the<br />
baby bonus is a family income of A$150,000.<br />
All up, the maximum annual assistance for a family with one-child under 13, including families on<br />
benefits, is either A$14,105 if there is a baby bonus paid, or A$8,815 if the child is aged 1-4 and<br />
A$7,738 if the child is aged 5-13. If the child is aged 13-15 the maximum rate is A$8,993.<br />
The figures for large families and older children are not produced here but also show how much<br />
more generous the Australian system is. The only changes made in the Australian 2011 budget were<br />
to freeze the annual supplements in the tax credits paid and to freeze the top cut-out threshold of<br />
A$150,000 where applicable and bring older children into alignment with younger teenagers. The<br />
Family Tax Benefit Part A for older teenagers is to increase by up to A$80 a week, on top of the A$460<br />
million extension of the Education Tax Refund to cover school uniforms.<br />
In addition to the major family tax credits, paid parental leave and the baby bonus, there is a maternity<br />
immunisation allowance of A$251 paid without an income test, a healthcare card for those on incomes<br />
under A$45,114, and a range of rent assistance, childcare rebates and benefits, all fully indexed.<br />
It is also noteworthy that, to prevent overpayments, part of the Family Tax credits is paid as a bonus<br />
at the end of the year.<br />
75
Chapter 7. Paid Parental Leave in New Zealand:<br />
catching up with Australia?<br />
Susan St. John, 45 Andrew Familton 46 and M.Claire Dale 47<br />
Introduction<br />
Australia and New Zealand have both been at the lower end of international comparisons<br />
of Paid Parental Leave (PPL) provisions, falling well short of international best practice<br />
in terms of time offered, generosity of payment and gender equity provisions (NZ Department of<br />
Labour, 2008). Then, with the Australian scheme introduced on 1 January 2011, financial support for<br />
parents of newborns became far more generous than that offered in New Zealand. Australia’s PPL<br />
is paid at a higher level over a longer time, with broader coverage. Australian policy recognises the<br />
importance of a mother’s links to the labour market; at the same time it emphasises the beneficial<br />
role that parental leave has on the full development of children, and therefore the investment in the<br />
future workforce. This ‘child-centred’ approach is evidenced by the generous Baby Bonus payment<br />
available for those parents who do not qualify for PPL.<br />
In contrast, New Zealand’s PPL and Parental Tax Credit (PTC) have narrow work-based requirements.<br />
The resulting inequities reflect the different nature of the New Zealand discourse surrounding financial<br />
support for children. New Zealand’s policy is not ‘child’ focussed; it is based on whether parents are<br />
‘deserving’ through their paid work contributions. Disturbingly, beneficiaries (and superannuitants)<br />
who are caring for newborns are specifically excluded from entitlement to any additional assistance<br />
from either the PPL or the PTC.<br />
Paid Parental Leave in Australia<br />
Australia’s PPL scheme was originally announced on 14 July 2010 as a new entitlement programme<br />
for eligible parents or carers of children born or adopted from 1 January 2011. The scheme recognises<br />
that “taking time away from work for a new baby is a common part of working life”, with the aim<br />
to facilitate parents spending time with their newborns to “promote early childhood development”<br />
(Government of Australia, 2010a).<br />
The policy change is based on evidence suggesting that the first year, and particularly the first six<br />
months of a baby’s development, is strongly influenced by parental care (Australian Productivity<br />
Commission, 2009; OECD, 2007a). The scheme also argues that PPL will bring long term benefits<br />
to business by improving the quality of the next generation of workers (Government of Australia,<br />
2010b). This recognition of the role that PPL can play in improving the child’s development clearly<br />
underpins the Australian Government’s parental assistance policies and programmes.<br />
45 Dr Susan St John, QSO, Associate Professor of Economics, University of Auckland, co-director of the Retirement Policy<br />
and Research Centre and a member of the Management Committee of <strong>Child</strong> <strong>Poverty</strong> <strong>Action</strong> <strong>Group</strong>.<br />
46 Andrew Familton graduates from the University of Auckland in 2011 with First Class Honours in Economics, and is<br />
currently employed in the financial industry.<br />
47 Dr M.Claire Dale is Research Fellow with the Retirement Policy and Research Centre at the University of Auckland, and<br />
a researcher and policy analyst for <strong>Child</strong> <strong>Poverty</strong> <strong>Action</strong> <strong>Group</strong>.<br />
76
The Australian Productivity Commission’s inquiry into PPL, Support for Parents with Newborn<br />
<strong>Child</strong>ren, concludes that:<br />
• there is compelling evidence of child and maternal health and development benefits from a period<br />
of absence from work for the primary caregiver of around six months;<br />
• there are sound rationales for stimulating women’s labour force participation rates to overcome<br />
the disincentives imposed by the existing welfare and tax systems on women’s labour force<br />
participation; and<br />
• PPL could advance broad social objectives, such as achieving greater gender equity and balance<br />
between paid work and family life.<br />
The Australian Productivity Commission argues that unpaid activity is work, and parental leave thus<br />
has an inherent value in itself. Parental leave changes the mix of jobs in the economy but does not<br />
destroy jobs. In stark contrast, the New Zealand discourse neither recognises the value of caring for<br />
children, nor recognises this unpaid activity as work.<br />
In Australia, a new parent can be a full-time, part-time or casual worker, or a worker with multiple<br />
employers, and still be eligible for PPL if they satisfy the work test. Since full-time workers are more<br />
likely to receive employer-funded paid leave, making it easier for non-standard workers to fulfil<br />
the work requirement broadens access to PPL across different types of work. Eligibility requires<br />
the recipient to be an Australian resident and primary carer for the child, with an adjusted taxable<br />
individual income of less than $150,000 for the previous financial year. Recipients must also satisfy a<br />
work test by having worked at least 1 day a week for 10 of the 13 months prior to the birth or adoption<br />
of the child (i.e. 330 hours).<br />
The 2011 taxable payment rate for PPL is A$1,140 fortnightly (A$570 weekly), and is paid for 18<br />
weeks (A$10,260 total pre-tax). 48 Parents can share the paid parental leave, for example, a mother<br />
may claim 13 weeks and then transfer the remaining 5 weeks of paid leave to the partner who is the<br />
primary carer for that period. If the employee has been in the job for longer than 12 months at the<br />
date of birth or adoption, the government-funded payments are administered by the employer. The<br />
rationale for employers administering the PPL payments is to encourage firms to remain in contact<br />
with the new parent/employee, thus maintaining their links to the labour market (Government of<br />
Australia, 2009).<br />
For those who do not qualify for PPL, there is a Baby Bonus payment for newly born or adopted<br />
children. To be eligible, the primary carer of the child must be an Australian resident, and have a<br />
family taxable income of under A$75,000 in the 6 months following the birth or adoption of the baby. 49<br />
The Baby Bonus is A$5,249, paid as 13 equal fortnightly payments of A$407.23. Claiming either the<br />
PPL or the Baby Bonus entitlements precludes claiming the other.<br />
In the Australian social assistance system, PPL is paid for 18 weeks, is taxable and interacts with<br />
other benefits. A parent receiving PPL cannot receive the Family Tax Benefit B (FTC B). Most families<br />
are better off with PPL, but if their circumstances are such that they are better off with FTCB and the<br />
Baby Bonus they are entitled to that as an alternative. 50<br />
48 Under Australia’s income tax schedule, the first $16,000 of a person’s income is effectively tax-free.<br />
49 This income limit is equivalent to an annual adjusted taxable income of A$150,000.<br />
50 The 2011 maximum Family Tax Benefit B payment see Chapter 5 Appendix 3.<br />
77
Paid Parental Leave in New Zealand<br />
Since 1987, New Zealand has provided 52 weeks of employment-protected unpaid leave under the<br />
Parental Leave and Employment Protection Act 1987. A PPL scheme introduced in 2002 aimed to<br />
achieve: gender equity within both the labour market and within families; improved health outcomes<br />
for mother and child; and income stability for families (Callister & Galtry, 2009). Amendments have<br />
since lengthened PPL from 12 weeks to 14 weeks and widened eligibility, for example self-employed<br />
parents have been able to qualify since July 2006.<br />
New Zealand’s work-test for PPL requires a mother to have worked for the same employer for at<br />
least 10 hours a week (at least one hour in every week or 40 hours a month), for either 6 or 12<br />
months prior to the due date of the baby. Complying with the 6 month criterion entitles the parent to<br />
14 weeks’ PPL; and complying with the 12 month criterion also entitles the parents to the 52 weeks’<br />
employment-protected unpaid leave.<br />
The Inland Revenue Department (IRD) administers the New Zealand PPL system. Fortnightly<br />
payments for up to 14 weeks are based on the mother’s gross weekly earnings and range from a<br />
maximum of NZ$441.62 per week (as at July 2010), to a minimum weekly payment of NZ$127.50,<br />
equivalent to 10 hours of minimum wage work. 51<br />
As in Australia, there are other forms of financial assistance to new parents in New Zealand for<br />
those who do not meet the criteria for PPL. As part of the Working for Families (WFF) package, the<br />
Parental Tax Credit (PTC) provides up to $150 weekly for the first eight weeks following the birth of<br />
a child, totalling $1,200. The PTC abates after other WFF tax credits as described in Chapter 5. For<br />
a family with only a single newborn, total WFF tax credits cut out at an annual income of $114,424.<br />
If the family already has other children then payments cut out at higher levels of income. 52 However,<br />
to be eligible for the PTC, the family must effectively be a ‘working’ family, as no PTC is paid if the<br />
family income for the full eight weeks includes:<br />
• an income-tested benefit, even if it is suspended;<br />
• New Zealand Superannuation;<br />
• a veteran’s pension;<br />
• a student allowance; or<br />
• accident compensation from ACC, unless it is for less than three months.<br />
Eligibility for the PTC is thus strongly linked to the recipient’s or partner’s attachment to the labour<br />
market, and many parents either do not satisfy the criteria or qualify for a part payment only. While<br />
PPL payments will be higher for most people, a mother with annual income under $19,350 in a job<br />
she is taking leave from may be better off taking the PTC (The Inland Revenue Department, 2010).<br />
Who loses out?<br />
PPL in New Zealand is tied to participation in the labour market and the arbitrary<br />
requirements of the work test have some unfair consequences (Callister & Galtry,<br />
2009). Firstly, a new mother could have a long history of productive work but not<br />
in the 6 months immediately preceding the expected arrival of the baby. Also,<br />
51 For example, a self-employed person who makes a loss but satisfies the hours of work.<br />
52 Refer to the IRD’s Working for Families Tax Credits worksheet 2010-2011, at http://www.ird.govt.nz.<br />
78
New Zealand has a large number of citizens living abroad: there may be women with long working<br />
histories abroad who do not meet the eligibility requirement for having worked in New Zealand.<br />
One of the policy motivations for PPL being tied to labour market participation is that it encourages<br />
women to have long-term experience in the labour market. Yet women play a much more active role<br />
in the contemporary labour market than even 20 years ago, and most mothers return to the labour<br />
force whether they are eligible for PPL or not. Therefore, the need for a PPL scheme to maintain<br />
mothers’ links to the labour market, though still a valid motivation, is not as important now as it may<br />
have once been (Callister & Galtry, 2009).<br />
Moreover, there is doubt that all eligible families in New Zealand are aware of the availability of<br />
financial support, particularly for first-time parents. The first report in the Growing up in New Zealand<br />
series stated that while 77% of mothers were aware of the WFF tax credits, the other 23% were not.<br />
Two thirds of this group were first-time mothers (Morton & al, 2010).<br />
New Zealand’s work-oriented parental support schemes are questionable during a significant<br />
recession and an increase in non-standard work patterns. In the period immediately prior to a new<br />
baby’s birth, some families with long, productive working history may not fulfil the work test criteria<br />
either through redundancy or reductions in working hours. Under the current system they are, in<br />
effect, deemed undeserving of financial support. If this financial pressure does not enable parents<br />
to care for their children optimally then the inadequacies of the New Zealand PPL, especially in the<br />
drawn out recession, will increase the number of at-risk children.<br />
The Families Commission has argued that, consistent with international trends, PPL in New Zealand<br />
needs to adapt to current trends towards labour market flexibility. The Commission suggests easier<br />
access to parental assistance, for example through the removal of the minimum hours test, and<br />
payment after employment or self-employment for six months in the last 12 months prior to birth or<br />
adoption, without a limit on the number of employers or positions (Families Commission, 2010a).<br />
Comparing Provision of PPL: Australia and New Zealand<br />
Australia’s PPL appears much more generous than that available to New Zealand parents. The<br />
maximum gross amount of PPL in New Zealand totals NZ$6,182.68, or roughly 485 hours of work at<br />
the minimum wage of NZ$13. The actual amount can be as little as $1,785 for those working parttime.<br />
In Australia, the total gross PPL is A$10,260 which is equivalent to 684 hours of work at the<br />
adult minimum wage of A$15, and the amount paid is not based on previous earnings.<br />
The level of payments is important because it influences the length of leave that a parent will or can<br />
take. In New Zealand, many mothers would like to take longer leave: the biggest barrier to taking the<br />
full 12 months of parental leave (paid and unpaid) is financial (Callister & Galtry, 2009). This suggests<br />
that PPL lessens but doesn’t alleviate financial pressure to go back to work and that increasing the<br />
level of payments may increase the average length of parental leave taken.<br />
Australia’s system provides a much higher minimum payment for all low income families of newborns<br />
who do not get PPL as discussed in Chapter 5. The Baby Bonus is much more generous and<br />
universal than New Zealand’s PTC (A$5,249 as against NZ$1,200). Where the PTC abates as<br />
income increases, the Baby Bonus does not; it simply has an upper income limit. The combination<br />
of the Baby Bonus and Family Tax Credit B make the extra support for a newborn in Australia nearly<br />
as much as PPL.<br />
79
Despite being extended from 12 to 14 weeks, New Zealand’s PPL scheme is still shorter than the 18<br />
week Australian scheme. There is evidence that for many parents, government-funded PPL schemes<br />
are claimed after all other private parental leave. That is, they extend the total PPL that a parent can<br />
access. In fact, the introduction of a PPL scheme in Australia was partially motivated by a desire to<br />
increase the length of leave taken by Australians who currently take only a relatively short period<br />
(Australian Productivity Commission, 2009).<br />
Sharing the caring and work<br />
When paid parental leave is available for a short time<br />
only, it is difficult for fathers to play a direct caregiving<br />
role. Mothers are clearly much more likely to provide<br />
the care on a daily basis for a baby of under 14 weeks<br />
but when women do all the formal caregiving in a family,<br />
their opportunities for paid work diminish. They typically<br />
work either in jobs with lower pay and greater flexibility<br />
or are forced to work part-time, or fail to work at all.<br />
However until men’s lives become more like women’s and the work of caring in society is more<br />
equally shared, this inequality will remain a structural problem. In European nations such as Norway,<br />
Germany, Iceland and Portugal, not only is paid Parental leave much more generous than in New<br />
Zealand or Australia but part of parental leave is specifically for fathers. For example in Norway,<br />
after the birth of a child each parent receives two week’s paid parental leave. They can divide up the<br />
remaining 46 weeks of parental leave at full pay or 56 weeks at 80% of full pay as they prefer, but<br />
a 10-week quota is set in place for fathers only to encourage paternity leave. Fathers taking leave<br />
increased from 3% to 90% since its introduction in 1993 (Chemin, 22 July 2011).<br />
Summary and conclusion<br />
Australia’s PPL scheme is more generous in both the level of financial support and length of payments.<br />
New Zealand citizens living in Australia are eligible for Paid Parental Leave or the Baby Bonus<br />
because they qualify as Australian residents. The Families Commission has argued that Australia’s<br />
relative generosity could reduce the likelihood of these New Zealanders returning when they have<br />
children. Given that the migration of skilled New Zealanders to Australia and the implications of this<br />
for economic growth are a prime concern of the government (Whitehead, 2010), the significant gap in<br />
financial support offered to new parents from 1 January 2011 is clearly an issue that merits attention.<br />
While both the Australian and New Zealand schemes are linked to labour market participation there<br />
are subtle differences in the justifications for this link. The Australian scheme helps mothers preserve<br />
attachment to the general labour market but it also attempts to link them specifically to their previous<br />
employers, such that they are more likely to continue to work with those employers when they return<br />
to work. The aim is to maintain “job and employer-specific skills” that would otherwise be reduced<br />
(Australian Productivity Commission, 2009). By contrast, the emphasis on work in New Zealand’s<br />
scheme lacks this focus on continuity of employment and skill-based motivation.<br />
The Australian Productivity Commission has also argued that unpaid activity is work. Parental leave<br />
is thus seen as having an inherent value in itself and changes the mix of jobs in the economy but<br />
does not destroy jobs. This recognition of the value of caring for children, and the recognition of this<br />
unpaid activity as work, is almost completely absent from the New Zealand discourse.<br />
80
Overall, New Zealand is well behind Australia in its support for new parents, a reflection of the far<br />
more rigid thinking about the role of paid work. By contrast, Australia appears relaxed about a more<br />
generous paid parental leave scheme with less strict work requirements and a far more generous<br />
Baby Bonus entitlement for those parents who do not satisfy the work requirements for PPL. In New<br />
Zealand many newborns get no extra assistance at all. The children negatively affected by being<br />
left out of this extra government financial support are the very poorest children whose needs are<br />
greatest. Their number will increase as the recession continues to drag on.<br />
Recommendations<br />
• Improve the level and coverage of financial support for all new parent/s and their newborn children<br />
so that none miss out.<br />
• Investigate a Baby Bonus equivalent to ensure all newborn children are funded for the best<br />
possible start;<br />
• Change the PPL eligibility requirements so that the work test does not require the same employer<br />
and promote much more flexibility in meeting work requirements;<br />
• Investigate how to encourage firms to remain in contact with their employees, and enable new<br />
parents to maintain their links to the labour market;<br />
• Allow parents/primary caregivers to share the PPL. Investigate ways to make men’s life more like<br />
women’s so that both work and care are shared;<br />
• Pay the PPL at a standardised rate, rather than an earnings-based percentage.<br />
81
Chapter 8. Reforming <strong>Child</strong> Support<br />
Susan St John 53 and Michael Fletcher 54<br />
Introduction<br />
<strong>Child</strong> support is governed in New Zealand by the <strong>Child</strong> Support Act 1991 and administered by the<br />
<strong>Child</strong> Support division of Inland Revenue. The Act affirms the right of children to be maintained by<br />
their parents and the obligation of parents to maintain their children. Two key objectives are to enable:<br />
• caregivers of children to receive support in respect of those children from parents without the<br />
need to resort to court proceedings;<br />
• the State to offset the cost of providing an adequate level of financial support for children and their<br />
custodians by the collection of a fair contribution from the liable parent. 55<br />
The purpose is to ensure liable parents take financial responsibility for their children when marriages<br />
and relationships end. The scheme is compulsory for custodial parents who receive a sole parent<br />
benefit such as the Domestic Purposes Benefit to allow the state to recover costs from the noncustodial<br />
parent. Other parents may choose to apply for <strong>Child</strong> Support assessed by IRD, may get<br />
<strong>Child</strong> Support payments paid through the IRD supported by a parenting order, or through mutually<br />
agreed voluntary arrangements. Currently approximately 210,000 children are included within the<br />
<strong>Child</strong> Support scheme (Dunne, 2010). Approximately 84% of custodial parents are women (Chapple<br />
& Cronin, 2007).<br />
How it works<br />
<strong>Child</strong> Support is payable until the child turns 19 unless the child marries; is in full employment;<br />
receiving student allowance or an independent circumstances grant; or in receipt of a welfare or<br />
training benefit. The liability is calculated as shown below in the four-step calculation. Where the<br />
custodial parent is on a sole parent benefit, <strong>Child</strong> Support payments up to an amount equal to that<br />
benefit are retained by the Crown. If the amount collected is more than the benefit, the excess is<br />
paid to the custodian. 56 If the custodian is not a beneficiary the full amount collected is paid to them.<br />
If each parent cares for one or more of the children for at least 40% of the nights (6 nights a fortnight,<br />
or 146 nights per year), both parents are deemed to share care and both are treated as a custodian<br />
and a liable person. In this situation each parents’ liability is assessed and a lower child support<br />
percentage is used in the formula below.<br />
Four-step calculation of child support 57<br />
• The paying parent’s taxable income is determined;<br />
• A living allowance is deducted;<br />
53 Dr Susan St John, QSO, Associate Professor of Economics, University of Auckland, co-director of the Retirement Policy<br />
and Research Centre and a member of the Management Committee of <strong>Child</strong> <strong>Poverty</strong> <strong>Action</strong> <strong>Group</strong>.<br />
54 Michael Fletcher is an economic and public policy researcher, and PhD candidate at AUT University.<br />
55 The terms ‘eligible custodian’ and ‘liable parent’ are those used in the Act to define parents who may be eligible to receive<br />
or liable to pay <strong>Child</strong> Support.<br />
56 This applies to only about 2,000 custodial parents (three percent).<br />
57 For more detail see St John and Rankin (2009), and http://www.ird.govt.nz/childsupport/paying-parents/workoutpayments/calculation/.<br />
82
• The result is multiplied by a percentage rate;<br />
• The annual amount is divided into 12 equal amounts and is to be paid by the 20th of each month.<br />
The amount the IRD deducts as the living allowance depends on the personal circumstances of the<br />
paying parent. The living allowance is related to gross benefits from Work and Income. For example<br />
the exempt amount for single person with no dependents is $14,281, and for a single or partnered<br />
person with two children living with them is $30,558.<br />
The percentage rate used in the formula depends on the number of children for whom the paying<br />
parent must pay child support. When a shared care arrangement 58 exists for child support purposes,<br />
the IRD counts each child in the arrangement as 0.5 of a child. The percentages where the paying<br />
parent is not in a shared care arrangement for child support purposes are also given in Table 8.1.<br />
Table 8.1. percentage of income for <strong>Child</strong> Support payments<br />
(Source IRD website)<br />
Number of children Not shared care Shared care<br />
1 18% 12%<br />
2 24% 18%<br />
3 27% 21%<br />
4 30% 24%<br />
5 30% 25.5%<br />
6 30% 27%<br />
7 30% 28.5%<br />
8 or more 30% 30%.<br />
A minimum payment of $848 per annum applies irrespective of income (this is the amount many<br />
liable parents on a benefit are required to pay). There is also a maximum income level set at two-anda-half<br />
times the national average earnings (in 2011/12 the maximum liable income is $121,833 pa).<br />
Problems with <strong>Child</strong> Support<br />
The current New Zealand <strong>Child</strong> Support regime is seen by many as out-dated, inflexible and<br />
unfair. <strong>Child</strong> Support payments are frequently regarded by custodial parents (mostly mothers) to<br />
be inadequate compared to the cost of children and their own loss of income due to forgoing work<br />
to care for the child. A culture of payment avoidance, unstable liability calculations and unreliable<br />
payments also mean primary caregivers receiving <strong>Child</strong> Support often feel payments provide little or<br />
no real support. The absence of any pass-on to the custodial parents on a sole parent benefit means<br />
many of them receive no <strong>Child</strong> Support at all whilst also discouraging liable parents from paying.<br />
Many countries such as Australia and the UK have already substantially revised their schemes but<br />
New Zealand has been very slow to follow suit.<br />
There is international evidence that well-designed <strong>Child</strong> Support policies can contribute to better<br />
outcomes for poor children. The OECD Doing Better for children notes that in some countries <strong>Child</strong><br />
Support is “an important policy tool in reducing child poverty in sole parent families” (2009b, p. 234).<br />
Bradshaw (2006) shows <strong>Child</strong> Support’s contribution to reducing working sole parents’ poverty in<br />
58 More information on shared care is in IRD’s booklet: Helping you understand shared care (IR156) at: http://www.ird.govt.<br />
nz/forms-guides/keyword/childsupport/paying-parents/ir156-guide-cs-shared-care.html.<br />
83
the UK, although pre-reform it had much less effect for non-employed sole parents. In contrast,<br />
Chapple and Cronin (2007), conclude that “The role of <strong>Child</strong> Support payments in direct overall<br />
poverty alleviation [in New Zealand] is almost certainly minimal”. Better <strong>Child</strong> Support policies could<br />
contribute to lower rates of child poverty in sole parent families.<br />
In 2010 the Minister of Revenue released a discussion document that outlined a range of options for<br />
improving the child support scheme, purporting to “make the scheme fairer and to take into account<br />
changes in society since the scheme was introduced in 1992” (Dunne, 2010).<br />
The thrust of the options as discussed further below are revisions to the <strong>Child</strong> Support formula to<br />
recognise lower levels of regular and shared care, take into account each parent’s income less a<br />
living allowance and to vary the <strong>Child</strong> Support payable not only by the numbers of children but also<br />
by their age. The <strong>Child</strong> Support payable would also be based on the parents’ combined income<br />
assuming that expenditure on children rises in absolute terms as income rises, but declines in<br />
percentage terms (Dunne 2010).<br />
Proposals for change are expected to be considered by Cabinet in late 2011. The discussion<br />
document drew submissions from over 2,300 people. The key submission themes included:<br />
• Arguments for both the inadequacy and the excessiveness of child support payments and how<br />
they are calculated;<br />
• Issues around recognising shared care;<br />
• Whether child support payments should apply if there is an equal care arrangement;<br />
• The impact that a child support formula based on the income of both parents would have on the<br />
incentive for parents to work or increase their earnings;<br />
• The impact on the family income when a parent has re-partnered and the extent to which the cost<br />
of supporting children in the second relationship are taken into account;<br />
• Dissatisfaction with current child support penalty rules (Dunne, 2011c).<br />
While the Minister of Revenue has claimed that reform will be more focussed on the well-being of<br />
children, few submissions in fact appear to have focussed on that aspect. Perceived unfairness to<br />
liable parents (who are mostly fathers) has played a dominant role and few submissions reflect the<br />
daily reality for children, and custodial parents (mostly mothers).<br />
What is wrong with current policy?<br />
It is clear that the current <strong>Child</strong> Support rules can often be destructive to family harmony, while failing<br />
to ensure that the custodial parent and their children are supported sufficiently to prevent hardship.<br />
Ideally, when there is no benefit involved, parents can come to their own arrangements by mutual<br />
agreement. This appears to have the best outcomes by allowing a high degree of give and take and<br />
flexibility (Families Commission, 2009). While any reform must encourage voluntary agreements,<br />
by for example providing suitable support counselling, in many cases no such outcome is possible.<br />
A sound <strong>Child</strong> Support scheme also provides a crucial baseline for separated parents negotiating<br />
voluntary arrangements.<br />
Under the <strong>Child</strong> Support scheme, viewed from the perspective of the child and the custodial parent,<br />
there are several problems. The first is that, because the formula is based solely on an assessment<br />
84
of the liable parent’s ability to pay, no account is taken of variation in the needs or costs of raising a<br />
child. The payment does not take into consideration the increasing cost of children as they age. Nor<br />
does it reflect the opportunity cost of the primary caregiver, usually the mother, who forgoes work to<br />
care for the child.<br />
The adjustment in the living allowance to reflect the liable parent’s responsibilities of care for children<br />
in a new relationship decreases the payments made to the custodial parent although these children<br />
may not have any biological or legal tie to the liable parent, nor evidence any actual dependency. If<br />
a non-custodial parent moves in with a new partner and their children, their child support payments<br />
are reduced. The resulting instability of liability means payments are not always a reliable means of<br />
support to custodial parents and their children.<br />
There is a lack of coherence behind the formulae. While it may be reasonable that <strong>Child</strong> Support<br />
liabilities are reduced if the ex-partner has a new child, it is less clear that it should be reduced on<br />
account of a new partner’s existing children, especially in cases where those children’s other parent<br />
is already paying <strong>Child</strong> Support.<br />
A second problem is the absence of any ‘pass-on’ of <strong>Child</strong> Support to custodial parents who are<br />
receiving a sole parent benefit. Ensuring some part of <strong>Child</strong> Support payments is always passed<br />
on to the custodial parent provides additional income for sole parent beneficiary families. It also<br />
improves non-custodial parents’ willingness to pay <strong>Child</strong> Support. Many countries permit full or partial<br />
pass-on and, for example, both Australia and the UK introduced forms of pass-on in their recent<br />
policy reviews. In New Zealand, the Minister’s discussion document options did not include pass-on,<br />
concluding only that “no changes are warranted at this time” (Dunne, 2010 p. 70).<br />
The third problem relates to shared care. As Chapter 5 noted, the definition of shared care for<br />
<strong>Child</strong> Support is different from that used for Working for Families. This can lead to confusion and<br />
unfairness. For <strong>Child</strong> Support the criterion is six nights a fortnight, which is taken as 40% of the time;<br />
for Working for Families it is on an hours basis, with shared care established if the hours are split at<br />
least 9/14 and 5/14 with a minimum of 122 days (for the non-custodial parent). The use of the six<br />
nights criterion can be particularly inappropriate if the child is preschool as it cannot be assumed that<br />
a parent who looks after the child overnight also has the child in the day-time, i.e. for the full 24 hour<br />
period. Thus it is possible for a mother to look after the child every day of the working week and be<br />
unable to work herself, and to have the full responsibility for any preschool dropping and picking up<br />
or care when sick, and yet to be assigned only eight days a fortnight because the other parent takes<br />
the child overnight for six nights.<br />
For some non-custodial parents, the six nights’ rule is also unfair in that it may fail to recognise the<br />
time they do spend caring for their child. If a lower level of nights (14% has been suggested in the<br />
discussion document) was used in the formula, however, many custodial parents who may already<br />
be struggling would get less financial assistance, not more.<br />
Moreover the number of nights spent with each parent does not necessarily reflect their financial<br />
commitment. Primary caregivers often cover the costs of clothing, education and health care, while<br />
many carry the cost of forgone employment because of unreliable shared care arrangements. It is<br />
not uncommon for mothers to have to step in at short notice when children become sick or the other<br />
parent fails to provide for their children (Tolmie, Elizabeth, & Gavey, 2010a).<br />
85
Although the system does have a process for parents to apply for a review of their circumstances and<br />
a variation in assessments, it is often a wearying and difficult process to challenge an assessment<br />
made on the ‘nights’ basis.<br />
Tying the noncustodial parent’s financial responsibility to the number of nights liable parents spend<br />
with their children in a fixed formula creates a monetary incentive to increase care. However in some<br />
cases shared care is not always the best outcome for the child. There may be situations in which<br />
liable parents are violent or abusive, or otherwise unfit for sole responsibility of their child. Shared<br />
care may actually be detrimental to children’s wellbeing when it results in exposure to parental conflict<br />
or disrupts the development of a secure attachment to the primary caregiver (Tolmie, Elizabeth, &<br />
Gavey, 2010b).<br />
A fourth problem is administrative issues and non-payment. There is often a lengthy delay in first<br />
receipt of <strong>Child</strong> Support by the custodial parent during which time the custodial parent may have<br />
little or no income at all. <strong>Further</strong>, once liability and payment amounts are established, <strong>Child</strong> Support<br />
money is only passed on to the custodial parent when and if it has been received by Inland Revenue.<br />
In June 2010, total <strong>Child</strong> Support debt (including penalties) stood at $1.944 billion (Dunne 2010, p.<br />
57). Unlike New Zealand, about half the OECD countries now have ‘advance maintenance’ provisions<br />
in which the government continues to pay the custodial parent the due amount effectively taking on<br />
the costs of seeking reimbursement from non-custodial parents itself (OECD 2009 p.228). That is,<br />
arguably, as it should be, as the state has low cost, coercive powers to enforce payment that are not<br />
available to individuals.<br />
In summary, the main problems with current <strong>Child</strong> Support policies are: weaknesses in how the<br />
formula used accounts for parents’ costs and needs, including a failure to address the opportunity<br />
costs for a parent forgoing employment in order to care for the children; the lack of any pass-on<br />
of <strong>Child</strong> Support payments where the custodial parent is on a sole-parent benefit; inflexibility with<br />
respect to shared care arrangements; and administrative problems including the lack of advance<br />
maintenance provisions to ensure custodial parents’ incomes are maintained when a custodial<br />
parent fails to keep up with payments.<br />
Lessons from Australia and the UK<br />
There are lessons to be learned from the experience of Australia and the UK, both of which have<br />
reformed their child support arrangements toward a more child-centred approach and focus. These<br />
reforms have been comprehensive and include moves to enable a primary caregiver parent on a<br />
benefit to receive <strong>Child</strong> Support payments directly.<br />
Australia and the UK<br />
A CPAG backgrounder on the history of child support and the reforms in Australia (Casswell-Laird,<br />
2010) outlined a number of important reforms and their implications for New Zealand legislation.<br />
Australia has shifted away from focusing solely on the capacity of the liable parent to pay, towards<br />
the welfare and financial maintenance of the child. New legislation takes into account the actual cost<br />
of raising children and recognises that the expenditure on raising children increases with income but<br />
declines as a proportion of income. Australia has also endeavoured to acknowledge some degree of<br />
the caregiver’s lost earnings through higher rates to 0-4 year olds given that childcare costs are likely<br />
to be highest for very young children.<br />
86
In contrast to New Zealand, in Australia, the custodial parent is always given a percentage of the<br />
money collected from the non-custodial parent, even when receiving income support. It was believed<br />
this would create incentive for the liable parents to comply with child support payments as they can<br />
see the direct benefit to their children. If the care-giving parent is on a benefit, any child support<br />
payment is treated as income.<br />
The Australian scheme does not automatically include step-children in child support calculations. If<br />
children are not biological or adopted, liable parents have to prove they are financially responsible<br />
(the children’s parents have died or the child has special requirements).<br />
It is important to note that the Australian reforms were a package of measures aimed at improving the<br />
effectiveness of their <strong>Child</strong> Support scheme overall. Indeed, a recent ‘before and after’ analysis (i.e.,<br />
with no consideration of how people might change their behaviour under the new policies) concluded<br />
that in general “non-resident parents (mostly fathers) were more likely than resident parents (mostly<br />
mothers) to experience net gains under the new scheme” and that “low-income families and resident<br />
parents with part-time or casual employment appear to be among those most likely to have been<br />
hardest hit...” (Smyth & Henman, 2010, p. 5).<br />
In the UK there have been phased changes to the <strong>Child</strong> Maintenance programme including moving to<br />
allow those on benefits to keep their payments. This policy arose from a concern about child poverty.<br />
We are tackling child poverty. We make sure parents who live apart from their children contribute<br />
financially to their upkeep by paying child maintenance. (<strong>Child</strong> Support Agency web site http://<br />
www.csa.gov.uk/)<br />
Since April 2010, the amount of child maintenance that the parent with care receives has not affected<br />
any benefit the caregiver receives (UK <strong>Child</strong> Support Agency, 2011). Future directions in a green<br />
paper emphasise that the child maintenance system needs to be re-balanced towards supporting<br />
parents to work collaboratively rather than entering conflict.<br />
The proposed reform outlined in this Green Paper is intended to encourage and support families<br />
to take responsibility by making their own arrangements for child maintenance wherever possible.<br />
The State’s involvement through the statutory child maintenance system can then be focussed<br />
on families who are not able to come to their own arrangement. (<strong>Child</strong> Support Agency web site<br />
http://www.csa.gov.uk/)<br />
New Zealand reform proposals<br />
The New Zealand Government’s discussion document outlines a series of primary options for<br />
updating child support legislation in New Zealand. These options focus on three facets – the child<br />
support formula, improving payment compliance and reducing debt.<br />
A formula based on the cost of the child is recommended as more equitable for both custodial<br />
and liable parents as supported by the Families Commission (2009). However, when it comes to<br />
calculating the actual cost of children the opportunity costs of mother’s caregiving are ignored as<br />
discussed below.<br />
Formula revisions are divided in the document into three degrees of change. The most comprehensive<br />
of these revisions recognises lower levels of shared care using tiered thresholds, takes into account<br />
the income of both parents and more accurately calculates the cost of children. This cost calculation<br />
87
is based on the number of children, their age (costs being higher for children over 12 years), and<br />
parents’ combined income (understanding that with income rises, expenditure rises in absolute but<br />
not relative terms).<br />
Payment avoidance has been a considerable concern with rates of compliance being particularly<br />
low among liable parents whose money is retained to offset custodial parents’ benefits. Penalties for<br />
non-payment have not been incentive enough to increase compliance and have instead resulted in<br />
accumulating debt. The document’s solutions include compulsory deduction of child support payments<br />
from wages, giving Inland Revenue the ability to place greater reliance on terms of parenting orders,<br />
capping penalties, and, instead, increasing non-financial enforcement measures.<br />
<strong>Child</strong>-centred approach to <strong>Child</strong> Support<br />
The major deficiency in the current proposals is that they merely tweak the formulae when something<br />
much more comprehensive is needed. In particular they fail to consider how children’s lives may be<br />
enhanced.<br />
<strong>Child</strong> Support reform must put the child’s well-being at the centre, not the financial needs of the<br />
Crown, nor of just the liable parent. The comments here reflect CPAG’s concern first for children and<br />
in particular for children living in low-income families either because they are supported by a sole<br />
parent on a benefit or by a low income sole parent who is receiving <strong>Child</strong> Support directly because<br />
they work 20 or more hours a week and have exited the benefit system.<br />
Inclusion of opportunity costs<br />
CPAG suggests that the needs of very young children require a very different time component from<br />
the primary caregiver. Work of any substantial nature by the mother is often precluded. The needs<br />
of the child, including when sick and unable to attend early childhood education centres, can make<br />
employment of sole parents of young children unattractive to employers. This is a particular issue<br />
for sole parents who do not have high income earning potential, or have young or sick children, or<br />
children with special needs.<br />
Currently the ‘costs of the child approach’ takes no account of the opportunity costs of the mother’s<br />
caregiving. An analysis released by the IRD (Claus, Leggett, & Wang, 2009) simply ruled them<br />
out on the basis of not being a cash cost. Although the significant cost of childcare is recognised,<br />
the inclusion of childcare in costings was also rejected because variation in workforce participation<br />
complicates the calculation.<br />
In the child’s early years opportunity costs should be included in the <strong>Child</strong> Support calculation. These<br />
costs are independent of the on-going costs of the child, e.g. food, housing, healthcare, nappies,<br />
beds, cots, toys, high chairs, transport, and is additional to those costs. Couples who are living<br />
together and have young children typically deal with these opportunity costs – there is less money<br />
for both parents and their children because one parent (usually the mother) stays home to care for<br />
the child. It is logical that the same approach should apply to separated parents.<br />
The inclusion of these opportunity costs requires quantification. One approach might be to cost the<br />
care at the minimum wage. Currently if a custodial parent looks after the child herself she is donating<br />
unpaid time to their joint parenting obligations. An alternative approach would be to base the estimate<br />
on the cost of good quality full-time day care. At present full-time quality care for under two year olds<br />
can cost anything up to $450 per week.<br />
88
Ultimately the extent to which opportunity costs need to be built into the <strong>Child</strong> Support formula,<br />
and therefore apportioned between custodial and non-custodial parents, depends on the level of<br />
Government overall support for parents through childcare provision, benefits, and tax credits. The<br />
key point however is that the <strong>Child</strong> Support formula needs to recognise the income forgone that is<br />
often associated with being the custodial parent. In Australia, the Family Tax Credit B (see Chapter<br />
5) is paid to all sole parents without an income test, and if the parent is not working it can be taken<br />
with them in full into a partnership providing the new partner’s income is less than A$150,000. This<br />
recognises the costs of care and is a much more equitable way of effectively providing a degree<br />
of income-splitting than the proposals currently before the House from the Hon. Peter Dunne (see<br />
Chapter 8).<br />
<strong>Child</strong> <strong>Poverty</strong> Objective<br />
A child-centred <strong>Child</strong> Support scheme should seek specifically to reduce child poverty. The<br />
incorporation in the formula of an allowance for the opportunity costs in respect of young children, as<br />
discussed above, is one important part of doing so.<br />
A second and critical element is to include pass-on, so that custodial parents on a sole parent benefit<br />
receive at least part of the <strong>Child</strong> Support paid by the other parent. Fletcher and Dwyer (2008) report<br />
that, in 2006, <strong>Child</strong> Support payments were not passed on in respect of 150,350 children (55% of<br />
all <strong>Child</strong> Support children and involving 90,000 custodial parents) because of the custodial parent’s<br />
benefit status. They also cite an Australian Senate paper that reported that the effect of passing<br />
on <strong>Child</strong> Support and treating it like any other income for benefit abatement purposes would lift an<br />
estimated 60,000 Australian children above the poverty line (Senate Community Affairs Reference<br />
Committee, 2004).<br />
Simplification objective<br />
<strong>Child</strong> Support reform must aim to simplify agreements between parents, and arrangements with<br />
the IRD and Work & Income rather than complicate them and cause stress and anxiety. The shared<br />
care rules should be aligned with Working for Families and for <strong>Child</strong> Support. However there is also<br />
a good case for not apportioning Working for Families tax credits in most cases. Any change to the<br />
formula for <strong>Child</strong> Support needs to take account of Working for Families. At present, the two types<br />
of shared care adjustment complicate the picture of the financial share that each parent is in fact<br />
contributing.<br />
Conclusions<br />
Research undertaken in New Zealand by the Families Commission, and in Australia, shows that<br />
separating couples who are able to cooperate on parenting and put their children’s needs first,<br />
are more satisfied with their care and financial arrangements than those who have arrangements<br />
imposed on them by the court or the <strong>Child</strong> Support system. Thus it is important to provide better<br />
information and support for separating couples (Families Commission, 2010b).<br />
<strong>Child</strong> Support reform must be conducted in an environment that takes into account issues of the<br />
caregiver’s opportunity costs, the way WFF tax credits operate, other government initiatives affecting<br />
social assistance and the role of early childhood education and school fees. Other family assistance<br />
measures, such as Paid Parental Leave and the Parental Tax Credit, need also to be considered.<br />
89
A shift in focus from the needs of the Crown to the needs of custodial parents and their children is<br />
required. There should be legislative change in line with Australia and the UK ensuring custodial<br />
parents are always given at least part of their child support payment, even when receiving income<br />
support. CPAG supports the Families Commission (2009) which has suggested a parent who is<br />
the primary caregiver on a benefit should always be better off when child support is paid. Advance<br />
maintenance provisions should also be introduced so that custodial parents are not left out of pocket<br />
if IRD fails to collect payments. These changes would make a positive difference to the level of<br />
hardship faced by low income families.<br />
Recommendations<br />
• <strong>Child</strong> Support reform must have the child’s well-being at the centre, not the financial needs of the<br />
Crown, nor of just the non-custodial parent;<br />
• <strong>Child</strong> Support reform must act to ameliorate child poverty for children in families supported by a<br />
benefit or low income;<br />
• Part or all of <strong>Child</strong> Support should be paid directly to the parent on a benefit;<br />
• <strong>Child</strong> Support reform must aim to simplify agreements between parents, and arrangements with<br />
the IRD and Work & Income rather than complicate them and cause stress and anxiety;<br />
• <strong>Child</strong> Support reform must be conducted in a holistic environment that takes into account issues<br />
of the caregiver’s opportunity costs, the way Working for Families tax credits operate, and other<br />
government initiatives affecting social assistance;<br />
• More resources for post-separation parenting courses and financial counselling are needed to<br />
encourage voluntary arrangements outside of the <strong>Child</strong> Support scheme to gain the benefits from<br />
flexibility and co-operation.<br />
90
Chapter 9. Tax Reform and the macro economy:<br />
Heaven help the children<br />
Susan St John 59 and Andrew Familton 60<br />
Introduction<br />
2011 is a grim year as the impact of a series of domestic disasters including the Christchurch<br />
earthquakes, finance company bailouts, and leaky homes costs, hit an already weak economy.<br />
New Zealand’s international debt situation is ominous, making the country vulnerable to a rating<br />
downgrade, higher interest rates, a possible collapse in the currency, and higher inflation. As if that<br />
is not bad enough, there are world problems in food markets and higher prices for imported fuel. The<br />
2011 budget deficit has blown out and the prospect of a drawn-out slump seems inevitable with a<br />
severe decline in many families’ living standards.<br />
Amidst these concerns the impact on children can be easily forgotten. The alarming persistence of<br />
child poverty in New Zealand in spite of the rapid growth in wealth and income inequality throughout<br />
the ‘seven golden years of plenty’ until 2008, was described in <strong>Left</strong> <strong>Behind</strong>. Now more than three<br />
years on, over and above the misery in Christchurch, hardship has got worse throughout New<br />
Zealand, with many more families needing the assistance of food banks, budgeting services and<br />
debt management.<br />
Tax policy, as part of overall economic management, is a critical component for sharing the pain of<br />
hard times. 61 Since <strong>Left</strong> <strong>Behind</strong> was published in 2008, there have been several rounds of tax cuts<br />
and a rise in GST. By early 2011, the fruits of tax reform could be judged to have failed to materialise:<br />
tax revenue was down instead of up and the deficit was much larger than projected. The Government<br />
declined to reverse any of the tax cuts or implement a levy on higher incomes to pay for the recovery<br />
of Christchurch, and then delivered a tight Budget on in May 2011, signalling significant spending<br />
cuts.<br />
This section describes how the tax system has been spectacularly unsuccessful in apportioning the<br />
tax burden equitably, and how current directions have widened New Zealand’s wealth and income<br />
gaps. We note the difference in the way that Australia has responded to the global financial crisis<br />
and natural disasters, so that there is no inevitability for the New Zealand approach (Spies-Butcher,<br />
2010). While the way tax is gathered is only one mechanism for achieving a fairer distribution of<br />
income, it is a very important one especially because the welfare and tax systems are so closely<br />
connected.<br />
Background<br />
New Zealand’s tax system does have some desirable features compared to the mid-1980s. Then,<br />
New Zealand had a highly distortionary, inequitable and complex system, including a mishmash of<br />
different sales tax rates, and a top tax rate of 66% that was widely avoided. There were numerous<br />
gaps in the tax base, so that a lot of income escaped tax. Fringe benefits to employees and capital<br />
gains from the sale of assets were two examples.<br />
59 Dr Susan St John, QSO, Associate Professor of Economics, University of Auckland, co-director of the Retirement Policy<br />
and Research Centre and a member of the Management Committee of <strong>Child</strong> <strong>Poverty</strong> <strong>Action</strong> <strong>Group</strong>.<br />
60 Andrew Familton graduates from the University of Auckland in 2011 with First Class Honours in Economics, and is<br />
currently employed in the financial industry.<br />
61 Thanks to Michael Littlewood for his helpful criticisms and contributions to this Chapter.<br />
91
The tax reforms of the mid to late 1980s were designed to help restore a measure of fairness and<br />
simplicity and to ‘level the playing field’ instead of rewarding activities that were under-taxed or not<br />
taxed at all (St John, 2007). As a result of these changes, the New Zealand tax system is often held<br />
up to be one of most efficient (OECD, 2007b). At the same time the OECD noted that New Zealand<br />
continues to fail to tax capital gains.<br />
By 2010 a number of ad hoc changes meant we were a long way from the simple, comprehensive<br />
income tax supplemented by a low rate broad-based GST envisaged in the 1980s. Among key issues,<br />
KiwiSaver and PIEs introduced savings incentives while investment in housing remained very taxadvantaged<br />
and a major mechanism through which the better-off increased their wealth, contributing<br />
to increasing inequality. Following the Tax Working <strong>Group</strong>’s report, the 2010 budget increased GST<br />
and reduced the tax on income and saving. This was followed by the report of the Savings Working<br />
<strong>Group</strong> and the changes in the Budget in May 2011.<br />
Tax Working <strong>Group</strong><br />
The Government-appointed Tax Working <strong>Group</strong> (TWG) (2010) outlined how New Zealand had lost<br />
the edge as an international leader in tax policy, describing the tax system as falling short on the<br />
criteria of equity, efficiency and administrative simplicity. Many high income people had been avoiding<br />
their fair share of tax by the use of companies, trusts, loss-making properties, and tax-paid managed<br />
funds. Some apparently qualified for Working for Families tax credits as a result of generating rental<br />
losses or hiding income in tax-paid funds.<br />
The TWG was convinced that aligning the company, trustee, and top tax rates, at perhaps 30% or<br />
lower, was the direction reform should take. The price of levelling down the rates however would be a<br />
less progressive tax system. The implicit value judgment was that the criterion of efficiency was more<br />
important than that of equity because lower tax rates are supposed to distort economic decisions<br />
less. While they modelled the impact of different scenarios of tax cuts and base-broadening on child<br />
poverty and inequality, their concern was limited to ensuring that these did not get noticeably worse.<br />
The questions ignored were “is the current level of inequality and poverty acceptable? If not, how can<br />
taxes be redesigned to improve equality and reduce poverty?” The TWG either implicitly accepted<br />
that the prevailing distribution was optimal, or that distributional aims were best achieved by other<br />
tools outside of the tax system.<br />
Another limitation of the TWG’s exercise was the requirement for the suggested reforms to be<br />
‘revenue neutral’. The revenue from tax cuts had to be found from base-broadening or another<br />
source such as GST. But raising GST and lowering tax rates leaves little leverage to halt the rise in<br />
debt in a protracted downturn such as we see in 2011. Unwilling to reverse tax cuts and realising that<br />
further rises to GST would be politically very damaging there is little room to move except either to<br />
make unpalatable spending cuts, or to compound the debt problem by further borrowing.<br />
While the TWG may have considered that distributional aims were best targeted outside of the tax<br />
system and that distortions of the tax/welfare interface were identified as a concern, this line of<br />
analysis was denied to them in their mandate. Although a family on an income over $48,000 might<br />
face an effective marginal tax rate of over 50% due to Working for Families (WFF), the more serious<br />
problems faced by those on benefits whose effective marginal tax rates may exceed 90% was<br />
ignored. These are serious negative incentives to work for these individuals and families.<br />
92
Claiming that such ‘welfare’ transfers were outside its brief, the TWG nevertheless had to take WFF<br />
into account as it is the key way taxes are adjusted for family size. But this complex package,<br />
(discussed in Chapter 6), was not examined in detail at all by the TWG, that did not ask even the<br />
obvious questions as to whether the various tax credits in WFF achieved their original purpose.<br />
<strong>Further</strong> scope for policy improvement was ignored.<br />
Because the TWG did not analyse the design of tax credits, its suggested changes to reduce effective<br />
marginal tax rates were problematic. For example, one scenario modelled universalising the last<br />
$2,000 a child of WFF Tax Credits. At a further cost of $700 million annually, this would, in practice,<br />
pay the In Work Tax Credit (because it abates last), to the very wealthiest families. It is clear that<br />
these families don’t need a payment to ‘make work pay’ or ‘address child poverty’. Remarkably, as<br />
modelled, this extra $700 million expenditure would not increase family payments at all at the lower<br />
end where they are so desperately needed.<br />
Tax changes 2010 budget<br />
The key 2010 tax reform was the shift from income tax to more reliance on GST. The basis of this<br />
was a faith that the shift must be good for incentives to work, save and invest:<br />
Lower personal tax rates encourage individuals to work, invest and save, increasing wealth<br />
and productivity. (Dunne, 2011a)<br />
The main argument for the tax shift used by the TWG and later by the Government-appointed Savings<br />
Working <strong>Group</strong> (SWG) was that a shift to a higher GST would encourage saving. In addition, tax<br />
concessions would incentivise saving. At the same time, and confusingly, the tax shift was supposed<br />
to encourage economic growth. The government repeatedly claimed that the tax reforms of the 2010<br />
budget were highly significant. See, for example, an address by the Minister of Revenue:<br />
Last year’s Budget measures were the most significant tax reform in New Zealand for over<br />
twenty years, shifting the weight of taxation from income to consumption. That Budget<br />
contained substantive tax measures to improve the incentives for efficient savings while<br />
maintaining the integrity of the tax system. (Dunne, 2011a)<br />
The reality is that the expected outcomes have not materialised. The Government gave large tax cuts<br />
to the top income earners, and gave very little to those at the bottom. The rich enhanced their wealth<br />
and repaid debt, while, as most middle and low income people tried to save more, the local economy<br />
became further depressed. The surplus income that tax cuts give the rich help build up large and<br />
unsustainable imbalances of wealth and power alongside increased debt for the poor.<br />
The government claimed that greater integrity and fairness was promoted by aligning the trust rate<br />
and top tax rate, to reduce the tax advantage from sheltering income. Unfortunately it saw this only<br />
in terms of aligning down to the lowest possible rate, rewarding the former tax avoiders. The top<br />
tax rate was reduced from 38% to 33%, closer to the new company rate of 28% but still creating a<br />
5 percentage point gap which in turn means a high incentive remains to avoid the top tax rate. The<br />
Government obscured this by claiming higher returns to KiwiSaver and other long-term savings,<br />
increased investment, international competitiveness and stronger GDP growth:<br />
With more capital goods, labour is more productive so this encourages productivity and<br />
growth. (Dunne, 2011a)<br />
93
The tax reforms were sold to the public as both fiscally neutral and distributionally neutral, but they<br />
are clearly neither. The government was relying on a high growth rate to assert that by 2012 the tax<br />
reductions would be balanced by tax gains. Even so the reform was still expected to cost $1 billion<br />
over the four years to 2013/14 (Minister of Finance, 2011, p. 70).<br />
The income and tax paid for year ended March 2011 were presented in a misleading way as Table<br />
9.1 from the 2010 budget illustrates:<br />
Table 9.1. Who pays income tax and how much<br />
(Source 2010 Budget: Keyfacts for taxpayers http://www.treasury.govt.nz/budget/2010/taxpayers/02.htm)<br />
Annual individual taxable income Number of people Tax paid<br />
($) (000) % ($m) %<br />
Zero 236 7 0 0<br />
1-10,000 446 13 237 1<br />
10,000-20,000 834 25 1,576 7<br />
20,000-30,000 416 12 1,507 6<br />
30,000-40,000 349 10 1,965 8<br />
40,000-50,000 304 9 2,306 10<br />
50,000-60,000 244 7 2,506 10<br />
60,000-70,000 168 5 2,267 9<br />
70,000-80,000 113 3 1,885 8<br />
80,000-90,000 67 2 1,367 6<br />
90,000-100,000 56 2 1,332 6<br />
100,000-150,000 89 3 2,961 12<br />
150,000+ 52 2 3,963 17<br />
All 3374 100 23,872 100<br />
* This table includes tax on NZ Superannuation and major Social Welfare benefits, but excludes ACC levies, Working for<br />
Families and independent earner tax credits and anyone under 15. Data are projected for the year ended March 2011 and<br />
include the 1 October 2010 tax changes.<br />
Data are projected for the year ended March 2011 but the figures show only 6 months of the GST/<br />
income tax shift, and are presented in a way that is designed to show that higher income groups pay<br />
a disproportionate share of tax rather than that they earn a disproportionate share of the income.<br />
While taking the most optimistic view of positive impacts of the tax reforms to justify fiscal neutrality, the<br />
government adopted contrary assumptions to justify the distributional neutrality of the 2010 Budget.<br />
It was argued that higher income groups, who received the most from the income tax changes, paid<br />
more GST and lost some advantages in the taxation of their residential investment properties. Yet<br />
these calculations were based on dubious assumptions, such as assuming all households spend<br />
91% of their disposable income on GST-rated goods. Table 9.2 shows the impact of a whole year of<br />
the tax shift. The table shows the very small gains at the bottom end, and disguises the large gains<br />
that the top end by taking the income range only to $120,000 and by assuming that almost all of even<br />
these top incomes is spent on GST-rated goods.<br />
94
Table 9.2 Gains from the October 2010 tax shift<br />
(Source 2010 Budget: Keyfacts for taxpayers http://www.treasury.govt.nz/budget/2010/taxpayers/02.htm)<br />
Annual<br />
individual<br />
taxable income<br />
Annual decrease<br />
in income tax<br />
Annual increase in<br />
GST<br />
Net annual<br />
after-tax<br />
income<br />
change<br />
($) ($) ($) ($) ($)<br />
5,000 100 88.38 11.63 0.22<br />
10,000 200 176.75 23.25 0.45<br />
15,000 315 263.41 51.59 0.99<br />
20,000 490 343.2 146.8 2.82<br />
25,000 665 433.49 231.51 4.45<br />
30,000 840 513.28 326.72 6.28<br />
40,000 1,190.00 672.86 517.14 9.94<br />
Net weekly<br />
50,000 1,530.00 817.09 712.91 13.71<br />
60,000 1,830.00 952.43 877.57 16.88<br />
70,000 2,130.00 1,087.77 1,042.23 20.04<br />
80,000 2,630.00 1,213.01 1,416.99 27.25<br />
90,000 3,130.00 1,338.25 1,791.75 34.46<br />
100,000 3,630.00 1,463.49 2,166.51 41.66<br />
110,000 4,130.00 1,588.73 2,541.27 48.87<br />
120,000 4,630.00 1,713.97 2,916.03 56.08<br />
after-tax income<br />
change<br />
The example given by the government to show that the tax shift was neutral was the exceptional<br />
case of a high income earner who owned 10 rental properties. Someone on $20,000, received a<br />
tax reduction of $490, but paid extra GST of $343 almost cancelling out the gain, while someone on<br />
$120,000 gained $4,630 in tax reductions, and even if they spent all their income, paid only $1,713<br />
in extra GST. In addition, high income people gained from a lower PIE rate, and a lower company<br />
rate from April 2011.<br />
If high-income people spend all of the increased net income on GST-rated goods, then saving does<br />
not increase to the extent needed for the government’s saving argument. If they do not then the<br />
stimulus from the package does not meet the requirements for managing the seriousness of the<br />
recession.<br />
One of the very clear deficiencies of the 2010 budget response to the TWG was in the treatment of<br />
capital gains (Huang & Elliffe, 2011). While the government chose to quote selectively the reluctance<br />
of former task forces to recommend such a tax, it failed to see that such taskforces such as the<br />
2001 McLeod Review did not say it should be ignored. For example the McLeod Review strongly<br />
suggested the risk free rate method (RFRM) for the taxation of property. Likewise the TWG did not<br />
say the issue can be ignored and proposed a land tax or the RFRM. The 2010 budget did make some<br />
modest changes to the taxation of property but failed to grasp the scale of the needed changes that<br />
the TWG had signalled.<br />
95
The government claimed that the 2010 Budget measures also ‘significantly improved the integrity and<br />
fairness of the tax system’ by removing the tax advantage that could be gained by sheltering income<br />
in trusts. But instead of taxing trust income appropriately, the problem was ‘solved’ by rewarding the<br />
former tax avoiders with lower tax by making the top tax rate for individuals the same as the trust<br />
tax rate. The TWG’s goal of alignment has been used to support the government’s aim of reducing<br />
income tax rates for high income earners. Moreover, the incentive to shelter income in companies<br />
has been maintained in the aim of improving efficiency but sacrifices integrity, fairness and alignment<br />
in the process.<br />
The Savings Working <strong>Group</strong> and the 2011 budget<br />
Following the TWG, the SWG outlined the savings imbalances<br />
Busting the myths of a<br />
that affect New Zealand and in many ways follow the same capital gains tax<br />
logic.<br />
Capital gains tax has been the<br />
The SWG’s report focussed on concerns about New Zealand’s elephant in the room over 40 years<br />
high level of indebtedness and vulnerability to financial of discussion about tax reform<br />
in this country. But we have a<br />
shocks. One of the strong recommendations was for a 5 or<br />
mountain of debt to move, and an<br />
10 percentage point reduction on marginal tax rates for all<br />
elephant could be a useful way to<br />
investors in PIEs, and to interest and dividends more generally.<br />
help move it.<br />
A second was to introduce auto-enrolment of all employees into South Africa’s experience shows<br />
KiwiSaver, reducing the starting age to 16 and increasing the assumptions about a capital gains<br />
default contribution rate. A third theme was to encourage the tax being unworkable are largely<br />
government to improve its own balance sheet by a return to hyperbole. (Chye-Ching Huang and<br />
Craig Elliffe, NZ Herald 12 January<br />
operating surpluses.<br />
2011)<br />
One of the very under-debated issues in the tax reform process<br />
of which the TWG and the SWG are an integral feature is encapsulated in this statement:<br />
The right balance between labour and capital taxation is probably the key tax policy issue that<br />
governments face (Dunne, 2011a).<br />
Table 9.3 sets out the tax rate changes for 2010 and 2011. These were not changed by the 2011<br />
Budget.<br />
Table 9.3. Tax rate changes 2010-2011<br />
Income 1 April 2010 1 October 2010 1 April 2011<br />
$0-$14,000 12.5% 10.5% 10.5%<br />
$14,001-$48,000 21% 17.5% 17.5%<br />
$48,001-$70,000 33% 30% 30%<br />
$70,000 and over 38% 33% 33%<br />
GST 12.5% 15% 15%<br />
Company tax rate<br />
Top PIE<br />
30%<br />
33%<br />
30%<br />
28%<br />
28%<br />
28%<br />
The savings debate<br />
The benchmark model that New Zealand used to have was that of including all income in the<br />
personal income tax base taxed at a relatively low rate. In theory, in this approach there should be no<br />
96
distinction between income from work, bonuses, capital gains, interest, dividends and employmentrelated<br />
perquisites. This approach has now been abandoned in favour of believing that the returns to<br />
capital should be treated less punitively than the returns to labour income to encourage investment<br />
and saving. Repeatedly, as in the work of the TWG, the SWG asserted that a lower tax on the returns<br />
to capital is justified.<br />
But why should the returns to saving be treated more favourably than the returns from working? The<br />
theoretical argument for a pure GST increase and corresponding income tax reduction causing an<br />
increase in saving is thin. The presumption has been that there is a close connection between saving<br />
and productive investment and that the former causes the latter.<br />
This is bad economics. It ignores the reality of the huge speculative and unproductive unearned<br />
income gains from capital that have been possible. It also ignores the disconnect between saving<br />
(done by individuals) and productive investment (usually carried out by firms for reasons quite<br />
different to those that may lead to increased saving).<br />
If I save by putting my money into a finance company and that pays me a higher interest rate than a<br />
bank deposit, does that make me a good saver? What is the judgement when the finance company<br />
lends my money to a developer for the development of an inflated-priced property that proves to be<br />
a foolish and worthless venture? If my ‘saving’ is borrowed for the purchase of a second hand car in<br />
South Auckland at a high interest rate, what is the productive aspect of this income that suggests it<br />
should be taxed at a lower rate than my earned income?<br />
Consider next that money on term deposit at the bank is<br />
The concept of “saving” is complex.<br />
likely to be lent to younger families through mortgages.<br />
Annual saving is the difference<br />
During hard times such as in 2011, mortgage defaults are<br />
between income and consumption.<br />
common, and many families suffer poverty when job losses Saving occurs when people pay off<br />
put them behind in repayments. The depositor’s return is some of their mortgages, just as it<br />
however protected and taxed at a lower rate than the income does when money is building up in<br />
of the struggling family. Better-off baby-boomers with plenty an investment or bank account or in a<br />
share portfolio.<br />
of property are paid NZS in addition to other income so do<br />
they really need a lower tax rate when they lend their excess<br />
to the poor? It is ironic that in times past, unearned income was treated less generously than earned<br />
(see insert), now it is treated more generously.<br />
One argument is that part of the return to capital (for example, interest) is a reflection that inflation<br />
erodes the capital. Thus taxing interest at a marginal tax rate lower than that of the saver is supposed<br />
to provide compensation. But we do not allow for any costs to be deducted against labour income<br />
to allow for depreciation of human capital, so why should we allow a deduction for the portion of the<br />
return to capital that reflects the depreciation of the capital due to inflation? The boundary problems<br />
provide another reason to want retain a system that treats income from all sources the same. And<br />
surely in New Zealand before we start talking about treating capital more favourably, we must include<br />
all forms of capital income including all capital gains that are currently untaxed.<br />
Likewise, the insistence that New Zealand must have a lower company tax rate to keep business in<br />
New Zealand is based on a pure model of economic behaviour. The TWG said that if New Zealand<br />
had a higher company tax rate than other countries then thin capitalisation (using borrowed money<br />
instead of equity and deducting the interest as a cost in the high tax country) and transfer pricing<br />
would see companies transfer taxable profits elsewhere. It also believed that company tax was a<br />
97
tax on labour. But, others have challenged this presumption<br />
arguing it is in large part borne by owners of capital and a<br />
lower company tax rate implies a higher tax will be needed on<br />
labour to raise the required revenue. Moreover while capital<br />
may be mobile, in New Zealand we have to worry also about<br />
labour leaving our shores. A low company tax rate may have<br />
unintended consequences, for example, it appears to have<br />
contributed to Ireland’s economic collapse by encouraging tax<br />
haven activity (O’Toole, 2009).<br />
More profoundly, society has ambivalent and contradictory<br />
attitudes to debt and savings issues. Saving and lending is<br />
portrayed as ‘good’ and debt and borrowing as ‘bad’, yet you<br />
cannot have one without the other. At the global level as some<br />
countries have run ever higher current account deficits, other<br />
countries have run correspondingly increasing surpluses. One<br />
necessarily implies the other.<br />
Taxing unearned income<br />
From 1921 onwards a distinction<br />
was drawn between earned and<br />
unearned income so that the latter<br />
category attracted more tax. In the<br />
early years this was achieved by<br />
a percentage reduction of the tax<br />
on earned income up to £2,000<br />
but later on it was superseded by<br />
a percentage addition to the tax on<br />
unearned income. This distinction<br />
between earned and unearned<br />
income was not abolished until<br />
1950. (Taxation Review Committee,<br />
1967, p. 58)<br />
The effect of this has been for surplus countries such as Japan and China to accumulate ever more<br />
assets held abroad while debtor countries like the USA and New Zealand accumulate ever more net<br />
foreign financial liabilities. Globally these imbalances have become extremely unhealthy (Bollard,<br />
2010, p. 8). 62<br />
Domestically, as those at the top end of the distribution have appropriated more and more of the<br />
current national income, both through large pay rises, capital gains and tax cuts, they have had more<br />
ability to save. Whether or not that means banks borrow less from offshore, this tends to go hand<br />
in hand with others increasing their capacity to borrow, and their impoverishment ensures that they<br />
will need to do so. Thus the poor in South Auckland have borrowed large amounts through finance<br />
companies and loan sharks from those with surplus saving who ‘invest’ in the same companies.<br />
Tax cuts that cause ever larger deficits, which in turn require more borrowing and more public debt,<br />
are very regressive: the extra disposable income of high income people lent back to the Government<br />
implies an increase in taxes on everyone to pay for the guaranteed interest return, and ensures that<br />
that interest rates will be higher than would be the case if revenue had been raised through higher<br />
taxation.<br />
To compound matters, in 2011, the Government is faced<br />
with the financing of a major rebuild of Christchurch but is<br />
refusing to reverse any aspect of the 2010 tax cuts, even<br />
temporarily. It will therefore be borrowing by issuing New<br />
Zealand denominated debt, partly purchased by overseas<br />
lenders and partially purchased by New Zealanders.<br />
In contrast to the rich paying higher taxes, this is very<br />
regressive and adds further to the costs of servicing a<br />
growing debt; costs met by everyone.<br />
To reinforce this approach the Government is offering Earthquake Kiwi Bonds at 4% per annum for<br />
4 years to New Zealand residents. They are like the other Kiwi Bonds, however the money invested<br />
62 There is high-level debate about the importance of these imbalances. See http://www.bis.org/publ/work346.pdf.<br />
98
in these is said to go towards meeting the costs to the Government of the recovery in Christchurch.<br />
The new bonds may have a feel good factor for those looking for a safe, guaranteed return, but there<br />
is no inherent reason why the money should be ring-fenced for Christchurch.<br />
In contrast, to pay for the Queensland floods, the Australian government introduced a temporary levy<br />
that applies only to those earning over $50,000, and primarily to those earning over $100,000. This<br />
reflects the earlier difference in economic management of the impact of the global financial crisis. In<br />
New Zealand, the focus was on tax cuts. In Australia, focus was on spending, particularly for families<br />
with children and on the construction sector. This stimulus effect in Australia seems to have been not<br />
only very effective in combating the recession and maintaining confidence but also more equitable.<br />
The tax changes in New Zealand gave the largest gains to those on high incomes. In Australia, the<br />
spending was targeted at everyone except top earners: families earning under $100,000 received<br />
$950 for each child, aged pensioners received $1,400, and all income tax payers earning less than<br />
$80,000 received $900. After that initial one-off stimulus that was effective in keeping confidence<br />
high, it was much easier to move back towards surplus (Spies-Butcher, 2010). In contrast, New<br />
Zealand made the tax cuts permanent, and is facing severe problems in returning to balance or<br />
surplus.<br />
In the blinkered mindset of the New Zealand government the only possible responses are now asset<br />
sales and spending cuts. The targets are Working for Families, KiwiSaver, Student loans, the public<br />
sector and social programmes.<br />
KiwiSaver and pensions<br />
In <strong>Left</strong> <strong>Behind</strong> (2008), it was argued that the subsidies in KiwiSaver were regressive. In the meantime<br />
it has been older people who have reaped the main benefit from the subsidies. Policies have<br />
consistently advantaged the baby-boom generation, especially those who are retiring with assets<br />
and private saving. Some of these subsidies were reduced or removed in the 2011 Budget. While the<br />
subsidies were not the best way to help low income people, the removal of the subsidies in the 2011<br />
budget does not result in policies that redistribute more fairly to all low paid people.<br />
Although universal provision for children has been ruled out, New Zealand maintains a universal<br />
pension which, for high income pensioners of 65 and over, is taxed at a maximum of 33%, A low, flattax<br />
structure does not sit well with universal provision and there is strong case for a higher tax scale<br />
for those who are accessing New Zealand Superannuation (St John, 2009).<br />
Income splitting<br />
Income splitting was proposed in 2008 by the Minister of Revenue, the Hon Peter Dunne, as discussed<br />
in <strong>Left</strong> <strong>Behind</strong> (2008). Under the proposal, single-income families would treat their joint income as if it<br />
had been earned equally between the two partners, and thus pay less tax in total.<br />
In 2010, the Income Sharing bill passed its first reading in parliament and awaits its second reading<br />
in 2011. Peter Dunne claims there is ”overwhelming public support for this policy” which he justifies<br />
as ”vital in a liberal democracy like ours to allow people the opportunity to decide as many things as<br />
they can for themselves”:<br />
…couples with children [can] combine their income and split it down the middle for tax<br />
purposes, giving them more flexibility and the opportunity to spend more time raising their<br />
children… The gains would go to 310,000 families with children – that is about two thirds of all<br />
99
families and around three quarters of all children – a boost in their household incomes of up<br />
to $9,000 a year. (Dunne, 2011b).<br />
While the stated policy aims of recognising the costs involved in raising children and assisting single<br />
income families (and/or making it easier for one parent to remain at home) are worthwhile, this policy<br />
would do nothing to alleviate child poverty and nothing for sole parent and low income two earner<br />
families while advantaging the highest income groups the most. As CPAG (2010) argued:<br />
• Income splitting should not be a priority for scarce resources.<br />
• The splitting proposal is not actual income splitting and it reinforces stereotypes that do not help<br />
women.<br />
• Income splitting is not a recognition of the worth of the stay at home parent.<br />
• The problem has been mis-specified as to the inequity between the single earner and dual earner<br />
households on the same income.<br />
• Current arrangements provide an incentive for sharing of work and care.<br />
• Working for Families is the mechanism for transferring taxes paid by workers to caregivers.<br />
Income splitting provides perverse incentives to claim partnership.<br />
• Income splitting is optional. Whose option will this be: his or hers?<br />
The problem with the Goods and Services Tax<br />
Historically New Zealand’s share of tax revenue from GST has been average for OECD countries<br />
(OECD, 2007b).<br />
New Zealand’s GST captures everything except housing, rents and financial transactions, all of<br />
which can be ignored for our purposes. This universal application brings numerous administrative<br />
benefits for both IRD and businesses processing GST returns. Also, organisations do not waste time<br />
trying to squeeze their service or product into a GST-exempt category to gain a competitive price<br />
advantage. The broad coverage of GST also implies that it is an economically efficient tax relative<br />
to other countries’ consumption taxes. Indeed it allows the New Zealand government to collect a<br />
relatively large proportion of its tax revenue from GST levied at a comparatively low rate. In 2009,<br />
when GST was at 12.5%, GST revenue accounted for 21% of the government’s tax revenue (The<br />
New Zealand Treasury, 2009) despite being levied at a rate of only 12.5%, the sixth lowest rate in<br />
the OECD (White, 2009).<br />
Other countries with GST-like taxes attempt to deal with their regressive nature by exempting items<br />
such as food, clothing and books. New Zealand has no such exemptions and has avoided the pitfalls<br />
of trying to compensate low income groups with these clumsy tools. But are we in danger of killing<br />
the golden goose?<br />
The TWG and the SWG were very enthusiastic about GST and appeared to believe that because<br />
it is so good we should have more of it. The 2010 budget raised GST from 1st October 2010 to<br />
15% and the SWG wanted it raised even more. Unfortunately, the higher the rate of GST, the more<br />
the pressure for exemptions, and the greater the likelihood that New Zealand will end up with the<br />
problems other countries have.<br />
100
Early in 2010, the Māori Party’s Rahui Katene put forward a private member’s bill that exempts<br />
‘healthy’ food from GST, and in September 2010, Labour announced that it will remove GST from<br />
fresh fruit and vegetables if it wins the next election. 63<br />
New Zealand is one of the few countries in the developed world that does not make some GST<br />
exemptions for food. But exempting fresh fruit and vegetables will lead to either a short-fall in the<br />
government’s revenue, or an increase in the rate of GST, or other taxes, to balance the revenue loss.<br />
Labour estimated a fiscal cost of exempting fruit and vegetables from GST at around $250m (Goff,<br />
2010). The TWG previously estimated that exempting all non-takeaway food would cost approximately<br />
15% of the revenue of GST (The New Zealand Treasury & Inland Revenue Department, 2009).<br />
Unfortunately this policy is not well-targeted as higher income families would gain the most as they<br />
spend more on this category of food. Would there be a further increase in GST on all other goods and<br />
services to cover the cost? Or would there be a compensating increase in income tax rates? Both<br />
increases could have implications for the fairness of the tax system, and these implications should<br />
not be ignored.<br />
In the meantime, the 15% GST is taking a cruel bite out of family incomes in the recession. Low<br />
income families do not benefit much from falls in prices due to the higher exchange rate and are<br />
disproportionately affected. 64 The answer is not to exempt items but to make sure benefits, wages,<br />
tax credits, thresholds for abatement, and all other social provisions, are generously compensated.<br />
The changes for Working for Families, for example, as discussed in Chapter 6, are clearly going in<br />
the wrong direction.<br />
Tax in Australia and New Zealand compared<br />
We talk about catching up with Australia but we seldom hear talk about the difference in the tax<br />
systems. Australia has a much more progressive income tax rate structure with an effective $16,000<br />
tax free threshold once the low income earner rebate has been included, and a top tax rate of 45%<br />
on incomes over $180,000. In the meantime GST in Australia has remained at 10%. The levy for<br />
Medicare of 1.5% is offset by an exemption for low income earners.<br />
Low income earners retain much more in the hand for each extra dollar earned after tax and GST. If<br />
each dollar earned up to A$16,000 is spent, the total tax component including GST is 9%, leaving 91<br />
cents of real goods and services.<br />
In New Zealand for each dollar earned up to NZ$14,000, the tax component including GST and<br />
Accident Compensation levy (2.04%) is 24%, leaving only 76 cents of real goods and services.<br />
So not only do low income people have higher gross incomes because their wages (and the minimum<br />
wage) are higher in Australia, they are also able to benefit more in ‘after tax terms’. And of course in<br />
2011 the New Zealand dollar is only worth only about 75% of the Australian dollar.<br />
Urgent unresolved tax issues in 2011<br />
The definition of income for social provisions such as Working for Families, student allowances and<br />
early childhood care, has been significantly broadened to limit claims by the better-off. The definition<br />
now includes trustee income, attributable fringe benefits, passive income of children, ‘unlocked PIE<br />
63 The aim of simplifying the category of ‘healthy’ food via the label ‘fresh’ has resulted in Labour ignoring the high nutritional<br />
content and low cost of frozen fruit and vegetables.<br />
64 Low income families do not often enjoy overseas travel, or export goods and services.<br />
101
income’ and so-called ‘periodic payments’. While counting all income is justified, regular gifts of<br />
money from other family members may also be caught.<br />
Thus while gift duty has been abolished for the better-off, regular transfers to struggling low income<br />
families over $5,000 pa are penalised. Birthday gifts are exempt, but, for example, payments made<br />
for day-care by a grandparent may be captured by ‘family scheme income’. A family transfer of<br />
$5,001 means $1,000 loss of WFF tax credits. Most low income ‘working families’ do not hide money<br />
in PIEs and trusts, and yet they may be caught under these arbitrary rules. If a grandparent looks<br />
after the grandchild themselves, the noncash contribution is not counted even though the overall<br />
value of the help is the same. Yet it may be argued that grandparents who can afford it should be<br />
encouraged to help their children with monetary transfers. In the recession, without such help, many<br />
more low income families will resort to increased borrowing and food-banks.<br />
If it is fair that incomes of families who claim WFF include all income from all sources, then it is fair<br />
that all income is aggregated and taxed at the appropriate rate of the earner. It is still easy to ‘hide’<br />
or segregate income into vehicles that are effectively ‘final taxpayers’, such as companies, trusts,<br />
superannuation schemes and ‘portfolio investment entities’ (PIEs). That will be made even easier<br />
on 1 October 2011 when gift duty is removed. Wealthy retired people can structure their incomes to<br />
pay a top rate of only 28% or even less with a clever tax advisor (Retirement Policy and Research<br />
Centre, 2009).<br />
Another side effect of encouraging tax-paid funds is that it is not possible to tell a person’s actual<br />
income. Consequently figures on income distribution based on taxable personal income understate<br />
income, especially at the top of the distribution.<br />
New Zealand has a relatively flat personal income tax regime compared with many other countries<br />
and a high proportion of tax is collected via the broad-based consumption tax (GST), which reinforces<br />
the burden of tax on the poor. High-income earners are also advantaged as capital gains remain<br />
largely untaxed. The use of family trusts and superannuation schemes to minimise tax and child<br />
support liabilities and maximise WFF and student allowances for high-income earners have been<br />
curtailed, but there are still no inheritance or wealth taxes, or stamp duties on housing sales.<br />
In 2001 the first major review of taxes for 30 years recommended that New Zealand adopt a “Risk<br />
free rate method” (RFRM) of taxing housing instead of a capital gains tax. The merits of this were<br />
unfortunately never debated (The Treasury, 2001). The 2010 Tax Working <strong>Group</strong> also raised the<br />
prospect of RFRM, but the government did not adopt any major reform of the tax treatment of housing<br />
following their report.<br />
This distortion in the tax system continues to threaten<br />
long-term economic stability. New Zealand’s worrying<br />
net international liability has arisen largely as a result of<br />
the banking sector borrowing from overseas to feed the<br />
housing asset bubble. In the housing boom prior to 2008,<br />
equity withdrawal from the housing market fuelled consumer<br />
spending. The excessive investment in housing does not<br />
increase the productive capacity of New Zealand and hence<br />
does not increase our ability to repay the overseas loans.<br />
The 2001 Tax Review recommended<br />
the Risk Free Rate Method (RFRM),<br />
where individuals are taxed on their<br />
net equity in housing as if they had<br />
invested this money in a deposit at<br />
a risk-free rate of, say, 4%. Complex<br />
accounting for rents, costs, profits<br />
and losses would not be needed as<br />
this would be the only tax. A limited<br />
exemption could apply to owneroccupied<br />
homes. (The Treasury, 2001,<br />
p. 32)<br />
102
While depreciation expenses are not now deductible in most cases, housing investment losses can<br />
still be written off against other income, and nominal interest on loans for such investment is still fully<br />
deductible. In many other OECD countries, such losses are ring-fenced, and there are special capital<br />
gains taxes.<br />
Progressive income tax regimes are increasingly out of favour in New Zealand and believed to<br />
punish hard work and initiative. What is usually left out of the discussion is the fact that, as is the case<br />
in New Zealand, flat tax regimes are regressive, and are a major contributor to income and wealth<br />
inequality. The rationale for broad-based flat tax regimes: that they encourage investment and hence<br />
improve economic growth, is far from borne out empirically.<br />
For low and middle-income families in paid employment, the WFF package changed things for the<br />
better. For these families at least, the tax credits available to them make New Zealand’s tax structure<br />
considerably more progressive. However these are under threat from attrition policies in the 2011<br />
budget.<br />
Recommendations<br />
• Review the economic management of the past four years that has relied on tax cuts to stimulate<br />
the economy, borrowing to fund disaster relief and spending cuts to restrain the budget deficit.<br />
Learn the lessons from Australia;<br />
• Return GST to 10% as in Australia and complement it with progressive taxation. If there is no<br />
appetite for that, then far more generous compensation of lower income groups is required via<br />
higher benefits and more generous tax credits;<br />
• Aggregate all income for tax purposes under a comprehensive income tax approach;<br />
• Tax all investments at the appropriate marginal tax rate of the investor and eliminate special<br />
treatments;<br />
• Reform the tax treatment of rental housing and home-ownership investment to remove regressive<br />
advantages with either a Risk Free Rate Method or Capital Gains Tax;<br />
• Abandon income splitting as a policy under the Income Sharing Bill.<br />
103
PART THREE<br />
Chapter 10. <strong>Poverty</strong> and violence, and children<br />
Mike O’Brien 65<br />
Introduction<br />
While most of the discussion in New Zealand about abuse and neglect has focused on the behaviour<br />
of individual carers, a more useful discussion and analysis would consider the significance of<br />
economic, income and poverty factors. Two fundamental points about the relationship between<br />
poverty and child abuse and neglect need to be made as a backdrop to the wider discussion:<br />
(1) child abuse is not limited to those on a low income and those living in poverty;<br />
(2) most children living in poverty and in low-income households do not experience abuse.<br />
These arguments are repeated frequently in the research on child abuse, child maltreatment and<br />
neglect and poverty. They are critical observations because of the assumptions that are sometimes<br />
made about parents living below the poverty line. Equally importantly, as the discussion in this<br />
chapter demonstrates, there is an observed relationship between poverty and abuse and violence, a<br />
relationship that has disastrous consequences for some of the most vulnerable children in our society.<br />
The two statements at the start of this paragraph can easily lead to arguing that poverty therefore<br />
does not matter in relation to issues of abuse and violence. Such an argument would be a major<br />
distortion of what we know about abuse and poverty. It would mean that the connection between the<br />
two, identified in the international research, is conveniently ignored, with critical consequences for<br />
children and their families.<br />
The international evidence makes it very clear that there is an important relationship between poverty<br />
and child abuse, however, the nature of that relationship is not clear. The National Society for the<br />
Prevention of Cruelty to <strong>Child</strong>ren (NSPCC) observes in its review of the evidence from the United<br />
Kingdom about child abuse and poverty (2008, p.8): “child maltreatment is clearly a complex and<br />
multi-dimensional problem”.<br />
The research is clear about the link; what is not so clear is how that link works and the ways in<br />
which poverty is associated with a range of other critical considerations such as poor housing,<br />
unemployment, mental health difficulties, the effects of disadvantaged neighbourhoods and social<br />
exclusion, in impacting on child abuse and neglect. Unravelling the different, overlapping effects of<br />
the many variables is difficult. Irrespective of these difficulties, the significance of poverty cannot be<br />
ignored. It follows that reducing poverty and improving the lives of families and children living below<br />
the poverty line will have an effect on children’s experiences of abuse, violence and neglect.<br />
65 Dr Mike O’Brien is Associate Professor School of Counselling Human Services and Social Work at the University of<br />
Auckland, and Co Convenor of <strong>Child</strong> <strong>Poverty</strong> <strong>Action</strong> <strong>Group</strong>.<br />
104
Definition<br />
In her work on poverty and child abuse, Quilgars (2001, p.65) sets out the following definition of child<br />
abuse, drawing on a National Commission of Inquiry in the United Kingdom:<br />
child abuse consists of anything which individuals, institutions, or processes do or fail to do which<br />
directly or indirectly harms children or damages their prospects for safe and healthy development<br />
into adulthood.<br />
This is a wide definition and opens up the question of both direct physical, sexual and emotional<br />
abuse of children and, importantly for our purposes, wider questions about the role of society and<br />
social institutions in failing to provide adequately for children and their development. In the context,<br />
then, of the wider focus which Quilgars’ (2001) definition indicates, poverty, arising from whatever<br />
cause, in itself constitutes a form of abuse in that it represents a failure to ensure that children are<br />
given and provided with the resources and opportunities to develop fully.<br />
This is a wider definition than that set out in the recent report from the OECD<br />
(2011, p. 247) where they take up Gilbert et al.’s definition:<br />
<strong>Child</strong> maltreatment includes acts of commission (abuse) and acts of<br />
omission (neglect), usually on the part of a parent or guardian, that<br />
“result in harm, potential harm, or threat of harm to a child”, regardless of<br />
parental intent. (Gilbert et al., 2009)<br />
In this chapter we are using the wider definition because it captures the<br />
broad sense of society’s obligations to children, alongside individual parental<br />
and adult obligations. <strong>Child</strong> abuse and violence towards children includes<br />
neglect, physical abuse and sexual abuse. In this respect then, abuse and violence are actions by<br />
adults (usually) which create harm and injury for children and in vital and important senses create<br />
harm and disadvantage (sometimes very significant harm and disadvantage) for children both as<br />
they grow up and, as some of the literature indicates, for some into their adult lives. 66<br />
New Zealand data on child abuse<br />
New Zealand’s record in relation to child abuse and neglect is well documented (UNICEF, 2011).<br />
While there are difficulties in measuring the extent of change in both the incidence and prevalence of<br />
child abuse, it is clear that the incidence of violence towards children in New Zealand is particularly<br />
high (Carroll-Lind, Chapman, & Raskauskas, 2011, p. 11). The difficulty in being certain about the<br />
extent of change over time is that reports of increased numbers may reflect the greater willingness<br />
on the part of adults, agencies and children to report abuse and violence and there are also changes<br />
in measuring and defining what constitutes abuse and neglect. There are, for example, anecdotal<br />
reports that the numbers of reported incidents of child abuse and neglect have increased significantly<br />
immediately after television programmes which are focused on abuse and have encouraged reporting.<br />
Irrespective of these reporting and definitional changes, child abuse and neglect are unacceptably<br />
high in New Zealand. 67<br />
Reports on child abuse and neglect are more likely to occur in poorer communities. This compounds<br />
the difficulties in measuring the extent of, and changes in the rates of, child abuse and neglect, and<br />
66 See, for example, Evans (2005).<br />
67 For a useful contribution to clarifying issues of measurement and definition, see Connolly and Doolan (2007).<br />
105
in assessing the extent of child abuse in different socioeconomic groups. As Drucker (1997) notes in<br />
the US context:<br />
evidence shows that poor families are more likely than those with more economic resources to be<br />
identified and labelled as maltreating.<br />
Drucker’s note is an important one. The significant implication is that reported differences between<br />
socioeconomic groups may reflect differences in willingness to report abuse and neglect rather than<br />
actual behavioural differences. The OECD (2011) report makes a similar observation: highlighting<br />
differences in exposure to potential reporters; difficulty in negotiating their way out of the system;<br />
and greater willingness to place people on a record because of factors such as ethnicity or age.<br />
Poor families are likely to have more contact with reporting agencies and are less able to use legal<br />
assistance to avoid officials taking formal action.<br />
With these reservations in mind, Table 10.1 shows changes in child abuse notifications to the <strong>Child</strong><br />
Youth and Family Service, 2004–2009, the most recent data available.<br />
Table 10.1. Ages of children and young people identified in care and protections received<br />
(Source: Ministry of Social Development (2010c) Table CY.2, p. 218)<br />
Age of child or young<br />
person identified<br />
2004/5 2005/6 2006/7 2007/8 2008/9<br />
Notifications requiring further action<br />
0-1 year 5,179 6,543 6,289 6,145 8,070<br />
2-4 years 7,554 8,863 8,135 7,583 9,477<br />
5-9 years 11,880 13,216 12,469 11,330 13,802<br />
10-13 years 9,709 10,113 9,507 8,869 10,226<br />
14-17 years 6,199 6,700 6,184 5,612 6,299<br />
18 years or over 33 37 34 36 43<br />
Not recorded 1,045 1,069 1,227 1,164 1,307<br />
Total requiring further<br />
action<br />
41,599 46,541 43,845 40,739 49,224<br />
Notifications not requiring further action<br />
Total not requiring further<br />
action<br />
8,889 16,198 28,082 48,722 61,573<br />
All care and protection notifications received<br />
Total notifications<br />
received<br />
50,488 62,739 71,927 89,461 110,797<br />
Given the issues noted above in relation to changes in definitions and patterns of reporting, it is not<br />
possible to be definitive about the exact nature and extent of the increase. Nevertheless, we note<br />
(Table 10.2) that, over these five years, the number of investigations requiring action increased from<br />
just under 17,000 to just over 24,000.<br />
106
Table 10.2. Findings of investigations of care and protection notifications requiring further action<br />
(Source: Ministry of Social Development (2010b) Table CY.3, p. 219)<br />
Type of finding 2004/5 2005/6 2006/7 2007/8 2008/9<br />
Findings from investigations of care and protection notifications<br />
Emotionally abused 4,592 6,142 8,256 8,664 1,0938<br />
Physically abused 2,351 2,336 2,274 2,321 2,856<br />
Sexually abused 1,424 1,291 1,194 1,003 1,126<br />
Neglected 4,074 4,199 4,486 4,302 4,677<br />
Behavioural/relationship<br />
difficulties<br />
4,355 4,657 4,461 4,154 4,256<br />
Self-harm/suicidal 173 172 138 116 106<br />
Not found 23,388 26,011 22,921 19,334 25,486<br />
Total findings from<br />
investigation<br />
40,357 44,808 43,730 39,894 49,444<br />
New Zealand’s comparative position internationally is reflected in Table 10.2 and Figure 10.1, showing<br />
intentional and accidental injury to children across the OECD countries (OECD, 2011a). This data<br />
relates to both intentional and accidental deaths of children. The OECD (2011) notes that not all<br />
accidental injuries are the result of maltreatment. The numbers are not large, so small changes affect<br />
the figures; nevertheless, New Zealand is one of the few countries where the number of children<br />
dying of intentional injury has increased over this period.<br />
Figure 10.1. Changes in child deaths due to intentional injury, early 1980s to latest figures,<br />
average deaths per 100,000 children aged 0–14 (Source: OECD (2011), p. 249)<br />
While there has been some decline in relation to accidental injuries, New Zealand’s figures are still<br />
significantly above those in most other OECD countries.<br />
Economic work undertaken for Every <strong>Child</strong> Counts in 2008 found that the cost of child abuse and<br />
neglect amounted to NZ$2b. This figure was calculated on the basis of the direct costs of health care<br />
and child welfare services; ongoing costs related to long-run health and crime impacts; and also the<br />
indirect cost of lost productivity (Infometrics, 2010). While precise calculation of costs in this area is<br />
difficult, the detailed work in this report gives a clear indication of the scope of the economic costs of<br />
child abuse and neglect in New Zealand.<br />
107
<strong>Poverty</strong> and violence<br />
International Overviews<br />
UNICEF’s (2003a, p.13) cross-nation study found that, while ethnic minorities often have higher<br />
levels of child maltreatment, “it seems likely that the operative factor is not ethnicity but poverty<br />
(which disproportionately affects ethnic minority families)”. In the course of the discussion on poverty<br />
and child deaths, they draw attention to the close interrelationships between poverty, unemployment,<br />
poor mental health (including addictions), being young and being the victim of violence and offending.<br />
The recent OECD report (2011, p. 251) on the well-being of children reviews evidence about the<br />
linkages between economic indicators and child maltreatment, noting that while establishing causality<br />
is difficult, the data is “suggestive of at least some linkage between economic domains and child<br />
maltreatment at a country level”. This relationship is stronger in relation to income inequality and<br />
accidental child mortality; the relationship is lower for intentional child death.<br />
Moving more broadly into the relationship between income and what the report describes as “child<br />
maltreatment”, the report begins by saying:<br />
there is considerable evidence, at the micro level of a child’s family, that low income is significantly<br />
correlated with child abuse and neglect (OECD, 2011, p. 253).<br />
They suggest that the causal link between the two might come from the following factors: the ways<br />
in which low income restricts ability to meet children’s basic needs; the links between low income<br />
and parental stress and depression; low income leading to lower returns on investment in children;<br />
a smaller number of disciplinary options for low income households because of lack of financial<br />
resources; and links between what they describe as “maltreatment related behaviours” and transfer<br />
payments: if maltreatment means that they risk losing children and thus income via child removal,<br />
parents should be less likely to maltreat their children (OECD, 2011, p. 253).<br />
While acknowledging the difficulties in establishing the nature and strength of the causal links, the<br />
OECD report notes that three American studies provide evidence that the low income–maltreatment<br />
link may be causal. The third of these studies:<br />
provides the strongest evidence to date in support of a causal link between family income and<br />
child maltreatment (OECD, 2011, p. 255).<br />
The OECD suggests that causal issues might be affected by such factors as: limited parental<br />
education; poor quality jobs; substance abuse; child behavioural problems; and mental health<br />
issues. Such issues affect both parental income and child maltreatment (OECD, 2011, p. 254). They<br />
conclude:<br />
A large number of studies has been conducted on the determinants of maltreatment. Results<br />
point to economic resources playing an important role in influencing risk for child abuse and<br />
(particularly) child neglect. However, conclusive causal evidence has been elusive. But the<br />
evidence that maltreatment imposes large long-term costs both to the children involved and to<br />
society is clear (OECD, 2011, p.263).<br />
108
International Studies<br />
There are a number of international studies which reflect the significance of poverty as an important<br />
factor in child abuse, child maltreatment and child neglect. For example, Wilkinson and Pickett<br />
(2010, p.111) demonstrate the links between inequality and violence, including child abuse. While<br />
acknowledging the difficulties of causality and the linkages between poverty and a range of other<br />
family, personal and structural disadvantages, the relationship is neatly reflected by Stevenson’s<br />
comment that “poverty is one in a complex web of factors” (Stevenson, 1998, p.21). Other reports<br />
have been more specific, a US report on primary prevention of child abuse stating that the<br />
high poverty rate is the single best predictor of child abuse and neglect….Stressors such as<br />
unemployment, single parenthood, limited access to health care, housing instability and exposure<br />
to environmental hazards contribute to neglect (www.exmaxhealth.com).<br />
Drucker (1997) goes further in his discussion of the consequences of poverty and child maltreatment<br />
on IQ scores:<br />
over the last 25 years nearly all studies of poverty have noted the correlation between poverty<br />
and child abuse. Although child abuse is not caused by poverty, it seems to be intricately linked.<br />
Clinical studies of child abuse and neglect have shown that poor families are more likely than<br />
those with more economic resources to be identified and labelled as maltreating.<br />
In a related vein, Lee and Goerge (2009, p.755) found that maternal age and poverty are each<br />
strong predictors of a substantiated report of all types of maltreatment, “even after controlling for<br />
other sociodemographic variables”. In addition, in his report on the results of two surveys of family<br />
violence based on structured interviews with heads of households representing a sample of the US<br />
population, Gelles (1992, p.263) found that<br />
violence towards children, especially severe violence, is more likely to occur in households with<br />
annual incomes below the poverty line.<br />
The links between poverty and other stresses such as unemployment, poor housing and mental<br />
health issues is also taken up by Frederrick and Goddard (2007, p.324):<br />
one of the main factors identified in terms of risk of child abuse is family poverty with evidence<br />
of a relationship between neglect and poverty. Clearly the stresses of living in poverty, the lack<br />
of choices available and limited material supports present considerable challenges for families<br />
raising children.<br />
As has been frequently observed, poverty creates stress. This stress has an important effect on<br />
parental ability to respond appropriately to children. Besharov and Laumann (1997) argue that<br />
poverty and the associated personal and family disadvantages can weaken parents’ own sense<br />
of their strengths and effectiveness and reduce their sense of control. Russell et al. (2008, p. 83)<br />
suggest:<br />
In some instances the multiple vulnerabilities or risks may place parents in situations where<br />
providing sufficient care and protection of their children becomes virtually impossible.<br />
109
While noting that (1) abuse occurs across all socio-economic groups and (2) most parents living in<br />
poverty do not abuse or neglect their children, a review of the evidence by the National Society for<br />
the Prevention of Cruelty to <strong>Child</strong>ren (NSPCC) (2008, p.1) in the United Kingdom went on to say that:<br />
research shows that children who grow up in poverty can be more vulnerable to some forms<br />
of maltreatment, particularly neglect and physical abuse. They also have an increased risk of<br />
adverse experiences and negative outcomes, both in the short and long term.<br />
These outcomes extend across health, education, being victims of crime and unemployment.<br />
<strong>Poverty</strong> and maltreatment, NSPCC (2008, p.1) observes, means that these children are doubly<br />
disadvantaged “because the experience of maltreatment may in turn further undermine life chances<br />
in the long term”. This longer term relationship is reflected in the Australian study discussed below.<br />
Echoing the studies previously referenced, the NSPCC draws out the links between poverty and a<br />
range of other sources of disadvantage and deprivation; moreover, the greater the deprivation, the<br />
greater the risk of maltreatment. NSPCC (2008, p.3) summarise their findings as follows:<br />
This study therefore confirmed the association between socio-economic status, financial problems<br />
in the family and parental child maltreatment.<br />
The relationship is more apparent in relation to physical and emotional maltreatment than in relation<br />
to sexual abuse. Significantly, NSPCC note, too, that those working in unskilled or semi-skilled jobs<br />
were more likely to have experienced serious physical abuse than those working in professional<br />
occupations.<br />
As others have done, NSPCC also reported a strong correlation between poverty and neglect. Of<br />
course, this does not mean that poverty causes neglect; rather, it points to an important link between<br />
the two and to the stresses on families and communities created by poverty. NSPCC’s quotation from<br />
Minty’s work captures this connection well:<br />
it could well be that chronic poverty plays a part in many instances of physical child neglect<br />
by possibly reducing morale, or by increasing a sense of general hopelessness and passivity<br />
(National Society for the Prevention of Cruelty to <strong>Child</strong>ren, 2008, p.7).<br />
The linkages between poverty and child abuse are not limited to children’s own experiences. Evans<br />
(2005) interviewed a sample of Australian people receiving emergency relief; the participants<br />
were interviewed about their own early experiences, many of them reporting violence and abuse<br />
as children. Her conclusion is significant for a broader understanding of the relationship between<br />
poverty and abuse:<br />
adverse childhood experiences, for the majority of these interviewees, are seen as significant<br />
contributors to poverty outcomes in later life. Consequently, interventions which provide support<br />
for children dealing with experiences of abuse and adversity may result in prevention of poverty in<br />
their adult lives....In turn, it may be that child abuse and adversity in childhood are factors in the<br />
complex origins of poverty in adulthood (Evans, 2005, p. 335).<br />
Turning, then to the New Zealand material, there are no New Zealand studies specifically focused on<br />
the relationship between poverty and child abuse and neglect. However, in its review of children at<br />
risk of death as a result of maltreatment, the report from <strong>Child</strong> Youth and Family and the Ministry of<br />
Social Development (2006, p.3) summarises the available evidence as follows:<br />
110
a range of cross-national studies show that child death from maltreatment occurs predominantly<br />
in the context of poverty, psychological stress and limited support, while child murders (defined<br />
as a wilful act to kill the child) occur across the spectrum of socioeconomic status, including highincome<br />
groups.<br />
In their review of the work on child death, Connolly and Doolan (2007) identify poverty as one of the<br />
characteristics associated with perpetrators of child homicide. While poverty is one of a range of<br />
considerations, it is identified as an important factor. Their subsequent, broader framework developed<br />
for understanding a range of factors associated with building family resilience includes “growing up in<br />
poverty” as an important childhood vulnerability (Connolly and Doolan, 2007, p. 113).<br />
Similarly, the Taskforce For <strong>Action</strong> On Violence Within Families (Ministry of Social Development,<br />
2006c) identifies poverty as an important issue in violence generally (not just in relation to child<br />
abuse); and they argue that reducing poverty is an important component of a comprehensive<br />
approach to reducing levels of violence.<br />
Implications and Recommendations<br />
Most of the discussion in New Zealand about abuse and neglect has focused on the behaviour of<br />
individual carers. A wider discussion and analysis would include consideration of, and attention to,<br />
the significance of economic, income and poverty factors. Separating the effects of poverty from<br />
associated family circumstances such as unemployment, health pressures, and inadequate housing<br />
as important considerations around questions of abuse and neglect is extremely difficult. It is equally<br />
difficult to trace a simple causal connection. However, that does not negate the existence of a link.<br />
In the New Zealand context, much of the response to issues of poverty, neglect and abuse has<br />
framed it as an individual problem with the blame on individual behaviour. Russell et al. (2008, p.83)<br />
argue that this has also been the response in the American context, rather than defining poverty “as<br />
perpetuated by socio-economic arrangements that promote inequality and social isolation”. Both<br />
countries have an equally strong focus on the behaviour of individual parents as the cause.<br />
Russell et al. (2008, p. 86) observe that “<strong>Poverty</strong> is the common thread uniting families identified<br />
by child protection services as being at high risk for neglect and abuse”. There is no New Zealand<br />
research around this question, but practice experience in the social services would certainly suggest<br />
there is, at least, a strong connection. The focus in New Zealand has too often been on issues of<br />
ethnicity, but as the UNICEF (2003b, p. 13) report observes:<br />
it seems likely that operative factor is not ethnicity but poverty (which disproportionately affects<br />
ethnic minority families).<br />
Russell et al. (2008, p. 87) go on to demonstrate that the views, aspirations, needs and experiences<br />
of poor parents have been ignored in establishing what parents need from the social services, despite<br />
the fact that “the common experience was one of economic deprivation and depression”.<br />
Money matters, and while reducing poverty will not eliminate abuse and neglect, it will make a<br />
significant difference. This requires moving beyond the privatisation of poverty and beyond blaming<br />
parents, the response which too commonly occurs in discussions about child poverty. To quote<br />
Russell et al. (2008, p. 93):<br />
The consistency with which poor parents across time and across continents identify financial<br />
hardship as a barrier to effective parenting is considerable, but not surprising.<br />
111
This requires a broad approach to the needs of children and the prioritising of the most vulnerable<br />
children. However, prioritising cannot mean individual responses. As the UNICEF (2003, p. 21) report<br />
concludes:<br />
experience would suggest that no national strategy to prevent or reduce the maltreatment of<br />
children will achieve major gains without addressing the question of economic poverty, which …<br />
is the close companion of physical abuse and neglect.<br />
For some families, effective assistance will require long-term, comprehensive and holistic support if<br />
the lives of all children are to be advanced and improved and if we are to ensure that all children have<br />
the opportunities to grow and develop to the best of their abilities. The critical question is whether as<br />
a society we are really committed to children’s well-being. As Kammerman (2000, p.626) concluded:<br />
In the end, it is simply a matter of priorities and values.<br />
Recommendations<br />
• Locate the best interests of children at the centre of programmes and services for children and<br />
families faced with issues of violence and child abuse;<br />
• Include an understanding of the significance of poverty in the context of child abuse, and adopt a<br />
comprehensive and holistic approach to child abuse and violence towards children;<br />
• Provide comprehensive and sustained services to ensure long-term improvement for children in<br />
severely disadvantaged and deprived families;<br />
• Wherever possible, considering the best interests of the child, treat parents as active partners in<br />
the development of effective services;<br />
• The small number of children who are unable to be provided for adequately and appropriately by<br />
their parents are especially at risk and require particular attention and priority for their protection<br />
and their effective development.<br />
112
Appendix. Physical Punishment of children and Section 59<br />
Beth Wood 68<br />
In 2007, after two years of very intense public and political debate, section 59 of the Crimes Act 1961<br />
was repealed and the use of force for the correction of children became illegal. 69 The new law that<br />
amends section 59 is clear in its prohibition of the use of force for correction. The law is less clear<br />
about the nature of force that can be used to a restrain a child in certain circumstances (Hornibrook,<br />
2008). New Zealand now has a law that is congruent with children’s rights to physical integrity<br />
and protection from violence, with research findings that clearly indicate that physical correction is<br />
associated with a range of poor outcomes for children (A.B. Smith, 2005) and with contemporary<br />
efforts to promote positive parenting and reduce family violence. A number of factors contributed<br />
to the law change coming about when it did. These include: chance (MP Sue Bradford’s private bill<br />
being pulled from the ballot), the political leadership shown by Sue Bradford and the then Prime<br />
Minister, Helen Clark, and the Labour Party, and eventually the present Prime Minister, John Key and<br />
the efforts of a great number of child advocates across professions who supported change (Wood,<br />
et al., 2008).<br />
The general public have been deeply divided about the law change with many still convinced of<br />
the efficacy of physical punishment and their perceived right to treat their children as they wish and<br />
in addition being resentful of being told how they should behave. Strenuous efforts on the part of<br />
conservative groups led to a non-binding postal referendum held in 2009 on the confusing question<br />
“Should a smack as part of good parental correction be a criminal offence in New Zealand?” Voter<br />
response rate was low but the majority of those who did respond voted “no”. 70 This result cannot be<br />
regarded as an accurate reflection of New Zealanders’ attitudes to the new law or the use of physical<br />
punishment of children. Because the only monitoring of the implementation of the law that is currently<br />
happening is focused on whether parents are being unfairly or unnecessarily investigated and/or<br />
prosecuted for minor use of force with children we have no current information about public attitudes<br />
towards the law and the use of physical punishment. Results from a survey conducted in 2008<br />
showed encouraging trends (<strong>Child</strong>ren’s Commissioner, 2008). Regular reports on the application<br />
of the law by Police (New Zealand Police, 2010) and two reviews (Ministry of Social Development,<br />
2009a, 2009b) have found that the law is being implemented sensitively and sensibly with very few<br />
prosecutions taking place for minor infringements of the law.<br />
68 Beth Wood is Advocacy Manager for UNICEF New Zealand and a spokesperson for EPOCH New Zealand. For over<br />
10 years she has campaigned to discourage the use of physical punishment and reduce violence to children. Beth’s<br />
background is in social work, social policy and advocacy.<br />
69 For a full history of law change in New Zealand see, Wood, Hassall, Hook, and Ludbrook (2008).<br />
70 For further information on 2009 referendum visit www.YesVote.org.nz<br />
113
Chapter 11. Families, <strong>Child</strong>ren, and the Law<br />
Catriona MacLennan 71 and Frances Joychild 72<br />
Introduction<br />
<strong>Child</strong>ren have not been well served under New Zealand’s social policies and legislation. This chapter<br />
outlines the state’s obligations and duties toward children under laws and conventions<br />
that are, and are not, being complied with, and looks at some of the consequences.<br />
United Nations Convention on the Rights of the <strong>Child</strong><br />
In 1993 New Zealand ratified the United Nations Convention on the Rights of<br />
the <strong>Child</strong> (UNCROC) (United Nations, 1989). This sets out the civil, political,<br />
social, economic, health and cultural rights of people under the age of 18. While<br />
signatories agree to “undertake all appropriate legislative, administrative and other<br />
measures to implement the rights recognised in the convention”, New Zealand<br />
made three reservations when it ratified UNCROC. 73 After 18 years, the three reservations remain:<br />
• allowing a distinction between children according to their immigration status. Effectively this<br />
means that the children of overstayers and some asylum seekers have no right to education,<br />
health and welfare services.<br />
• not specifying a minimum age of children to commence employment or regulating the hours and<br />
working conditions for those under 18 years old.<br />
• enabling children to be detained in police stations and other adult facilities, when no youth beds<br />
are available. This means that the practice of children being detained alongside adults continues.<br />
New Zealand’s failure to comply with its obligations<br />
The United Nations Committee on the Rights of the <strong>Child</strong> has reviewed New Zealand’s progress<br />
towards compliance with the convention on three occasions over the past 18 years. 74 The Committee’s<br />
2011 concluding observations recorded deep regret that New Zealand has not yet withdrawn its<br />
reservations to the convention (United Nations Committee on the Rights of the <strong>Child</strong>, 2011).<br />
The Committee criticised this country’s lack of progress on compliance. It urged New Zealand to<br />
take all necessary measures to implement the recommendations previously made in the committee’s<br />
2003 findings, noting New Zealand’s failure to make sufficient progress in relation to co-ordination,<br />
non-discrimination, abuse, neglect, child labour and juvenile justice. It recommended that all childrelated<br />
legislation be a priority for Parliament.<br />
The Committee also urged New Zealand to establish a permanent mechanism to ensure high-level and<br />
effective co-ordination of the implementation of the convention, noting that increases in expenditure<br />
on children in recent years were insufficient to eradicate poverty and address inequalities. It suggested<br />
initiation of a child budgeting exercise to allow strategic allocations to implement children’s rights and<br />
later evaluation of them.<br />
71 Catriona MacLennan is a South Auckland barrister and also writes on legal and social justice issues.<br />
72 Frances Joychild is a Barrister in Auckland with a speciality in human rights legal issues.<br />
73 Reservations mean that a nation advises the United Nations that it is unwilling or unable to comply with aspects of the<br />
convention. Reservations may be either general or specific.<br />
74 In 1997, 2003 and 2011, and Ludbrook (2010).<br />
114
Other recommendations included that steps be taken to:<br />
• ensure that the business sector complied with international and domestic standards on corporate<br />
social responsibility, particularly with regard to respecting children’s rights;<br />
• urgently address disparities in access to services by Māori children and their families together<br />
with affirmative action if necessary for the benefit of children in vulnerable situations;<br />
• promote the principle of respect for the views of children and systematic consideration of children’s<br />
perspectives in formulating laws, policies and in judicial proceedings;<br />
• prioritise the elimination of all forms of violence against children;<br />
• make greater efforts to assist parents and guardians with child-rearing responsibilities;<br />
• establish mechanisms for monitoring the number of cases of violence, sexual abuse and neglect;<br />
• strengthen support for victims and providing access to adequate services for recovery and<br />
counselling;<br />
• take all necessary measures to enable disadvantaged families and their children to move out of<br />
poverty in a sustained way;<br />
• require children’s consent to adoptions and lowering to at least 18 years the age at which adopted<br />
children can access their files.<br />
The care of children<br />
Two pieces of domestic legislation deal specifically with the care of children in New Zealand.<br />
<strong>Child</strong>ren, Young Persons and Their Families Act 1989<br />
The paramount consideration under this Act (s 6), is the welfare and best interests of the children.<br />
Another guiding principle for exercise of powers (s 5) is that consideration is given to the wishes of<br />
the child or young person. The Act legislates a regime for dealing with the care of children. Its object<br />
is to promote the well-being of children, young persons and their families and family groups by<br />
establishing and promoting services within the community to advance the well-being of children and<br />
assist parents and whānau groups to discharge their responsibilities to prevent their children from<br />
suffering harm, ill-treatment, abuse, neglect or deprivation.<br />
Care of <strong>Child</strong>ren Act 2004<br />
This Act governs the care and guardianship of children. Its aim is to “promote children’s welfare and<br />
best interests, and facilitate their development” by ensuring that appropriate arrangements are in<br />
place for their guardianship and care. The other purpose of the legislation is to “recognise certain<br />
rights of children” (s 3). Section 4 provides that the welfare and best interests of the child must be the<br />
“first and paramount consideration” in the administration and application of the Act and in any other<br />
proceedings involving the guardianship of, or the role of providing day-to-day care for, or contact<br />
with, children.<br />
In practice, in decisions made under these two pieces of legislation, the government does not make<br />
the welfare and best interests of children the paramount considerations, primarily because it fails<br />
to make adequate resources available to the Family Court and the Department of <strong>Child</strong>, Youth and<br />
115
Family to properly carry out their responsibilities. 75 This results in long delays in investigating, hearing<br />
and finalizing cases relating to children, with staff routinely stressed and overworked (D. Joyce,<br />
2010a, 2010b).<br />
<strong>Child</strong>ren and Immigration<br />
New Zealand has long-standing obligations under international conventions to place the best interests<br />
of the child at the centre of immigration decisions, yet twice in recent years the country’s most senior<br />
court has found the government’s policies to be wanting in that insufficient weight has been given to<br />
the interests of the child.<br />
Tavita v Minister of Immigration [1994] 2 NZLR 257<br />
After Mr Tavita’s application in 1993 for permanent residency was declined and a removal order was<br />
issued, he sought an interim order preserving his position and those of his wife and children, and an order<br />
quashing the removal order and requiring the Minister of Immigration to issue a permit to enable him to<br />
remain in New Zealand. If he were forced to return to Samoa, he would lose contact with his daughter;<br />
and would have no means of supporting his wife and daughter. A consultant paediatrician confirmed the<br />
importance of the close bond between Mr Tavita and his daughter and stated that separating them would<br />
be counter to the principles in the <strong>Child</strong>ren, Young Persons and Their Families Act. The Crown accepted<br />
that the Associate Minister and the Department had not considered the international instruments in making<br />
their decision, but nor were they required to. The Court of Appeal said there was a need for a balancing<br />
exercise and the basic rights of the family and the child were the starting point. Justice Cooke described<br />
as “unattractive” the Crown’s argument that the Minister and the Department were entitled to ignore the<br />
international instruments as it seemed to imply that adherence to the international instruments had been at<br />
least partly window-dressing.<br />
Article 9 (1) of the International Covenant on Civil and Political Rights 1966 (ICCPR) which New<br />
Zealand ratified in 1978 provides that countries “shall ensure that a child shall not be separated from<br />
his or her parents against their will, except when competent authorities subject to judicial review<br />
determine, in accordance with applicable law and procedures, that such separation is necessary for<br />
the best interests of the child.”<br />
Article 3 (1) of UNCROC provides “In all actions concerning children, whether undertaken by public<br />
or private social welfare institutions, courts of law, administrative authorities or legislative bodies, the<br />
best interests of the child shall be a primary consideration.”<br />
Following the case, the New Zealand Immigration Service introduced a humanitarian interview<br />
procedure to ensure the international obligations were observed. Immigration officers are made to<br />
go through a three-part standard questionnaire to obtain additional personal information to enable<br />
removal decisions to be made in accordance with New Zealand’s international human rights<br />
obligations. Stage three includes references to family circumstances and the interests of any children<br />
involved.<br />
In 2005 the New Zealand government changed the law to provide that children born in New Zealand<br />
did not automatically become New Zealand citizens at birth. That law change took effect on 1 January<br />
2006. An updated Immigration Act was passed in 2009, most sections of which took effect on 29<br />
November 2010.<br />
75 The Independent Police Complaints Authority reported in February this year on serious delays in investigating claims of<br />
alleged child abuse in the Wairarapa since 2006 and systemic problems in the handling of such files with senior police<br />
implicated in covering up the numbers.<br />
116
Ye & Ors v Minister of Immigration & Anor [2009] NZSC 76<br />
In this case, the Supreme Court found the Immigration Department had made a fundamental legal flaw in<br />
its design of the humanitarian interview questionnaire. Under s 47(3) appeals could only be brought on the<br />
grounds that there were “exceptional circumstances of a humanitarian nature that would make it unjust<br />
or unduly harsh for the person to be removed from New Zealand, and that it would not be contrary to the<br />
public interest to allow the person to remain in New Zealand”. The questionnaire did not direct the official’s<br />
mind to this provision when considering the issue of the interests of the child. On this ground, the Court set<br />
aside the decision to remove the Ye parents.<br />
The unsatisfactory way in which immigration decisions relating to children continue to be dealt with<br />
in New Zealand is well illustrated by the 2010 case where both parents of three New Zealandcitizen<br />
children, an eight–year-old and two six-year-old twins who had lived in New Zealand all their<br />
lives were being deported. The children would go with their parents to live in a slum in Jalandhar<br />
in India, where they would be subject to caste discrimination, without rights to attend school or<br />
use hospitals, sharing a house with no sanitation or showers with three other families. Eventually,<br />
Associate Immigration Minister Kate Wilkinson granted the parents 12-month work visas, meaning<br />
they could remain in New Zealand. 76 The family’s Immigration Consultant, Tuariki Delamere, said<br />
media pressure had saved the family from being sent to India (Delamere, 2011, p. 8).<br />
It is completely unsatisfactory that children’s futures should be determined by pressure brought<br />
through media attention, rather than through an application of legal principles that places proper<br />
weight on the welfare and interests of the child.<br />
<strong>Child</strong>ren in Detention<br />
<strong>Child</strong>ren charged with offences in New Zealand are routinely detained in police cells along with<br />
adult detainees, as there are not enough beds for them in residences established under s 364 of the<br />
<strong>Child</strong>ren, Young Persons and Their Families Act. In 2009, 77 young people were detained in police<br />
cells for an average duration of 1.9 days. In 2010, the Commissioner for <strong>Child</strong>ren reported that, while<br />
there has been a decline in the actual number of young people detained and the average length of<br />
time they spend in cells, the average of 48 hours is unlikely to decrease (<strong>Child</strong>ren’s Commissioner,<br />
2010).<br />
The <strong>Child</strong>ren, Young Persons and Their Families (Youth Courts Jurisdiction and Orders) Amendment<br />
Act 2010 extended the Youth Court’s age jurisdiction from 14 to 12 years, creating the potential for<br />
12- and 13-year-olds to be detained in cells with adults. The grave danger of incarcerating children<br />
with adults is well known, and is contrary to children’s rights under the convention. We join with the<br />
Human Rights Commission (2010a) in urging that New Zealand’s reservation be removed and steps<br />
taken to ensure this practice stopped.<br />
76 The United Kingdom court has also recently confirmed an obligation on immigration officials to have regard to the need<br />
to safeguard and promote the welfare of children when it was making decisions: ZH (Tanzania) v Secretary of State for<br />
the Home Department [2011] UKSC 4. A woman had arrived from Tanzania in 1995 and was being deported after three<br />
unsuccessful asylum attempts. During that time, in a relationship with a British citizen, she had two children, both of<br />
whom were British citizens. The parents were separated. The father had HIV, lived on a disability allowance, and was<br />
reported to drink a lot. Eventually the Secretary of State conceded that it would be disproportionate to remove the mother<br />
from Britain. However, the case went to the Supreme Court on the issues of the general principles to be applied in such<br />
instances.<br />
117
<strong>Child</strong>ren and Domestic Violence<br />
Domestic violence in New Zealand accounts for 39% of all homicides, 42% of all kidnappings and<br />
abductions, 44% of all grievous assaults, 64% of all serious assaults, and 34% of minor assaults<br />
identified as family violence (Wellington Women’s Refuge, 2011). The Domestic Violence Act 1995<br />
aims to “provide greater protection from domestic violence”. The objects of the Act (s 5) are to<br />
reduce and prevent domestic violence in relationships by recognising that domestic violence in all its<br />
forms is unacceptable behaviour, and by ensuring that there is effective legal protection for victims.<br />
The act aims to achieve its objects (s 5,ss 2) by empowering the court to make orders to protect<br />
domestic violence victims; ensuring that access to the court is as speedy, inexpensive and simple<br />
as is consistent with justice; and providing appropriate programmes for domestic violence victims.<br />
Domestic violence includes psychological abuse of children (s 3) by allowing them to see or hear the<br />
physical, sexual or psychological abuse of a person with whom the child has a domestic relationship.<br />
However, governments have been slow to offer protection and support to child witnesses and victims<br />
of domestic violence. The Domestic Violence Act 1995 provides for counselling for perpetrators and<br />
victims of domestic violence, but in practice children’s programmes have been the last programmes<br />
to be provided.<br />
Despite the laudable objects and policy behind the domestic violence legislation, far too little is<br />
done to provide support for domestic violence victims seeking to leave violent relationships, or<br />
to provide safe accommodation and long-term support for them and their children to begin new<br />
lives. Women’s Refuges in New Zealand lack secure and adequate funding and are chronically<br />
overcrowded. <strong>Child</strong>ren suffer huge stress and disruption when they and their mothers have to leave<br />
their home and go to a refuge. They also have their education interrupted. Adequate resources<br />
could and should be provided to ensure that women and children are safe in their homes and can<br />
remain there, for example, through providing permanent funding for Auckland-based family violence<br />
prevention agency Shine’s safe@home project. 77 The increased security means that women and<br />
children not only are safer, but feel that they are safer. The women and children can therefore remain<br />
in their homes, which is immensely valuable in trying to provide continuity for children at an extremely<br />
stressful time.<br />
<strong>Child</strong>ren with Parents on Social security Benefits<br />
Of all New Zealand children, 22% live in families where the parents receive their income from a social<br />
security benefit (Johnson, 2011b). As indicated elsewhere, benefit levels are woefully inadequate to<br />
provide these children with adequate standards of living to meet their basic needs. Recent major<br />
government initiatives were implemented to alleviate child poverty by injecting significant funding<br />
into families with children on low incomes who meet a work test of 30 hours in paid employment.<br />
However, children whose parents were in the lowest income category, in receipt of benefits, have<br />
been excluded.<br />
77 Safe@home was successfully piloted for two years in Auckland’s western suburbs but has no permanent funding, and no<br />
money to implement the initiative throughout Auckland and around the rest of New Zealand. It provides security upgrades<br />
to the homes of those assessed as being at the most extreme risk of serious injury or death from domestic violence:<br />
replacing glass doors with solid doors; installing deadlocks, peepholes and door restricters; fitting security lights; and<br />
fitting burglar and smoke alarms as domestic violence victims may be at risk of having their homes burnt down. Victims<br />
are provided with handheld personal alarms to immediately summon assistance.<br />
118
Thus 22% of our country’s children are condemned to endure all the negative consequences of<br />
poverty, and they must also contend with their parents being subjected to a hostile and punitive social<br />
security system.<br />
Benefit debt creation – being found not to have been entitled to a benefit<br />
Sometimes a beneficiary is overpaid because of a departmental mistake of which the beneficiary<br />
is unaware. When this overpayment is picked up, WINZ establish an overpayment against the<br />
beneficiary. Money is regularly deducted from their already low level of benefit until the whole<br />
overpayment is repaid. This can take years and cuts deeply into the family’s already straitened<br />
circumstances.<br />
Sometimes beneficiaries fall foul of the relationship rule. This particularly affects women on the<br />
Domestic Purposes Benefit (DPB) who have no other financial support to raise their children. They<br />
may begin a relationship which is far from committed that has some financial intermingling though<br />
no financial dependence. Alternatively, they may be trying to end a relationship but still have regular<br />
contact and some interconnectedness with the father who parents the children. The beneficiary may<br />
not consider this a relationship, particularly if they pay all the children’s outgoings and the family<br />
costs of living from the DPB. Nevertheless an official may deem this a relationship and set a date<br />
from when the beneficiary was not entitled to the benefit. An overpayment is established against the<br />
beneficiary and the entire benefit from that time on must be repaid.<br />
Criminal proceedings against beneficiaries for fraud<br />
Sometimes after an investigation into a relationship, the beneficiary will be prosecuted for ‘benefit<br />
fraud’ on the basis they knowingly tried to hide their relationship from the Department so as to retain<br />
eligibility for the benefit.<br />
Beneficiaries who are charged with benefit fraud are charged under the Crimes Act 1961 with<br />
fraudulently using a document to obtain a pecuniary advantage (s 229A) and under the Social<br />
Security Act 1964 with wilful omission to supply material particulars (s 127). If convicted, the penalty<br />
depends largely on the amount of money involved. If it is a smaller figure they may receive a fine<br />
or community work, but if the sum involved is over about $30,000 the court will consider imposing a<br />
custodial sentence.<br />
In typical fraud sentencing cases, the judge decides the sentence taking all factors into account,<br />
including any reparation the offender might be paying to make up for their crime. Prior to 1999,<br />
prosecutors for benefit fraud asked the court to impose a sentence that included a reparation order<br />
against a convicted beneficiary; that is, the beneficiary had to repay the benefit money to the victim<br />
(the state). In 1999 the Court of Appeal criticized the courts for imposing large amounts of reparation<br />
against a beneficiary where there was no realistic prospect of payment being made within a very few<br />
years. It said this was inappropriate and an order should not be made, at least for the full amount. 78<br />
Prosecutors now do not seek reparation at sentence, hence the judge sentences on the basis no<br />
reparation is being paid. That leaves no room for a discount in sentence because of reparation. If the<br />
beneficiary is sentenced to jail she receives no discount in sentence. Nevertheless after completing<br />
the sentence the Department still pursues the beneficiary for the full amount of the overpayment,<br />
making deductions into the benefit which in some cases will be for the life of the beneficiary and<br />
78 Justices Richardson and Blanchard. In the case of Isabella Ruka $x had been ordered.<br />
119
eyond. The beneficiary has therefore received a larger penalty than others who have been convicted<br />
of fraud.<br />
People who have no hope of repaying a civil debt have the option of entering into the No Asset<br />
Procedure or bankruptcy proceedings. But debts to the Crown are not extinguished by bankruptcy<br />
proceedings. While debts incurred by fraud are also not extinguished by bankruptcy, it is most common<br />
for settlements of debt to be reached and an end to the debt for the debtor. Not so beneficiaries<br />
whose debts can be millstones around their necks for life.<br />
Perhaps even more disturbing, children whose mothers are found to have committed ‘benefit fraud’<br />
over $30,000 (being in a relationship for two to three years or more) are typically imprisoned, despite<br />
their having emotionally vulnerable dependants. <strong>Child</strong>ren who have lived through the stress of their<br />
parent’s investigation and prosecution then suffer the trauma of having their mother removed from<br />
them and the family broken up.<br />
Osborne v Chief Executive of Ministry of Social Development 2009<br />
This High Court case considered in detail issues relating to recovery of overpayments of the DPB. Linda<br />
Osborne was convicted of 17 charges under s 229A of the Crimes Act and sentenced to 3½ years’ jail.<br />
When she came out of jail, she and her partner were granted an unemployment benefit. WINZ advised that<br />
it would deduct $20 a week from her benefit as repayments on the debt for which she had been jailed. She<br />
challenged that decision at a Benefit Review Committee and later in the courts. The High Court affirmed the<br />
Benefit Review Committee’s decision that criminal proceedings did not preclude the civil recovery of money.<br />
S 38(2) of the Sentencing Act made it clear that victims were not precluded from obtaining additional relief<br />
through other proceedings available to them. The fact that it would take Ms Osborne 332 years to repay<br />
the debt was not relevant. The High Court emphasised the importance of the Chief Executive’s obligations<br />
under the Public Finance Act.<br />
Seeking to recover tens of thousands of dollars from the poorest people in our community is<br />
incompatible with the purposes of making families independent of the state. Debt enforcement traps<br />
the children and their parents in a poverty cycle they have no hope of escaping. While the parent<br />
remains on a benefit the Ministry might typically take $20 a week from her for repayment of the debt.<br />
This is a huge sum to a beneficiary and means in practice that the children will be penalized and<br />
not provided with the food, clothing, or access they need to participate fully at school and in their<br />
community. If the parent can get paid work, the debt repayment deducted each week will immediately<br />
be increased so the family will overall be no better off financially. If the debt is above a certain level,<br />
there is no realistic prospect that she will be able to repay it in her lifetime, even if she is working. This<br />
is a crushing additional burden to place on a very low-income family under stress; more so when the<br />
mother has already served a jail sentence to pay for her crime.<br />
The other partner in the fraud<br />
It is disturbing that the Department rarely takes action against men who have been in relationships<br />
with the mother and had use of the benefit money received in her name, particularly as it is common<br />
that fraud investigations are commenced by him ‘dobbing in’ his former partner after the relationship<br />
has ended. It can be said that by not pursuing the man the Department is complicit in his use of<br />
money he was not entitled to.<br />
Department history of legal errors and beneficiary inability to challenge decisions<br />
The punitive approach is particularly surprising given the recent history in New Zealand of WINZ<br />
120
applying incorrect law in its benefit fraud investigations in determining whether the beneficiary was<br />
in a relationship in the nature of a marriage for benefit purposes. Consequently, WINZ had to cancel<br />
$35 million in debt it had laid against beneficiaries (Joychild, 2010). In another case the Courts<br />
held that the Department was not applying the correct law in relation to special benefits and many<br />
beneficiaries had not received the special benefit to which they were entitled.<br />
Beneficiaries cannot afford lawyers to challenge decisions made by the Department against them.<br />
Yet social security legislation and practice is complex and confusing. Contradictory and inaccurate<br />
computer-generated letters can flood into a beneficiary’s home, some of them threatening to cut off<br />
the benefit, or advising it has been cut, causing anxiety and distress, when the beneficiary has done<br />
everything asked of them. Beneficiaries are typically reliant on voluntary advocates, whose coverage<br />
is sparse and patchy, to challenge the Department. Benefit Review Committees are not independent<br />
of the Department and often act as a rubber stamp.<br />
Section 86 of the Social Security Act deals with the recovery of payments made in excess of authorised<br />
rates. S 86 (1) states that the Chief Executive of the Ministry of Social Development “may” recover<br />
the amount from the beneficiary as a debt due to the Crown. The use of the word “may” means that<br />
Parliament is clearly not making it mandatory for the debts to be recovered. Section 86 (1A) states<br />
that money to which a beneficiary was not entitled “shall constitute a debt due to the Crown and may<br />
be recovered at the suit of the Director-General or the Director-General may recover that debt by<br />
deduction from any benefit thereafter payable to that person.” Note once again the use of the word<br />
“may.” It is not mandatory for the Ministry to recover the debt.<br />
Recommendations<br />
• New Zealand needs to withdraw its reservations to UNCROC and implement all of its obligations<br />
under the convention;<br />
• The Family Court and Department of <strong>Child</strong>, Youth and Family should be resourced so that cases<br />
relating to children can be properly and promptly resolved;<br />
• <strong>Child</strong>ren born in New Zealand automatically become New Zealand citizens;<br />
• Non-New Zealand citizen children are entitled to health and education services while they are in<br />
New Zealand;<br />
• No children or young people should be detained in police cells and steps should be taken to<br />
ensure there are always beds available in youth justice facilities;<br />
• The age of criminal responsibility should be raised back up to 14 years;<br />
• Counselling programmes should be made available for child domestic violence victims and<br />
witnesses;<br />
• Implement the safe@home programme or an equivalent service nationwide;<br />
• Amend the Social Security Act to require the best interest of children to be taken into account in<br />
all decision-making relating to benefits or alleged benefit fraud;<br />
• Establish an independent benefits review system, either through an Ombudsperson’s Office or<br />
ACC review model.<br />
121
Chapter 12. <strong>Child</strong> Health and <strong>Poverty</strong><br />
Nikki Turner, 79 Innes Asher, 80 Katie Bach, 81 Simon Denny, 82 Nick Fancourt 83 and Sally Merry 84<br />
Some children have dramatically different life chances based on their early life experiences. If<br />
these experiences are harmful and ongoing, children’s health outcomes will be poor, both as<br />
children and adults. <strong>Child</strong>ren in low-income families have the poorest health educational and<br />
social outcomes, which tend to compound over the course of their lives. (Public Health Advisory<br />
Committee, 2010a)<br />
Introduction<br />
<strong>Poverty</strong> is one of the leading factors contributing to illness, disease, disability<br />
and deaths in New Zealand children. For children, poverty means lacking<br />
the material resources to stay well. Income is needed for many basic needs<br />
of children: health care (transport, doctors’ fees, prescription costs, hospital<br />
parking); nutritious food; adequate housing (not crowded, damp, cold or too<br />
costly); clothing, shoes, bedding, washing and drying facilities; and education<br />
(early childhood education fees, transport, stationery, school donations, exam fees, school trips).<br />
<strong>Further</strong>more, households in poverty are stressful environments for children to grown up in. Stress<br />
affects their immune responses to infections and reduces their resilience to mental health problems.<br />
The health of children in New Zealand compared with OECD countries<br />
When UNICEF published its report four years ago – “An overview of child well-being in rich countries”<br />
(UNICEF, 2007) it was no surprise to those working in child health in New Zealand that we ranked<br />
poorly (24th out of 25 nations). Among OECD countries our infant death rates were the fourth worst;<br />
our immunisation rates the third worst, and our childhood deaths from injury the worst. In 2009 the<br />
OECD published a report – “Doing better for children” (OECD, 2009a). In regard to New Zealand<br />
they specifically noted that child mortality is higher than average; and immunisation rates are poor<br />
especially for measles and pertussis; and we have the highest rates of suicide among the 15–19 year<br />
age group. They went on to say that New Zealand spends less than the OECD average on young<br />
children; that New Zealand should spend considerably more on younger, disadvantaged children;<br />
and that New Zealand needs to take a stronger policy focus on child poverty and child health. The<br />
Public Health Advisory Committee (2010a) report for the Ministry of Health somewhat starkly outlines<br />
our historical challenges for child health with a legacy of “haphazard ‘boom or bust’ child policies and<br />
‘stop-start’ programmes that are often not fully implemented.”<br />
79 Dr Nikki Turner, Health Spokesperson for <strong>Child</strong> <strong>Poverty</strong> <strong>Action</strong> <strong>Group</strong>, is Senior Lecturer in the School of Population<br />
Health, University of Auckland; Director of the Immunisation Advisory Centre; and General Practitioner with the Pacific<br />
Health Medical Centre, Strathmore, Wellington.<br />
80 Innes Asher, ONZM, is Professor of Paediatrics: <strong>Child</strong> and Youth Health, University of Auckland; and Honorary Consultant<br />
in Paediatric Respiratory Medicine, Starship <strong>Child</strong>ren’s Health. Professor Asher is a member of the Management<br />
Committee of <strong>Child</strong> <strong>Poverty</strong> <strong>Action</strong> <strong>Group</strong>.<br />
81 Katie Bach is a dental officer working at Auckland District Heath Board with a special interest in public health dentistry.<br />
82 Dr Simon Denny, Senior Lecturer, Department of Paediatrics, <strong>Child</strong> and Youth Health Faculty of Medical and Health<br />
Sciences, University of Auckland.<br />
83 Dr Nicholas Fancourt, an advanced trainee in paediatric medicine, served on the Management Committee of <strong>Child</strong><br />
<strong>Poverty</strong> <strong>Action</strong> <strong>Group</strong> until he left for study towards a PhD in Health Systems, International Health, at the Johns Hopkins<br />
Bloomberg School of Public Health as an International Fulbright Science and Technology Fellow.<br />
84 Dr Sally Merry is Associate Professor of Psychology at the University of Auckland Medical School.<br />
122
The health inequity of children within New Zealand<br />
In New Zealand, children growing up in poverty experience significantly poorer physical and mental<br />
health outcomes than other children across a wide range of health measures, including infant mortality<br />
and hospital admissions for infectious and respiratory diseases (Craig, et al., 2007; National Health<br />
Committee, 1998). <strong>Further</strong>more, New Zealand research demonstrates that growing up in poverty<br />
during the crucial early years increases the risk of longer-term negative outcomes, such as heart<br />
disease, poor dental health, antisocial behaviour (Boden, Fergusson, & Horwood, 2010), and drug<br />
abuse in adulthood (Poulton et al., 2002). New Zealand’s historical base shows large disparities in<br />
child health outcomes, particularly since the early 1990s. There was a marked rise in hospitalisations<br />
beginning in 1992, closely following the significant rise in child poverty which occurred at that time<br />
(Craig, et al., 2007). In the latter part of the last decade, alongside a period of relative economic<br />
stability for New Zealand, there was a levelling out of hospitalisation rates for many diseases and in<br />
some cases a small fall. However, it was of significant concern that rates remained high by OECD<br />
standards and did not fall back to pre-1990 levels.<br />
Not only have health outcomes in New Zealand children worsened, but disparities in poor health<br />
outcomes have widened over the past three decades: children in very low-income families, children<br />
of beneficiaries and children of prisoners have worse health outcomes than other children (Public<br />
Health Advisory Committee, 2010a). <strong>Further</strong>more ethnic disparities are large with Māori and Pacific<br />
Vignette One: Why do children in poor environments get sick?<br />
Juliette is 8 months of age and has just been admitted to hospital with pneumonia. Why did she end up<br />
in hospital at such a young age? She only had one of the three childhood immunisations. Her mother<br />
is a young solo parent, caring for Juliette and her two-year-old brother. Her father has drug and alcohol<br />
dependency problems and does not live with them or support them. Juliette’s mother has a history of<br />
physical and sexual abuse, and no longer has contact with her family. She had no education past age14,<br />
is significantly in debt, and is very anxious around authority figures as she is afraid she will be seen as a<br />
poor mother and will lose her children. Since Juliette was born, they have moved house four times and are<br />
currently living in a room in an Auntie’s house, with 14 other people. It is cold and damp and several of the<br />
adults smoke.<br />
Why did Juliette get sick?<br />
Firstly in a household like this, the bacteria that cause pneumonia can easily spread with over-crowding,<br />
and many other sick people mixing with the infant. Bacteria spread via coughing and touching with unclean<br />
hands. Hygiene issues are difficult in crowded houses without money for power, hot water, adequate soap,<br />
towels and bed linen.<br />
Secondly, Juliette’s immune system will not respond as vigorously as other children to infection. She has<br />
poor nutrition, associated iron deficiency, which leaves her more prone to more and more severe infections.<br />
She will be stressed with all the challenges in her environment, and stress weakens the immune system’s<br />
ability to fight infection. Her mother is occupied with many other challenges in her day-to-day living and did<br />
not manage to complete Juliette’s immunisation programme so she is not fully protected against vaccinepreventable<br />
diseases.<br />
Thirdly, Juliette has reduced access to health care services. She was unwell in the weekend but due to the<br />
cost of going to the After Hours service her mother delayed taking her to the doctor until Monday morning.<br />
Her Mum is young and inexperienced without background education or family support of her own to know<br />
the warning signs of an infant becoming very unwell.<br />
Without significant support Juliette’s story in a few years’ time is likely to end up similar to Jack’s.<br />
123
children having about two to three times poorer health that non-Māori, non-Pacific (Public Health<br />
Advisory Committee, 2010a).<br />
In March 2011, the New Zealand Medical Association published a statement about health equity,<br />
much of which applies to children, with emphasis on indigenous status, early life conditions,<br />
education, food security, health care services, housing, income, ethnic differences, social position<br />
and social exclusion (New Zealand Medical Association, 2011). <strong>Further</strong>more the February (2011)<br />
United Nations Committee on the Rights of the <strong>Child</strong> report recommended that inequalities in access<br />
to health services be addressed through a coordinated approach across all Government departments<br />
and greater coordination between health policies and those aimed at reducing income inequality and<br />
poverty. It also recommended that New Zealand take all necessary measures to provide appropriate<br />
Vignette Two: childhood poverty leads to recurrent and ongoing problems<br />
Jack is nine years old, he is the second of three siblings, his father is in jail. Jack’s Mum is 36 years old;<br />
she has a long-standing medical condition. She has been in and out of work for many years, manages a<br />
job for up to 6 to 9 months then finds herself unable to sustain it, either due to her own health issues or<br />
the recurrent illnesses of her children. Jack is overweight, he has learning difficulties at school and he is a<br />
bully in the playground. Jack has a large medical history: multiple visits to the GP and Accident and Medical<br />
Centres for asthma, eczema, chest infections, skin infections, injuries. <strong>Further</strong>more he has had TEN<br />
hospital admissions: wheezy bronchitis as a baby (twice), asthma (three times), a broken leg, a head injury,<br />
skin infection (twice) and a dental abscess.<br />
Jack’s story comes from a history of poverty, significant social stress, poor housing, poor nutrition, poor<br />
social support, and minimal parenting knowledge or education. From the literature of situations such as<br />
Jack’s his outlook is very bleak. He is likely to have lifelong poor health, depression, drug and alcohol<br />
abuse when older, school failure, limited occupational options, criminality, broken relationships and a<br />
shortened life expectancy. He is likely to feel suicidal, and is at risk of attempting suicide. He is likely to cost<br />
the health and justice services a large amount of money over his difficult life.<br />
support to allow disadvantaged families and their children to move out of poverty in a sustained way<br />
while, at the same time, continuing to provide assistance to those who remain under the poverty line.<br />
There are a range of reasons why disparity gaps affect the health outcomes of our children so<br />
powerfully. For example contact with infectious organisms is likely to be higher in poor housing<br />
conditions: with overcrowding there is more contact with other sick people; limited washing facilities,<br />
sharing linen and towels make good hygiene harder to achieve; poor nutrition leads to a child being<br />
less likely to have resistance to the infectious organisms. Damp and cold housing make respiratory<br />
disease more likely. An emotionally stressful environment adds to disease risk by reducing the<br />
immune response. Stressful environments are also associated with greater mental health problems<br />
in the adults, including depression, substance abuse and family violence. These all have an adverse<br />
immediate effect on the social and emotional health of children, but also have the potential to change<br />
the developmental trajectory adversely, with increased rates of conduct disorder, depression,<br />
substance use and self-harm that manifest in childhood, adolescence and into adulthood.<br />
Moreover, these children are likely to have less access to health care services due to cost barriers,<br />
barriers to getting to services, and, at times, less parental knowledge and less confidence in the services.<br />
Accidents and injuries are more common with the physical environments in poorer areas with fewer<br />
parks, busy roads, shared driveways, crowded houses often in poor repair and the lifestyle challenges<br />
for parents with less support and flexibility leading at times to less supervision of their children.<br />
124
In recognition of the range of factors that impact on health outcomes for children growing up in poverty<br />
there are a range of health initiatives that do support better outcomes. Areas that make a significant<br />
difference include having good intra-uterine care in the pregnancy, supporting breastfeeding and<br />
healthy nutrition, a safe environment – both physically and emotionally, consistent parenting, broader<br />
community and whānau support, ease of access to well child and primary health care services.<br />
Youth Health<br />
The main determinants of young people’s health and well-being are behaviours and emotional health<br />
concerns that begin during early adolescence and progressively increase into early adulthood (Flory,<br />
Lynam, Milich, Leukefeld, & Clayton, 2004; Schulenberg, Sameroff, & Cicchetti, 2004). The trajectories<br />
for many of the most urgent issues facing New Zealand’s health system such as tobacco use, obesity<br />
and mental health, originate during childhood and adolescence. For example, approximately 80% of<br />
young people who are obese during childhood and adolescence remain obese as adults (Herman,<br />
Craig, Gauvin, & Katzmarzyk, 2009; Whitaker, Wright, Pepe, Seidel, & Dietz, 1997).<br />
Unfortunately New Zealand has a poor record when it comes to young people’s health. Rates of<br />
youth suicide, death from motor vehicle injuries, unintended pregnancy and drug and alcohol use are<br />
among the highest in the Western world (Ministry of Health, 2002). In a recent national youth health<br />
survey, 15% of female secondary school students and 7% of male students reported significant<br />
symptoms of depression and 7% of female students and 3% of male students reported attempting<br />
suicide in the previous year (Adolescent Health Research <strong>Group</strong>, 2007). During adolescence,<br />
heightened risk- taking can lead to adverse health outcomes such as substance abuse, road traffic<br />
injuries and sexually transmitted infections (STIs). These risk behaviours can result in immediate<br />
consequences for young people (e.g. unprotected sex) or result in consequences later during<br />
adulthood (e.g. tobacco use).<br />
Adverse health outcomes among young people not only impact their well-being but have wider social<br />
and economic implications as they hinder young people’s potential development, which results in<br />
increased numbers of marginalised youth and increasing disparities in our communities. For example,<br />
rates of suicide attempts among young people living in poor neighbourhoods are twice those of<br />
young people living in more affluent neighbourhoods (Adolescent Health Research <strong>Group</strong>, 2007).<br />
<strong>Further</strong>more 22% of young people from poor neighbourhoods currently smoke cigarettes compared<br />
to 14% of young people from more affluent neighbourhoods (Adolescent Health Research <strong>Group</strong>,<br />
2007). These adverse health outcomes are disproportionately experienced by young people living in<br />
poverty and impact on their ability to do well in school and contribute positively to their communities.<br />
The most important factors that influence adolescent health and well-being are healthy families<br />
and communities that are able support and provide opportunities for adolescents to contribute and<br />
develop. <strong>Further</strong>more, young people’s health and their families are also influenced by wider structural<br />
factors within nations such as poverty and unemployment as they influence the ability of young<br />
people to transition successfully into meaningful employment, further their training and education,<br />
and form long-term relationships and start families (Staff et al., 2010). Ultimately, the health and<br />
well-being of adolescents growing up in New Zealand reflects how well we provide equitable and fair<br />
societies with opportunities for young people to grow and flourish.<br />
125
<strong>Child</strong> Health Monitoring<br />
The New Zealand <strong>Child</strong>, Youth and Epidemiology Service (NZCYES), established in 2004, has been<br />
reporting standardised data on the health and well-being of our children back to 1988 enabling us<br />
to track with confidence what is happening (Craig & et al., 2011; New Zealand <strong>Child</strong> and Youth<br />
Epidemiology Service, 2009). Most recently NZCYES have been measuring the effect of the recent<br />
recession on children’s health, producing an annual “<strong>Child</strong>ren’s Social Health Monitor” which uses<br />
a mixture of economic, health and well-being indicators to monitor children’s health and well-being<br />
status through this economic downturn. The first Monitor report released in November 2009 showed<br />
a large rise in unemployment 2007–2009 in all groups, but the largest absolute increase was in<br />
Pacific and Māori groups (New Zealand <strong>Child</strong> and Youth Epidemiology Service, 2009). Tracking<br />
alongside this, as would be expected with increasing economic hardship, there have been increases<br />
over the past two years in hospital admissions for conditions that are known to occur more frequently<br />
in children who live in poverty (Figure 12.1). 85 The majority of these conditions are preventable<br />
infectious and respiratory diseases.<br />
Examples of poverty-related child illnesses<br />
Potentially avoidable admissions to hospital<br />
A group of conditions that are considered to be potentially avoidable through early access to effective<br />
treatment in primary care are known as ambulatory sensitive hospitalisations (ASH). They include<br />
asthma, bronchiectasis (chronic lung damage), skin infections, constipation, dental decay, dermatitis<br />
and eczema, gastro-oesophageal reflux, nutritional deficiency, bacterial pneumonia, rheumatic fever,<br />
otitis media, acute upper respiratory tract infections, vaccine-preventable diseases, and urinary<br />
tract infection in children over four years of age (Craig, et al., 2008). A new set of ASH codes was<br />
developed by the NZCYES in 2007 (Craig, et al., 2008) and have been adopted by the Ministry of<br />
Health. For all these conditions there are large socio-economic and ethnic disparities for children, and<br />
hence, while a focus on Figure 12.1 Hospital Admissions (2000-2010) and Mortality (2000-2008) from<br />
access to primary care Conditions with a Social Gradient in New Zealand <strong>Child</strong>ren Aged 0-14 Years<br />
is an important aspect (excluding Neonates) (Source: Craig et al. 2008)<br />
there are much broader<br />
issues (the determinants<br />
of health) which drive<br />
the underlying burden<br />
of disease in these<br />
conditions such as<br />
household income,<br />
housing, nutrition,<br />
exposure to cigarette<br />
smoke, etc (New<br />
Zealand <strong>Child</strong> and Youth<br />
Epidemiology Service,<br />
2008).<br />
85 Via New Zealand <strong>Child</strong> and Youth Epidemiology Service: Numerator Admissions: National Minimum Dataset (Neonates<br />
Removed); Numerator Mortality: National Mortality Collection (Neonates Removed); Denominator: Statistics NZ<br />
Estimated Resident Population. Medical Conditions Admissions: Acute and Arranged Admissions Only; Injury Admissions:<br />
Emergency Department Cases Removed.<br />
126
In New Zealand during the period 2003 to 2007 gastroenteritis (infectious diarrhoea), asthma and<br />
acute upper respiratory tract infections made the greatest contribution to ASH rates in children aged<br />
zero to four years, followed by dental conditions and pneumonia. Table 12.1 shows the relative risk<br />
of being admitted to hospital with any of these conditions. <strong>Child</strong>ren from areas with the greatest<br />
poverty (from NZ deprivation decile 10 (Clare Salmond, Peter Crampton, & June Atkinson, 2007))<br />
have nearly three times the likelihood of being admitted to hospital over those from the most wellresourced<br />
areas (NZ deprivation decile 1). <strong>Child</strong>ren of Pacific ethnicity have 2.5 times the likelihood<br />
and Māori 1.6 times that of European/Pakeha children.<br />
Table 12.1. Risk Factors for Ambulatory Sensitive Hospitalisations Using the New ASH<br />
Coding Algorithm in <strong>Child</strong>ren 0-4 Years, New Zealand 2003-2007 (Source: Numerator-National Minimum<br />
Dataset; Denominator-Census via NZ <strong>Child</strong> and Youth Epidemiology Service; Note: Rate per 1,000 per year; Ethnicity is<br />
Level 1 Prioritised; RR: Rate Ratios are unadjusted. (Craig, et al., 2008))<br />
Emergency Department<br />
Admissions INCLUDED<br />
Emergency Department<br />
Admissions EXCLUDED<br />
Variable<br />
Rate RR 95% CI Rate RR 95% CI<br />
NZ Deprivation Index Decile<br />
1 34.84 1.00 29.79 1.00<br />
2 34.75 1.00 0.96-1.04 28.33 0.95 0.91-0.99<br />
3 38.89 1.12 1.07-1.16 31.82 1.07 1.02-1.12<br />
4 48.76 1.40 1.35-1.45 41.87 1.41 1.35-1.46<br />
5 50.56 1.45 1.40-1.51 42.18 1.42 1.36-1.47<br />
6 61.63 1.77 1.71-1.83 51.83 1.74 1.67-1.81<br />
7 66.23 1.90 1.84-1.97 57.05 1.91 1.84-1.99<br />
8 87.01 2.50 2.42-2.58 73.21 2.46 2.37-2.55<br />
9 95.43 2.74 2.65-2.83 81.91 2.75 2.65-2.85<br />
10 104.06 2.99 2.89-3.08 90.08 3.02 2.92-3.13<br />
NZ Deprivation Index Quintile<br />
1 34.79 1.00 29.07 1.00<br />
2 43.85 1.26 1.23-1.30 36.87 1.27 1.23-1.31<br />
3 56.17 1.61 1.57-1.66 47.07 1.62 1.57-1.67<br />
4 77.04 2.21 2.16-2.27 65.46 2.25 2.19-2.31<br />
5 100.18 2.88 2.81-2.95 86.40 2.97 2.90-3.05<br />
Ethnicity<br />
European 50.78 1.00 44.26 1.00<br />
Māori 83.50 1.64 1.62-1.67 75.20 1.70 1.67-1.73<br />
Pacific 129.17 2.54 2.50-2.59 99.55 2.25 2.21-2.29<br />
Asian 55.78 1.10 1.07-1.13 39.62 0.89 0.87-0.92<br />
Gender<br />
Female 60.27 1.00 51.33 1.00<br />
Male 70.20 1.16 1.15-1.18 59.56 1.16 1.14-1.18<br />
Rural / Urban<br />
Urban 69.36 1.00 58.39 1.00<br />
Rural 39.95 0.58 0.56-0.59 37.43 0.64 0.63-0.66<br />
127
Bronchiolitis<br />
Bronchiolitis is a viral<br />
chest infection of babies<br />
which causes wheezing,<br />
Figure 12.2. Hospital Admissions (1990-2007) and Deaths (1990-<br />
2005) due to Bronchiolitis in New Zealand Infants
Rheumatic Fever<br />
Acute rheumatic fever is an inflammatory reaction by the body which develops in some children<br />
in response to a bacterial throat infection cause by an organism called <strong>Group</strong> A streptococcus. It<br />
usually occurs in school-age children and can affect the brain, heart, joints and skin. One of its worst<br />
outcomes is permanent damage to the heart, including scarring and deformities of the heart valves.<br />
While New Zealand’s rheumatic fever rates have declined significantly during the past 30 years they<br />
have remained relatively unchanged since the 1990s and are about 13 times higher than those of<br />
most other developed countries (The Paediatric Society of New Zealand, 2010). Acute rheumatic<br />
fever admission rates are around 10/100,000 for children and youth aged 0 to 24 years (Craig, et al.,<br />
2007).<br />
Rheumatic fever has a very strong link to growing up in poverty as shown in Table 12.2. A child who<br />
comes from a family in the poorest 20% of areas (NZ deprivation decile 9- 10) has a nearly 30 times<br />
increased likelihood of being admitted to hospital with rheumatic fever compared to a child from the<br />
most well-resourced 20% of areas (NZ deprivation decile 1–2).<br />
Table 12.2. Risk Factors for Hospital Admission due to Acute Rheumatic Fever in <strong>Child</strong>ren<br />
and Young People 0-24 Years, New Zealand 2003-2007 (Source: Numerator-National Minimum Dataset;<br />
Denominator-Census via NZ <strong>Child</strong> and Youth Epidemiology Service; Rate per 100,000 per year; Ethnicity is Level 1<br />
Prioritised; RR: Rate Ratios are unadjusted (Craig et al., 2008))<br />
Variable Rate RR 95% CI Variable Rate RR 95% CI<br />
NZ Deprivation Index Quintile<br />
Prioritised Ethnicity<br />
1-2 1.26 1.00 European 1.15 1.00<br />
3-4 2.88 2.28 1.28-4.03 Māori 31.81 27.68 20.45-37.47<br />
5-6 5.57 4.41 2.60-7.47 Pacific 61.76 53.74 39.52-73.07<br />
7-8 9.50 7.52 4.54-12.46 Asian 0.88 0.77 0.33-1.79<br />
9-10 37.04 29.32 18.11-47.46 Urban / Rural<br />
Gender Urban 13.34 1.00<br />
Female 10.08 1.00 Rural 8.43 0.63 0.50-0.79<br />
Male 15.22 1.51 1.32-1.73<br />
<strong>Further</strong>more, the ethnic disadvantages are enormous with a Maori child having a nearly 28 times<br />
increased risk and a Pacific child nearly 54 times increased risk compared with NZ European. New<br />
Zealand research has shown that rheumatic fever is strongly associated with household crowding<br />
and has called for action to reduce household crowding as an important factor towards reducing our<br />
alarming rates of rheumatic fever (Jaine, et al., 2011).<br />
Serious Skin Infections<br />
Bacterial skin infections have become a common cause of hospital admissions for children, and<br />
continue to be much higher than rates 25 years ago. Hospital admissions for serious skin infections<br />
increased dramatically in the 1990s, and started to plateau in recent years as shown in Figure 12.4. A<br />
child living in areas with the greatest poverty (from NZ deprivation decile 10) is five times more likely<br />
to be admitted to hospital than a child from the most well-resourced areas (NZ deprivation decile 1)<br />
(Craig, et al., 2008).<br />
129
The same ethnicity<br />
equity gap is seen with<br />
Maori children having<br />
nearly three times and<br />
Pacific children 4.5<br />
times the risk of NZ<br />
European children the<br />
risk of being admitted<br />
to hospital. A recent<br />
publication using a<br />
more sensitive (but<br />
as specific) approach<br />
to defining hospital<br />
admission for serious<br />
skin infections has<br />
shown similar trends,<br />
with greatest risk<br />
in boys, children under five, urban areas and northern regions, and high and disproportionately<br />
increasing rates in Māori and Pacific children, those living in the most deprived 20% of neighbourhoods<br />
(O’Sullivan, Baker, & Zhang, 2010).<br />
Figure 12.4. Hospital Admissions for Serious Skin Infections in <strong>Child</strong>ren and<br />
Young People 0-24 Years, New Zealand 1990-2007 (Source: Numerator-National<br />
Minimum Dataset; Denominator-Census via NZ <strong>Child</strong> and Youth Epidemiology Service (Craig<br />
et al., 2008))<br />
Admissions per 1,000<br />
5<br />
Serious Skin infection Admissions 0-14 yrs<br />
Serious Skin Infection Admissions 15-24 yrs<br />
4<br />
3<br />
2<br />
1<br />
0<br />
1990-91 1992-93 1994-95 1996-97 1998-99 2000-01 2002-03 2004-05 2006-07<br />
Year<br />
Hospital Admissions due to Serious Skin Infections in <strong>Child</strong>ren and Young People 0-<br />
24 Years, New Zealand 1990-2007<br />
There are likely to be several reasons why children from poor families are more likely to be hospitalised<br />
with severe skin infections. Overcrowding is likely to be a factor because crowded living conditions<br />
make transmission of infection easier, and poor hygiene may arise from less adequate washing<br />
facilities, as well as shared towels and bedding. Poor access to primary care for management of<br />
early skin infections such as from scabies, nits, infected bites and cuts may also contribute. Poor<br />
nutrition and stressful households both affect the immune system’s ability to fight off infection.<br />
Injuries/<strong>Child</strong> abuse<br />
[A three-year-old girl] suffered severe head and abdominal injuries, allegedly inflicted by her<br />
step-grandfather and other members of her extended family, after reportedly being hung from<br />
a clothesline and spun in a clothes dryer. The toddler died in hospital after being taken off life<br />
support. Five people have been charged with assaulting the little girl. Additional charges may<br />
stem from her death. It is believed that she had been subjected to months of torture-like abuse.<br />
(Barriere, 2009).<br />
<strong>Child</strong> abuse is the dark side of New Zealand society. No amount of statistics can capture the horror<br />
for this child and other children with similar stories. Death rates are highest for children under two<br />
years of age (Ministry of Social Development, 2004b). During the 1990s New Zealand was ranked<br />
the third worst in the OECD for death rates from child abuse and the situation has improved little<br />
since then.<br />
Although individual deaths continue to hit headlines and draw a lot of attention, it is a scandal and<br />
our shame that our very high rates of child abuse continue. Longitudinal studies suggest that 4%<br />
to 10% of all New Zealand children experience physical abuse, and 11% to 20% experience sexual<br />
abuse. (Ministry of Health, 1998). The long-term consequences may include psychological and<br />
physical damage, including depression, post-traumatic stress disorder, suicide and high-risk sexual<br />
130
ehaviour. (D. M. Fergusson,<br />
Boden, & Horwood, 2008;<br />
Kendall-Tackett, 2002). The<br />
NZCYES data shows there are<br />
approximately 10–19 deaths in<br />
children aged 0-14 every year<br />
due to non-accidental injury<br />
(Craig, et al., 2008).<br />
Common factors associated<br />
with an increased risk of fatal<br />
child maltreatments by adults<br />
were examined in a government<br />
report (Ministry of Social<br />
Development, 2006a). They<br />
included poverty, a low-level<br />
education, being unemployed,<br />
Figure 12.5 Hospital Admissions (2000-2009) and Deaths (2000-2007)<br />
due to Injuries Arising from the Assault, Neglect or Maltreatment of<br />
New Zealand <strong>Child</strong>ren 0-14 Years (Source: http://www.nzchildren.co.nz/)<br />
Admissions per 100,000 (0-14 Years)<br />
30<br />
25<br />
20<br />
15<br />
10<br />
5<br />
0<br />
2.5<br />
Number Assault Deaths 0-14 Years<br />
New Zealand Assault Admissions 0-14 Years<br />
Assault Mortality Rate 0-14 Years<br />
2<br />
19<br />
1.5<br />
18<br />
14<br />
1<br />
10<br />
0.5<br />
0<br />
2000-01 2002-03 2004-05 2006-07 2008-09<br />
Year<br />
being young, poor mental health including alcohol or drug abuse, being the victim of family violence<br />
as a child, having a history of offending, and early offending.<br />
Rates of hospital admission for children because of assault, neglect or maltreatment declined during<br />
the early 1990s, but have remained relatively steady since 1996/1997 as shown in Figure 12.5. 88<br />
<strong>Poverty</strong> plays an important role in these appalling statistics: the likelihood of assault, neglect or<br />
maltreatment is four times higher for a child from the poorest 20% of areas.<br />
Mortality per 100,000 (0-14 Years)<br />
Dental/Oral Health<br />
Dental caries is a preventable disease that, despite free dental care in New Zealand for all children<br />
under 18 years, still has a significant impact on our nation’s most vulnerable children. Poor oral health<br />
leads to pain and infection, prevents children attending school, interrupts sleep, hinders concentration<br />
in classrooms and places economic strain on families who need to miss work and provide transport<br />
to dental appointments. In severe cases dental caries can lead to serious infection of the deep<br />
tissues or blood stream, and the child will need to be admitted for urgent hospital treatment.<br />
There are significant regional and ethnic disparities in the distribution of the disease among our<br />
children. Only 44% of five-year-old children living in the Counties Manukau region were caries free<br />
in 2009 as opposed to 67% of five-year-olds in the Otago region (Ministry of Health, 2009b).. Māori<br />
and Pacific children shoulder a disproportionate burden of disease with only 34% of Māori and 27%<br />
of Pacific five-year-olds caries free, significantly less than the national average of 55% of five-yearolds<br />
caries free (Ministry of Health, 2009b). Not only are Māori and Pacific children more likely to<br />
experience the disease, they experience greater severity of the disease, exhibiting more decayed,<br />
missing and filled teeth than their non-Māori and Pacific counterparts.<br />
Preschoolers with severe dental needs often require a general anaesthetic for treatment, and can<br />
wait up to nine months after their initial contact with the school dental service for surgery. The majority<br />
of these children will require multiple courses of antibiotics to reduce infection while waiting. ‘Free<br />
88 Via NZ <strong>Child</strong> and Youth Epidemiology Service; Numerator Admissions: National Minimum Dataset, Numerator Mortality:<br />
National Mortality Collection; Denominator: Statistics NZ Estimated Resident Population. Note: Numbers are per 2-year<br />
period.<br />
131
treatment’ appears to be the ambulance at the bottom of the cliff for these children. Factors affecting<br />
access to this treatment, and the broader determinants of health affecting teeth and gums need<br />
attention.<br />
Five more health issues for children in poverty<br />
Nutrition<br />
Healthy food in sufficient quantities each day is essential for good health. 89 The Ministry of Health<br />
produces guidelines for the food and nutrition for New Zealand children (Ministry of Health: Well<br />
<strong>Child</strong>, 1997) which identify four food groups which children should eat every day: fruit and vegetables;<br />
milk and milk products; lean meats, fish and eggs; cereals and bread. Good nutrition is essential for<br />
many aspects of health and well-being to help the immune system deal with infections, to prevent<br />
iron deficiency and to prevent adult heart disease and cancers.<br />
A recent study measured the cost of buying food for meal plans based on the Ministry of Health’s<br />
guidelines for three age groups of children (Hopgood et al., 2010). The average annual cost of food<br />
from supermarkets for one child was per year, in 2007, $1472 (3–5 year old), ($1,996 (5–10 year<br />
old) $4,411 (13–14 year old). Prices were about the same in most and least deprived areas. This is a<br />
high proportion of the child-related component of New Zealand government provisions for low socioeconomic<br />
families, especially for older children, meaning that buying healthy food for teenagers in<br />
particular will be unaffordable for many low-income families. Since 2007 the cost of most food groups<br />
has risen substantially, on average 10% per year during 2010 (Statistics New Zealand, 2011).<br />
Housing<br />
In New Zealand we have two main issues for housing – crowding and quality. 90 For centuries it has<br />
been known that adequate housing is necessary for health. During our meningococcal B epidemic,<br />
household crowding was shown to be the strongest risk factor for meningococcal disease – adding<br />
six adults to a household of two to three adults increased the rate of meningococcal disease nearly<br />
11 times (Baker et al., 2000). This research was a turning point in New Zealand for starting to change<br />
housing policies for the better and stimulating more housing research.<br />
Why have we have got such a housing problem in New Zealand? Around 300,000 New Zealand<br />
homes are wooden, un-insulated, damp and cold. Insulation for new housing became compulsory<br />
only in 1978. Cold damp homes can cause ill health, and cost a lot to heat. Heating costs can be<br />
unaffordable for low-income families, so they live in the cold and damp. Low-income families may<br />
double up to reduce costs of rent and heating, leading to household crowding.<br />
Since 2001 some programmes which provide healthier housing have been implemented and<br />
evaluated, showing good health improvements. Housing research led from Wellington showed that in<br />
seven low-income areas in New Zealand insulating houses significantly improved self-rated health,<br />
reduced self-reported wheezing, days off school and work, and visits to general practitioners as well<br />
as showing a trend for fewer hospital admissions for respiratory conditions (Howden-Chapman et<br />
89 CPAG’s recent publication, Hunger for Learning (2011), provides data on experiences of schools which have provided<br />
breakfast programmes. It identifies both the advantages of those programmes and the requirements to ensure that all<br />
children start the school day adequately nourished. That report was launched almost simultaneously with the findings<br />
from Project Energize (Rush et al., 2011), which operates on the motto: “Eat healthy! Be active! Have fun!” Both reports<br />
emphasised the positive results for children from learning about nutrition, experiencing good nutrition, especially<br />
breakfast, and participating in projects focused on it.<br />
90 See Chapter 13 on housing.<br />
132
al., 2007). A further study showed that, in seven low-income areas in New Zealand, insulation and<br />
non-polluting, more effective heating in the homes of children with asthma significantly reduced their<br />
symptoms, days off school and healthcare visits (Howden-Chapman et al., 2008).<br />
In the Counties Manukau region of Auckland a Healthy Housing programme (involving house<br />
modifications, and health and social service assessments and linkages) which resulted in a 27%<br />
lower rate of housing-related potentially avoidable hospitalisations for 5 to 34 year olds. The largest<br />
decrease for the latter study was for respiratory conditions in children (G. Jackson et al., 2011b)<br />
By 2008, less than half of old state houses had been retrofitted with insulation, with a commitment<br />
made to complete retrofitting for all state houses by 2013. For private accommodation, subsidies<br />
are available (such as EECA Energywise, Warm up Counties and Snug Homes), but there is no<br />
compulsion to improve the quality of private homes including rental accommodation where many<br />
children in poverty live.<br />
Social and emotional needs<br />
While few would dispute the need for food and shelter, the importance of addressing the social<br />
and emotional needs of children receives less attention. Research over the last few decades has<br />
shown that this is of fundamental importance. From the time of their birth, babies and children need<br />
social interaction from caretakers who are able to respond to their needs with sensitivity. Very young<br />
babies will communicate with those around them through facial expressions, gestures and babbling.<br />
Parents and other adults who are sensitive to these cues will respond in kind leading to a reciprocal<br />
interchange which we now know is important in laying the foundations for later social and emotional<br />
competence through the development of the architecture of the brain.<br />
Babies and young children who are raised in emotionally warm and supportive environments are<br />
more likely to develop into adolescents and adults who are empathic and socially competent, and<br />
who are able to regulate their own emotions (Shonkoff & Phillips, 2000). Those who grow up in<br />
environments where these emotional needs are not met, or where they are traumatised by angry and<br />
impatient responses, or physically abused, are at risk of a host of poor outcomes including poor later<br />
mental health, with increased depression, anxiety, substance abuse and self-harm, and also poorer<br />
physical health (Anda et al., 2006; Dube, Felitti, Giles, & Anda, 2003; Graham-Berman & Seng, 2005;<br />
Poulton, et al., 2002). This is not only costly to the individual, it is also costly to society (Knudsen,<br />
Heckman, & al., 2006).<br />
Parents struggling to provide food and shelter are likely to be less emotionally available for their<br />
young children. The stress of being poor is associated with poorer mental health for the parents<br />
with increased anxiety and depression, and substance abuse, all of which impact adversely on the<br />
parent’s ability to respond sensitively and appropriately to their young children. Stress and mental<br />
health problems make people more irritable, so that the chances of responding angrily to a crying<br />
baby or frustrated toddler are increased, with an increased risk of emotional and physical abuse of<br />
the child.<br />
These interactions tend to compound as the child grows older, leading to an increase in conduct<br />
disorder, depression, anxiety, substance abuse and self-harm in adolescence and into adulthood.<br />
There are effective interventions that can support parents to provide care that meets the emotional<br />
needs of very young children (Knudsen, et al., 2006) and to provide interventions for children and<br />
133
families struggling with mental health problems. However, children are doubly disadvantaged in New<br />
Zealand. Not only do we have high rates of poverty that disadvantages children disproportionately,<br />
there is also disparity in mental health funding, so that children, who make up 28% of the population,<br />
receive 11% of the mental health funding (Wouldes, Merry, & Guy, 2011). <strong>Further</strong>, funding for<br />
children and adolescents has been focussed on adolescents for the last two decades (The Mental<br />
Health Commission, 2006). This is not only a failure to address the needs of the youngest and most<br />
vulnerable part of the population, but also makes little economic sense as it has been estimated that<br />
for each dollar spent early in life, there is a potential return of $1.26 to $17.00 for each dollar spent<br />
(Karoly, Kilburn, & al., 2005).<br />
Immunisation<br />
Immunisation against childhood diseases such as measles, whooping cough, meningitis and<br />
pneumonia has a powerful impact on child health, and is one of the most cost-effective healthcare<br />
services available. As UNICEF (2007) states, national immunisation rates serve as a measure<br />
of the comprehensiveness of preventative health services for children, and as a measure of the<br />
national commitment to primary health care for all children. An effective programme that leads to<br />
the best control of disease requires up to 95% immunisation uptake in a community, and children<br />
receiving their immunisations on time. New Zealand has historically had very low immunisation<br />
coverage rates and resultant high rates of diseases such as whooping cough. However, over the<br />
past few years improving immunisation coverage has been a focus: out of the six Ministry of Health<br />
national health targets, immunisation is the only child target. The result of increased recent attention<br />
is that immunisation coverage rates have improved from 72% of all New Zealand children being<br />
fully immunised at the age of two in 2005 to 88% fully immunised by 1 January 2011. While this is<br />
excellent progress, further efforts are required to increase coverage to the national target of 95%<br />
fully immunised.<br />
<strong>Further</strong>more, equity gaps persist. Good progress has been made for Pacific children with now 91% fully<br />
immunised at two years of age, although the timeliness of delivery is still slower than for NZ European<br />
children. However, children from the poorest 20% areas (NZ deprivation decile 9–10) have rates<br />
currently around 84% and Māori children around 85% at age two (Forrest, Simpson, & Clancy, 1997).<br />
Recent research from the University of Auckland examined immunisation coverage levels among<br />
children at 12 months of age using National Immunisation Register data, shown in Figure 12.6 (Mueller,<br />
et al., 2010) demonstrating the Figure 12.6. Proportion of Fully Immunized <strong>Child</strong>ren by Deprivation<br />
significant equity gap: children and Ethnicity (Mueller, Exeter, & Turner, 2010)<br />
being at the highest risk of<br />
not being immunised are both<br />
identified as Māori ethnicity<br />
and come from areas with the<br />
greatest poverty.<br />
This research also examined<br />
a range of household<br />
characteristics by mapping the<br />
national immunisation register<br />
data to NZ census data. The<br />
risk factors that were the<br />
134
strongest associations with not getting immunised were poverty, Māori ethnicity, children coming<br />
from bigger households, having sole parents and parents with income from benefits (Mueller, et<br />
al., 2010). While improvements in immunisation coverage demonstrate that, with resources and<br />
attention, NZ is able to improve a child’s health outcome, these data demonstrates that the greatest<br />
challenges remain for children with resource disadvantage.<br />
Access to Primary Care<br />
Access to primary care is recognised as an important element in promoting child health and reducing<br />
disparities in health (Andrulis, 1998; Forrest, et al., 1997). Primary care forms the foundation of an<br />
effective health system, with provision of services such as immunizations, well child checks, and<br />
management of acute illnesses all important for children’s long-term health. Ensuring a family has<br />
access to care whenever they need it allows for timely treatment and can avoid more costly care<br />
being required if an illness worsens. In New Zealand, two foundation documents on primary care<br />
highlight the importance of access, and of cost as a barrier to access (Ministry of Health, 2001b,<br />
2005b). Financial barriers to access can lead to a delay in seeking care (Barnett, 2001) and can<br />
place families in the difficult position of balancing expenses such as doctors’ fees and prescriptions<br />
with ongoing household costs.<br />
Since 1996, New Zealand has attempted to provide a “Free <strong>Child</strong> Health Care Scheme” aimed at<br />
reducing primary care costs for children under the age of six. Some additional funding has been<br />
targeted towards this group of children, and to the provision of very low-cost services (Hodgson,<br />
2007). While 80% of General Practices provide free visits for the under-sixes during weekday work<br />
hours, a significant gap exists for those seeking primary care outside of these hours. (Fancourt,<br />
Turner, Asher, & Dowell, 2010). After hours is an important time for the diagnosis and treatment of<br />
childhood illnesses because many families find it difficult to access care during working hours, with<br />
limited access to transport or parental employment constraints. Moreover, some conditions such<br />
as common respiratory problems (e.g. asthma, croup) naturally deteriorate overnight. The Ministry<br />
of Health reported that funding for afterhours care is a problem “more widespread than previously<br />
thought” and identified 119 locations where after-hours consultations for children under the age of six<br />
cost $16 or more (20 of which charged over $41) (Ministry of Health, 2007).<br />
Thus the goal of universal free care remains unmet, and may be contributing towards New Zealand’s<br />
poor child health statistics. While the provision of primary care remains complex, flexibility in funding<br />
arrangements and a variety of approaches that are community-specific can enable increased and<br />
consistent access to care for all children at all hours.<br />
What needs to be done?<br />
High rates of childhood diseases, injuries and low immunisation rates have complex origins and<br />
many influences. Positive family influences including ‘good parenting” are a vital part of good child<br />
health, and this is strongly influenced by parental education. However the broader societal influences<br />
– the determinants of health are also vitally important.<br />
Individuals and communities need the support of the health system, health programmes, social<br />
services and local and national governments to create the enabling conditions for them to take<br />
effective health action.((Royal College of Physicians, 2010)<br />
135
The Public Health Advisory Committee report (Public Health Advisory Committee, 2010a) sets a<br />
clear agenda for a way forward with the need for sustained investment in a long-term whole-ofgovernment<br />
approach that invests in structures and policies for children. This report proposed four<br />
main areas of focus with a clear list of actions under each:<br />
• Strengthen leadership to champion child health and well-being;<br />
• Develop an effective whole-of-government approach for children;<br />
• Establish an integrated approach to service delivery for children;<br />
• Monitor child health and well-being using an agreed set of indicators.<br />
Other countries have led the way on integrated structural and policy approaches and reaped the<br />
rewards. There are good models both internationally and locally. New Zealand’s recent Whānau<br />
Ora initiative appears to have the intention to respond to many of these concerns. However, there is<br />
a requirement for a greater political commitment, whole-of-government attention, better integrated<br />
policies and increased resourcing both at national and local levels. Service-delivery solutions need<br />
time, patience, resources and ongoing attention to work out, make mistakes and review. Solutions<br />
are likely to be harder, more long term and more expensive than what is often politically tolerated,<br />
but they are feasible.<br />
Recommendations<br />
• The first priority is to create free access to primary health care services for children under six<br />
years: all days of the week and for after-hours services;<br />
• Increase the governments' strategic and financial commitment to children’s health and child<br />
mental health, as a much larger percentage of the national health budget;<br />
• The government to respond to the concerns and recommendations from the 2010 PHAC report;<br />
• Create a national health target that focuses on reducing poverty-related admissions to hospital<br />
for children;<br />
• Urgently develop a national strategy to focus on under-nutrition in children. Strategies could<br />
include making breakfast available to all in decile 1 and 2 schools;<br />
• Monitor mental health and substance use, and institute a national programme for screening for<br />
depression (such as the TaskForce for Prevention in USA).<br />
136
Chapter 13. Housing poverty and children<br />
Alan Johnson 91<br />
Introduction<br />
Outside of the five-yearly censuses, New Zealand is bereft of data on the housing position of children.<br />
This information gap exists because there is no other officially collected information to determine or<br />
estimate who is living where and with whom. We know quite accurately how many children there are<br />
in New Zealand and not so accurately where they go to school or pre-school, but between censuses<br />
we have no reliable way of knowing what sort of house they live in and how many people share their<br />
homes. The cancellation of the 2011 Census on account of the second Christchurch earthquake of<br />
course compounds this information gap.<br />
This chapter attempts to assess the extent of housing-related poverty in New Zealand, especially as<br />
this poverty affects children and their families. Much of the available data on children and housing<br />
is taken from the 2006 Census, but, given the extent of mobility of households, especially poor and<br />
young households, it would be unwise to rely on this data to paint an accurate picture of children’s<br />
housing position today. The 2006 Census does, however, provide a flavour of how housing fortunes<br />
or misfortunes are distributed amongst New Zealand families and children. There is little reason<br />
to suggest that this distribution has changed much, at least in relative terms, since 2006. For this<br />
reason data from the 2006 Census is presented here.<br />
This chapter also reviews other, more recent data, which provides some possible insights into the<br />
housing position of New Zealand’s poorest households, most of which have an over-abundance of<br />
children. As we shall see below, housing is a significant contributor to the financial stress experienced<br />
by low-income households, so it seems useful to consider data on recent changes in such things<br />
as housing affordability as an indicator of what is happening to these households. Some attention is<br />
also paid here to problems of residential mobility and of the resulting transience of children through<br />
schools.<br />
The final part of this chapter considers five key factors which have or are likely to have a major impact<br />
on the housing future which the poorest children in New Zealand are likely to face over the next one<br />
or two decades.<br />
What does the 2006 Census tell us about children’s housing?<br />
The 2006 Census identified the following outcomes for children’s housing:<br />
1. While 33% of all households rent their homes, children are over-represented in tenant households<br />
with 39% (James & Saville-Smith, 2010, p. 32) of all children living in tenant households. Tenant<br />
households move more frequently than owner-occupiers, thus their children are more likely to<br />
shift frequently. This shifting around disrupts schooling especially for a small number of families<br />
which might be described as itinerant given the frequency of their relocation.<br />
2. Perhaps as many as 80,000 children aged 14 or under were living in temporary or makeshift<br />
housing. Amongst children aged younger than 10 years, just over 9% were reported as living in<br />
such accommodation (James & Saville-Smith, 2010, p. 42).<br />
91 Alan Johnson is Senior Policy Analyst for the Salvation Army Social Policy and Parliamentary Unit, and co-convenor of<br />
<strong>Child</strong> <strong>Poverty</strong> <strong>Action</strong> <strong>Group</strong> Inc. Aotearoa.<br />
137
3. Ten percent of people overall were living in houses which, according to accepted occupancy<br />
standards, 92 required at least one more bedroom. This level of overcrowding is about the same<br />
as that reported in the 2001 Census but is less than back in 1986. In 2006, however, children<br />
were more likely to live in overcrowded houses than adults and especially older adults. The 2006<br />
Census reports that 17% of children aged under 10 years and 15% of children aged 10 to 14<br />
years lived in overcrowded housing.<br />
4. More detailed analysis of this overcrowding data shows that overcrowding was particularly<br />
concentrated in a small proportion of neighbourhoods and communities. For example the poorest<br />
10% of census area units 93 in Auckland (mostly in South Auckland) comprised 9.7% of that<br />
region’s population, 14.2% of its children, 35% of the region’s overcrowded households, and 37%<br />
of Auckland children living in overcrowded households. These same Auckland neighbourhoods<br />
comprised just over 3% of New Zealand’s population and just under 5% of its children but over<br />
14% of the country’s crowded houses and nearly 15% of all children living in crowded houses.<br />
Housing costs and poverty<br />
Housing costs aggravate the poverty experienced by low-income households and especially lowincome<br />
households with children. Table 13.1 below summarises data from recent analysis of Statistics<br />
New Zealand’s Household Economic Survey (HES) (B Perry, 2010, pp. 86-87, Table F.5 and F.6).<br />
Table 13.1. Proportion of children below various poverty thresholds – before & after housing costs<br />
Threshold type Constant value Relative to contemporary median<br />
50%<br />
2007 median<br />
60%<br />
2007 median<br />
50% contemporary<br />
median<br />
60% contemporary<br />
median<br />
BEFORE HOUSING COSTS<br />
2004 16% 30% 14% 26%<br />
2007 13% 20% 13% 20%<br />
2009 8% 14% 11% 19%<br />
AFTER HOUSING COSTS<br />
2004 22% 31% 19% 28%<br />
2007 10% 22% 16% 22%<br />
2009 10% 22% 18% 25%<br />
Although this analysis makes a fairly rudimentary allowance for housing costs in assessing the impact<br />
of housing costs on poverty rates, 94 the overall impact of allowing for housing costs is that poverty<br />
rates increase more or less regardless of the poverty indicator or threshold used. For example, once<br />
housing costs are allowed for, a commonly used 60% of constant value median equivalent household<br />
income for 2009 shows an increase of 8% in child poverty rates. This increase represents over<br />
80,000 children.<br />
92 This standard is the Canadian Crowding Index see Ministry of Social Development (2010b, p. 70).<br />
93 The poorest 10% of census area units has been identified here by those CAU’s with the highest rate of benefit dependency.<br />
Data for this analysis was supplied as a customized data set by Statistics New Zealand and is taken from raw data from<br />
the 2006 Census.<br />
94 For example the allowance made for housing is simply to deduct 25% of the before housing cost household income as<br />
an allowance for housing (see B Perry, 2010, pp. 18-19, 30). Housing costs are often considerably higher than 25% of<br />
household income especially for low-income households.<br />
138
Not surprisingly tenant households are generally younger and poorer than owner-occupier households<br />
and the extent of this difference is well demonstrated in Table 13.2 below which is taken directly from<br />
Perry (2010, p. 97, Table G5A).<br />
Table 13.2. Proportion of individuals under 65 in low-income households * by housing tenure<br />
1992 1994 1996 1998 2001 2004 2007 2009<br />
Owned or FT without mortgage 14% 12% 13% 8% 12% 12% 12% 6%<br />
Owned or FT with mortgage 30% 30% 27% 21% 24% 16% 14% 11%<br />
Rented – private 39% 46% 41% 44% 40% 38% 29% 27%<br />
Rented – HNZC or local authority 68% 71% 71% 66% 56% 51% 36% 39%<br />
TOTAL ( all under 65) 30% 31% 28% 26% 26% 24% 18% 15%<br />
* Threshold used is after housing costs 60% of 2007 medium equivalent household income.<br />
Recent changes in housing affordability<br />
There are two ways of measuring housing affordability: by how much housing costs to buy or to rent,<br />
and by how much households pay for their housing. The two approaches will not always produce<br />
similar results, partly because the rental and ownership markets work to different dynamics as shown<br />
below; and partly because the cost and affordability of housing is mediated by the way households<br />
form and by changes in these formed households’ incomes.<br />
Some estimates of housing affordability in terms of the proportion of household income spent on<br />
housing are made from data collected from the HES, but given the sample sizes in this survey, and<br />
the often small numbers of respondents in some sub-categories (for example ethnicities and types of<br />
household), the results often have wide margins of error (Perry, 2010, p. 23).<br />
Table 13.3. Proportion of individuals in households with housing cost OTIs greater than 30%<br />
(Source: Perry, 2010, p. 50, Table C.3)<br />
AGE GROUP<br />
0-17 18-24 25-44 45-64 65+ ALL<br />
1988 12% 12% 15% 5% 3% 11%<br />
1990 16% 16% 18% 7% 2% 14%<br />
1992 22% 21% 24% 8% 3% 18%<br />
1994 27% 22% 28% 10% 5% 22%<br />
1996 32% 24% 28% 14% 6% 24%<br />
1998 33% 26% 31% 14% 7% 26%<br />
2001 32% 29% 28% 16% 7% 25%<br />
2004 26% 28% 25% 15% 6% 22%<br />
2007 32% 29% 33% 19% 9% 27%<br />
2009 37% 24% 35% 21% 8% 28%<br />
This potential for error notwithstanding, Table 13.3 above estimates the proportion of individuals<br />
living in households where housing outgoings to incomes (OTIs) exceed 30% (that is, housing costs<br />
are 30% or more of household income). This OTI over 30% is used as an indicator of the proportion<br />
139
of households experiencing financial stress on account of housing costs. Table 3 provides this data<br />
for various age groups and this data shows how children (and their parents or caregivers within the<br />
25–44 age group) are more likely than other age groups to be living in households experiencing<br />
housing-related financial stress. Table 13.3 also shows how this stress has grown since 2004.<br />
On first appearances the data in Table 13.3 is not entirely consistent with more direct comparisons<br />
of housing affordability changes which are measured either by rents and house prices, or by a<br />
comparison of these with incomes. For example, Figure 13.1 below records relative changes in<br />
wages in the service sector with the average rent paid across New Zealand for a two-bedroom<br />
house. The relativity in this graph is expressed as a ratio of the number of hours at the mean wage<br />
(accommodation, café and restaurant sectors) that it would take to pay the mean rent for a twobedroom<br />
house. The trend over a period of five years is that there is a close association between<br />
wages and rents, in other words, rents are not getting more expensive in relation to wages.<br />
Figure 13.1. Rent affordability 2005-2010 95 (hours of work at average wage required to pay rent)<br />
Hours of work in service sector job required to pay median rent for<br />
two bedroom house<br />
20<br />
19<br />
18<br />
17<br />
16<br />
15<br />
14<br />
13<br />
12<br />
11<br />
10<br />
Dec-05 Jun-06 Dec-06 Jun-07 Dec-07 Jun-08 Dec-08 Jun-09 Dec-09 Jun-10 Dec-10<br />
Quarter ended<br />
This data on average wages and rents is combined with estimates of benefit and Working for Families<br />
(WFF) entitlements to estimate the housing outgoings to incomes for two hypothetical households. 96<br />
The first household is a solo parent working fulltime in the service sector (at the average wage) with<br />
two children aged under 13 who receives full entitlements to WFF tax credits plus the Accommodation<br />
Supplement. The second is a solo parent with two children aged under 13 in receipt of the Domestic<br />
Purposes Benefit (DPB) and WFF and Accommodation Supplement entitlements. A comparison of<br />
their relative positions is shown in Figure 13.2.<br />
95 Data sources to generate this ratio are the mean hourly wage for Accommodation, Café and Restaurant sector workers<br />
from the Quarterly Employment Survey from Statistics New Zealand and mean rent for a two-bedroom house as published<br />
by the Department of Building and Housing from its Tenancy Bond service.<br />
96 This data covers the period since the introduction of the WFF packages in March 2006.<br />
140
Figure 13.2. Housing outgoings to incomes for two solo-parent households<br />
60%<br />
Solo parent with two children on DPB<br />
Housing costs as & of disposable household income<br />
50%<br />
40%<br />
30%<br />
20%<br />
10%<br />
Working solo parent with two children in low wage job<br />
0%<br />
Jun-06 Dec-06 Jun-07 Dec-07 Jun-08 Dec-08 Jun-09 Dec-09 Jun-10 Dec-10<br />
Quarterly<br />
Clearly, because of the additional support offered through the In-Work Tax credit, the working<br />
household has a significantly lower housing outgoings to income percentage than the household<br />
reliant entirely on the DPB and other assistance. What is noticeable with the data graphed on Figure<br />
13.2 is how constant these two housing cost-to-household income ratios have been over time.<br />
Housing on the basis of this data does not appear to be getting more expensive although it is already<br />
so expensive for a solo parent on a DPB that it is unlikely he or she could afford it all.<br />
Noticeable about the data in Figure 13.2 is that even the better-off working households would<br />
still fall within the over 30% of household income threshold adopted in Table 13.3. The fact that a<br />
household which is working full-time in a low-paid job and which is receiving three income top-ups<br />
from government can still be living with housing-related financial stress points to the vulnerability of<br />
many households to this threat.<br />
This vulnerability might explain the apparent rise in housing-related financial stress as demonstrated<br />
in Table 13.3, which contradicts the data offered in Figures 13.1 and 13.2 which show no discernible<br />
trend in rented housing becoming less affordable. Many households, especially those with children,<br />
are just on the margin of coping with housing costs. Small events such as loss of a part-time job<br />
or overtime hours can push them into problems of housing-related financial stress. Such potential<br />
and actual events may explain the increasing housing-related financial stress reported in Table 13.3<br />
against the background of quite stable rent-to-income ratios shown in Figures 13.1 and 13.2.<br />
141
<strong>Child</strong>ren and residential mobility<br />
The relationship between housing stress and residential mobility is not clearly understood although it<br />
is apparent that tenants move more frequently than owner-occupiers; 97 that households with children<br />
are slightly more mobile that households with no children; 98 and poorer households with children are<br />
more mobile than non-poor households with children. 99<br />
Outside of another census the extent and nature of any change in residential mobility patterns of<br />
New Zealand households is difficult to guess. There is, however, some evidence to suggest that the<br />
mobility of tenant households is slowing while the slow-down in house sales as a result of the global<br />
recession would suggest a decline in mobility amongst owner-occupiers as well (Hargreaves, 2011).<br />
There is mixed evidence of the impact of residential mobility on children. Bull and Gilbert (2007) for<br />
example found no statistically significant difference in either the rate of attendance at school or the<br />
academic achievement of students who were highly mobile. Other commentators, however, suggest<br />
that a general pattern is that very mobile students have poorer social and emotional well-being and<br />
are less successful at school for a variety of reasons some of which relate to how schools cope with<br />
inducting new students and some of which are to do with students fitting in and finding new friends<br />
(Auld, 2006; A. Lee, 2002).<br />
There is some clearer New Zealand-based evidence of the health effects of high mobility and<br />
transience of children. These effects included the perhaps predictable higher levels of emotional and<br />
behavioural problems associated with shifting around often but also include such things as increased<br />
rates of teenage depression, greater risk of teenage pregnancy and earlier initiation into illicit drug<br />
use (Jelleyman & Spencer, 2008).<br />
What of the future for housing?<br />
It is difficult to be optimistic about the future for affordable housing in New Zealand given a handful<br />
of background factors or issues which together amount to a generational challenge for younger New<br />
Zealanders to overcome over the next one or two decades. It remains to be seen whether or not they<br />
choose to accept this challenge, or simply move to Australia and leave our current housing legacy<br />
for mum and dad to live with.<br />
This housing legacy has at least five dimensions. They are seldom mentioned together but they all<br />
need to be tabled for public debate around their combined impact on future housing provision for<br />
low-income New Zealanders. These five dimensions are as follows:<br />
A housing bubble which has not burst<br />
Despite many suggestions that New Zealand housing is overpriced and predictions that we will see<br />
a price adjustment sometime soon, this day of reckoning has not come even as the world goes<br />
97 In the Department of Building and Housing’s 2005/08 Statement of Intent (2005) it is stated: Tenancies have a high<br />
turnover, with the average duration of all tenancies that ended in the year ending 31 December 2002 being less than<br />
15 months. More than half of all tenancies in that year ended within 10 months, 33% within 6 months and 13% within 3<br />
months. Māori households tend to be over-represented in areas with a higher proportion of short-term tenancies.<br />
98 The 2006 Census shows that children generally have slightly higher rates of residential mobility than other age groups<br />
within the population: 37% of children aged five to 14 were living at the same residence they were in five years ago<br />
compared to 40% of the total population. Source Statistics New Zealand table builder website at http://www.stats.govt.nz/<br />
tools_and_services/tools/TableBuilder/2006-census-pop-dwellings-tables.aspxt<br />
99 Lee’s (2002) report of a 1999 study of students at high- and low-decile intermediate schools found that the percentage<br />
of students from decile 1 schools who had attended at least three schools in one year during their school career ranged<br />
from 4.4% to 17.2% while the proportion of such students from decile 9 and 10 schools varied between 0.4% and 5.4%.<br />
142
through a major recession. Figure 13.3 below illustrates this point. While house prices relative to<br />
household incomes have declined since the heady days of late 2007 before the recession, they<br />
have not returned to levels of a decade or so ago. In terms of affordability this might be as good as<br />
it gets for new home buyers. Aucklanders may have to get used to having to spend nine years of an<br />
average salary on a house, while other New Zealanders may always face the prospect of medium<br />
house prices which are six to seven years of an average wage or salary income. The worrying thing,<br />
especially for Auckland, is that even at these prices few people are interested in building new houses<br />
for a still-growing population.<br />
Figure 13.3. Years to purchase median-priced house with average weekly wage 100<br />
12<br />
Years to purchase mediam priced house at average weekly wage<br />
10<br />
8<br />
6<br />
4<br />
2<br />
Auckland Region<br />
New Zealand<br />
0<br />
Dec-02 Dec-03 Dec-04 Dec-05 Dec-06 Dec-07 Dec-08 Dec-09 Dec-10<br />
Quarters<br />
A legacy of housing-related debt<br />
At the end of 2000, housing-related debt was $66 billion or 56% of GDP. At the end of 2010 New<br />
Zealanders owed $171 billion in housing-related debt, equivalent to 88% of gross domestic product.<br />
Clearly there has been a structural shift in how New Zealanders choose to hold assets as, in 2000,<br />
83% of New Zealanders’ financial assets were tied up in housing whereas by the end of 2010 this<br />
figure had risen to 97%. 101 The repayment of this debt over the next two decades will not only place<br />
a significant burden on the economy, but comes at a period when baby-boomers may be cashing<br />
up their property assets for retirement spending. Such a sell-down will be balanced by the threat of<br />
a general decline in property markets which will, of course, diminish values and realisable wealth<br />
on one side of the ledger, while on the other side making housing more affordable for a younger<br />
generation.<br />
If such a sell-down does not occur and if the baby-boomers go to the grave or crematorium with their<br />
overpriced housing assets, the following generations will inherit the debt as well as the asset. It is<br />
possible that the New Zealand economy could grow into its housing debt, so debt levels remain fairly<br />
constant in nominal terms and house prices decline in real terms, hence housing debt as a proportion<br />
of GDP declines over the next decade or two. Such a scenario will see a fairly painless adjustment<br />
over an extended period, but may well see the construction of new housing remain subdued, perhaps<br />
leading to unmet housing need for lower-income households.<br />
100 House price data is based on quarterly medians taken from the Real Estate of New Zealand’s website at https://www.<br />
reinz.co.nz/reinz/public/market-information/market-information_home.cfm.<br />
101 Data from Reserve Bank of New Zealand website at http://www.rbnz.govt.nz/statistics/az/2989613.html and specifically<br />
Table C6 Total Household Claims and Households Financial Assets and Liabilities.<br />
143
A looming housing shortage in Auckland<br />
Recent population growth in Auckland, and Statistics New Zealand’s sub-national population<br />
forecasts both suggest that around half of New Zealand’s population growth will occur in Auckland.<br />
However, over the past five years Auckland’s share of new house building has been just under one<br />
quarter of the national total. Since late 2008 the gap between consents for new dwellings in Auckland<br />
and the number of additional dwellings required to cater for the region’s population growth 102 has<br />
been around 1,000 per quarter.<br />
The historical trend of new housing demand and supply in Auckland is provided in Figure 13.4. The<br />
data for this figure is from Statistics New Zealand’s sub-national population estimates and forecasts,<br />
and from that agency’s new building consents reports. This data indicates that the shortage of<br />
housing in Auckland over the past three years is over 11,000 dwellings. This deficit is more than the<br />
wildest estimates of the number of homes destroyed in the Christchurch earthquakes, yet Auckland’s<br />
housing problems barely rate a mention in media comment or in the Government’s priorities. Perhaps<br />
even more alarming is a Government agency’s forecast that Auckland could be short 90,000 houses<br />
over the next 20 years (Department of Building and Housing, 2010, pp. 66-67, Table 64.62).<br />
Figure 13.4. New housing supply and demand in Auckland Region<br />
4,000<br />
3,500<br />
3,000<br />
2,500<br />
Dwellings<br />
2,000<br />
1,500<br />
1,000<br />
500<br />
0<br />
Sep-03 Mar-04 Sep-04 Mar-05 Sep-05 Mar-06 Sep-06 Mar-07 Sep-07 Mar-08 Sep-08 Mar-09 Sep-09 Mar-10 Sep-10 Mar-11<br />
Quarters<br />
The Christchurch Earthquake<br />
The Prime Minister has made unofficial estimates that as many as 10,000 houses will need to be<br />
rebuilt as a consequence of the Christchurch earthquake (Watkins, 2011), although these estimates<br />
have subsequently proved to be little more than speculative (Interest.co.nz, 2011). Despite official<br />
denials that this is the number of homes destroyed in the earthquake, there have to date been no<br />
official estimates of what this figure actually is. A preliminary estimate is that 5,100 houses will need<br />
to be demolished while the fate of a further 10,500 houses in the so-called ‘orange zone’ is still to be<br />
decided (NZPA, 2011a).<br />
102 This estimate of new dwellings required is based on Statistics New Zealand’s sub-national population estimates and<br />
forecasts and on the 2006 Census’ reported average household size for Auckland. This average household size was just<br />
under three people per house and estimates and forecasts of Auckland population suggest annual growth of between<br />
21,000 and 23,000 people. In other words Auckland requires an additional 7,000 to 7,600 houses per year just to maintain<br />
household sizes at the reported 2006 average.<br />
144
Treasury has made broad estimates that the cost of the Christchurch earthquakes could be in the<br />
order of $15 billion, of which around $9 billion is in damage to residential properties. It also estimates<br />
that the earthquakes will reduce economic growth by around 1.5% of GDP and that as the recovery<br />
gets under way there will be price pressures in the construction sector and elsewhere (The Treasury,<br />
2011). The Minister of Finance, in a speech to the Wellington Employers Chamber of Commerce<br />
in April 2011 (Bill English, 2011), estimated that the earthquake will cost Government $8.5 billion<br />
directly including $3 billion in lost tax revenue and $5.5 billion to replace damaged governmentowned<br />
buildings such as schools and hospitals, and to support the Earthquake Commission. Mr<br />
English acknowledges in this speech that these costs are not unmanageable, but will delay progress<br />
in other areas such as deficit and debt reduction.<br />
Leaky buildings<br />
It appears that the best and most recent estimate of the extent and cost of leaky buildings is that<br />
done by PriceWaterhouse Cooper (2009). This report suggests that the number of buildings likely to<br />
suffer weathertightness failures could be as high as 110,000, and that there is an expert consensus<br />
of around 42,000 such failures. They estimate the costs of this number of failures at $11.3 billion<br />
(in 2008$s). They also expect the building owners to suffer 69% of this cost and local government<br />
to face 25% of the cost or perhaps as much as $3 billion. The builders responsible for the failing<br />
buildings, and the Government which was responsible for building regulation reforms which allowed<br />
the now discredited building practices, face 4% and 2% of the costs respectively.<br />
Government, through the Department of Building and Housing, is offering owners of leaky buildings<br />
a financial assistance package which will see it and local councils each contributing 25% of the<br />
repair costs. This assistance excludes the transaction costs prior to making a claim and covers only<br />
buildings found to be leaking up to 10 years after their construction. It seems likely that owners will<br />
bear more than half of the total costs of the leaky homes fiasco even with this financial assistance<br />
from Government.<br />
Of some concern is how the building owners will meet their share of these costs, however much<br />
these are. It is possible that many of these costs, as well as the underlying problems, are yet to be<br />
discovered and so may fall outside the 10-year liability period which covers local government and<br />
builders’ liabilities. It seems likely that as these buildings fail they will quickly lose value and that this<br />
failure and loss of value will blight whole building developments and perhaps whole communities.<br />
Until these buildings are demolished or completely abandoned, someone will have the misfortune<br />
of living in them. If housing markets work as they can be expected to, the people living in leaky and<br />
decaying buildings will be the poor, including poor children.<br />
Conclusions<br />
Perhaps the most disappointing thing right now is that there does not appear to be within our national<br />
consciousness either the insight to see what these problems mean for our children, or the courage<br />
to accept that children and their housing require greater priority from us all. The five problems in<br />
housing have been identified as: a housing bubble which has not burst; and a consequent legacy<br />
of housing related debt; a looming housing shortage in Auckland; the Christchurch Earthquake; and<br />
leaky buildings.<br />
The failure to provide poorer New Zealand children with adequate and affordable housing looms<br />
as the single biggest social failure of both recent Governments and of those set to take power<br />
145
over the next decade. The present market and policy settings offer little if any hope for a change<br />
to our present housing pathway. ’<strong>Child</strong>ren’, and ’housing for low-income families’ do not register<br />
as important enough priorities to demand national attention. <strong>Further</strong>more, the central role which<br />
inadequate housing plays in poor health and education outcomes for children is well understood, but<br />
this link is not being honestly acknowledged by those in Government who profess concern for such<br />
poor outcomes.<br />
The challenges we face in ensuring that every young New Zealander lives in a decent quality house<br />
are enormous and cannot be under-estimated. The problems we are now facing in housing were at<br />
least 10 years in their making. This suggests that we can only expect to make progress over a similar<br />
or longer period. There are seldom quick and cheap answers to long-term structural problems.<br />
Recommendations<br />
• That research be undertaken by NGOs, universities and government agencies to more closely<br />
establish the relationship between inadequate housing and the poor health and educational<br />
outcomes being achieved for many New Zealand children;<br />
• The Government develop and fund a national housing plan to address the emerging housing<br />
shortages identified by the Department of Building.<br />
146
Chapter 14. The impact of social hazards on<br />
children<br />
Julie Timmins, 103 M. Claire Dale 104 and Donna Wynd 105<br />
Introduction 106<br />
Legal social hazards, including gambling, tobacco, alcohol, and high-priced debt, are strongly<br />
associated with family poverty. Social hazards impact most seriously on the lives of people whose<br />
financial situation limits the choices they can make to avoid or escape them. It is ironic that, for<br />
people in hardship, social hazards present an opportunity (albeit usually misguided) to improve their<br />
situation (gambling and using loan sharks), or to ameliorate the stress in their lives.<br />
Equally, children and adolescents living in households affected by social hazards can adopt unhealthy<br />
behaviours to cope with the worries they experience. The impact on family finances of social hazards,<br />
especially where addiction is present, is well-documented, and increasingly the public health burden<br />
of these hazards for individuals and the community is being recognized. For example, the recent<br />
report from the Prime Minister’s Chief Science Advisor, Sir Peter Gluckman, “Improving the Transition:<br />
Reducing Social and Psychological Morbidity during Adolescence”, recognized the need for policies<br />
to consider the potential impacts on adolescent well-being, even when the policies are not obviously<br />
related to that group (Gluckman & Hayne, 2011, p. 18).<br />
Social hazards play a considerable role in entrenching<br />
If children, the most vulnerable members<br />
family poverty. It is not enough for governments to limit<br />
of our society, are to be protected from the<br />
the harm from social hazards; they must act decisively effects of social hazards such as gambling,<br />
with policies which actively seek to protect children. Key tobacco, alcohol, and high-priced debt,<br />
to the proliferation of social hazards in New Zealand the government must make greater efforts<br />
has been lifting restrictions on access, for example to support families and communities, and<br />
reduce access to these hazards.<br />
the liberalisation of liquor licensing laws. Communities<br />
have responded by demanding greater input into the<br />
accessibility of social hazards in their neighbourhoods, demands only reluctantly being met by the<br />
legislature and local authorities.<br />
In general, industry self-regulation has been the preferred method of regulation for governments<br />
who are themselves ‘addicted’ to the tax revenue from social hazards. Yet industry self-regulation<br />
has proved inadequate, and the operations of industry players have proved difficult to regulate. The<br />
Australian Productivity Commission (APC) commented on the difficulties faced in executing policy in<br />
this area (2011):<br />
Opposition to genuinely ‘good’ policy — policy that makes the community as a whole better off<br />
— is actually quite common. It can be the result of ignorance or interests. The former is an<br />
easier obstacle to overcome than the latter, since it will generally suffice to be able to explain<br />
103 Julie Timmins, the Co-ordinator for <strong>Child</strong> <strong>Poverty</strong> <strong>Action</strong> <strong>Group</strong>, was a founding member.<br />
104 Dr M.Claire Dale is Research Fellow with the Retirement Policy and Research Centre at the University of Auckland, and<br />
a researcher and policy analyst for <strong>Child</strong> <strong>Poverty</strong> <strong>Action</strong> <strong>Group</strong>.<br />
105 Donna Wynd is a spokesperson and research and policy analyst for <strong>Child</strong> <strong>Poverty</strong> <strong>Action</strong> <strong>Group</strong>.<br />
106 Particular thanks to George Thomson, Senior Research Fellow, Department of Public Health, Te Tari Hauora Tumatanui,<br />
University of Otago, Wellington; Professor Doug Sellman, Director of the National Addiction Centre at the University of<br />
Otago, Christchurch and media spokesperson for Alcohol <strong>Action</strong> new Zealand; and Hannah Thorne, Research Officer,<br />
Gambling and Addictions Research Centre, Auckland University of Technology, for their contributions to this chapter.<br />
147
or demonstrate the benefits of the proposed policy action. Disarming the opposition of special<br />
interests is a lot harder. This is because evidence of public benefit will rarely ameliorate the<br />
reason for their opposition — namely, expectation of private loss or disadvantage.<br />
The APC found social hazards in particular are sectors where the implementation of good social<br />
policy is extremely difficult due to entrenched vested interests. The New Zealand experience is<br />
showing that the longer those vested interests are unchallenged at the level of national policy,<br />
the more difficult they are to overcome. Lobbying by gambling trusts, a faux grassroots campaign<br />
opposing legislation aimed at banning cigarette displays, and a timid official response to the Law<br />
Commission’s report on alcohol in New Zealand all point to the difficulty in reining in social hazards<br />
once they are established in the community.<br />
Focus in this chapter is on the legal social hazards of tobacco, alcohol, gambling and loan sharking<br />
practices.<br />
Tobacco<br />
Tobacco is the only legally available consumer product which kills people when used entirely as<br />
intended (Walton, Barondess, & Lock, 1994).<br />
Of all the social hazards considered in this chapter, smoking has the most direct impact on the<br />
physical health of children and their caregivers. It is estimated that 4,500 to 5,000 deaths per year in<br />
New Zealand can be attributed to tobacco use (Ministry of Health, 2009c). <strong>Child</strong>ren and babies are<br />
unable to escape from exposure to tobacco, either in the womb or when they are reliant on the care<br />
of their families. <strong>Child</strong>ren must be protected from harm by policies that move to eliminate tobacco<br />
from society.<br />
In New Zealand, there has been considerable progress in controlling tobacco, beginning with<br />
the Smokefree Environments Act in 1990. Other significant initiatives include the end of tobacco<br />
sponsorship of events; the launch of Quitline, and of Aukati Kai Paipa, the Māori smoking cessation<br />
programme; and the mandatory graphic warnings on cigarette packets. The most effective deterrent<br />
to smoking is an increase in price: recent tax increases on tobacco<br />
in 2010 and 2011 have led to significant decrease in tobacco sales<br />
(Johnston, 2011). 107<br />
At the time of writing, the Smoke-free Environments (Controls and Enforcement) Amendment Act has<br />
been passed into law. This bans retail tobacco displays and increases enforcement of restrictions on<br />
the sale of tobacco. Yet it is clear a great deal more needs to be done if New Zealand is to be smokefree<br />
by 2025 (Maori Affairs Select Committee, 2010).<br />
Impact on children<br />
Foetal and infant health<br />
Smoking is the biggest preventable cause of foetal and infant ill health including low birth weight,<br />
and death.<br />
• Smoking during pregnancy is associated with a 25% increased risk of miscarriage;<br />
107 This creates a unfortunate dilemma around the imposition of further hardship on low-income people addicted to tobacco<br />
as recent research published by the Prime Minister’s Science Advisor implicates economic hardship and its adherent<br />
stresses in the adoption of smoking behaviour (Gluckman & Hayne, 2011, Chapter 18).<br />
148
• On average smokers have babies that are 200–250g lighter than non-smokers;<br />
• Low birth rate is associated with increased risk of illness and death in infancy;<br />
• Smoking during pregnancy increases the child’s risk of pneumonia, asthma and glue ear (Tuohy,<br />
2008);<br />
• Babies of smoke-free fathers are a safer weight at birth and have a lower risk of SIDS (Ministry<br />
of Health, 2000).<br />
In New Zealand during 2003–2007, 328 infants (aged 4 weeks to 52 weeks) died as the result of<br />
SUDI Sudden Unexpected Death in Infancy – 75% of the mothers of these infants were known to<br />
have smoked tobacco (<strong>Child</strong> and Youth Mortality Review Committee Te Rōpū Arotake Auau Mate o<br />
te Hunga Tamariki Taiohi, 2009).<br />
Effect of second-hand smoke<br />
The effect of passive smoking or second-hand smoke (SHS) on children’s health is well researched<br />
and documented, yet public policy has been slow to act on that knowledge. In the US, the Surgeon<br />
General has concluded that there is no risk-free level of SHS exposure. <strong>Child</strong>ren are much more<br />
vulnerable than adults to the damage from SHS as their bodies are still developing. Babies are<br />
particularly vulnerable as they are held close and often receive the full impact of exhaled smoke.<br />
Second-hand smoke is known to be a causal factor in:<br />
• Middle ear infection (including glue ear);<br />
• Respiratory illnesses (croup, bronchitis, bronchiolitis and pneumonia);<br />
• The onset of asthma and worsening of asthmatic symptoms (Environmental Protection Agency,<br />
1993).<br />
Research has shown that a reduction in SHS in American homes was associated with fewer cases of<br />
middle ear infection. It clearly shows that if parents can stop smoking at home their children are far<br />
less likely to suffer from this disease and its effects (Alpert, Behm, Connolly, & Kabir, 2011).<br />
The relationship between SHS and children’s mental health has also recently been investigated<br />
by researchers in the United States. The researchers found that, on average, children exposed to<br />
second-hand tobacco smoke exhibited some symptoms of depressive disorder, ADHD, generalized<br />
anxiety disorder and conduct disorder (Bandiera, Richardson, Lee, He, & Merikangas, 2011).<br />
Smoke-free areas for children<br />
There is widespread public consensus that children should be protected from SHS. Studies have<br />
shown that over 90% of New Zealanders support the right for people to live in a smoke-free<br />
environment; and 90% of smokers agree that it is not okay to smoke around children (Thomson,<br />
Wilson, & Edwards, 2009).<br />
Smoking in cars exposes all passengers to dangerous levels of toxins. These are particularly<br />
dangerous for children who have smaller airways. A number of states in Australia, Canada and the<br />
USA have brought in legislation banning smoking in cars when children are passengers. There is<br />
evidence that this reduces children’s exposure to second-hand smoke while travelling in cars: the<br />
2007 smoke-free vehicle law in South Australia resulted in an increase in smoke-free vehicles with<br />
children from 69% in 2005 to 82% in 2008 (Hickling, Miller, & Hosking, 2009).<br />
149
In New Zealand there is widespread support across all groups, and from smokers themselves, for<br />
banning smoking in cars when small children are present. This includes a high level of support<br />
for requiring smoke-free cars for pre-school children (Thomson, et al., 2009; Thomson, Wilson,<br />
Weerasekera, & Edwards, 2008).<br />
Despite this, a recent study confirms that most parents continue to expose their children to dangerous<br />
levels of second-hand smoke in cars (Nabi et al., 2011). Banning smoking in cars when children are<br />
present is the only way to protect them from this harm.<br />
Normalisation of smoking<br />
The ready availability of tobacco creates a false impression for children that smoking is ‘normal’<br />
behaviour. This is not the case at all as most people (around 80%) do not smoke and of those who<br />
do smoke, two-thirds would like to quit. Only around 5% of adult New Zealanders actually want to<br />
be smokers. Overt marketing of tobacco products, and exposure to adult smoking, results in young<br />
people vastly overestimating how many people smoke.<br />
Peer group and the wider social context of children and teens are key factors in determining whether<br />
they become smokers. Parental smoking is also a key risk factor for young people becoming smokers<br />
later in life, with teenagers being more likely to smoke if one or both parents smoke. The proportion of<br />
students who smoke daily but report that neither parent smokes is 3%, compared to 20% of students<br />
in homes where both parents smoke. Even having just one parent who smokes triples the risk of a<br />
student being a daily smoker, with 10% of students who smoke daily reporting one parent who is a<br />
smoker (The Smokefree Coalition, undated).<br />
To protect children and young people, smoking must be seen as aberrant behaviour. To make tobacco<br />
seem less ‘normal’, there needs to be stronger community support for smoking cessation. In addition,<br />
locations where young people are present must be smoke-free, including homes, meeting places<br />
and other environments, particularly cars.<br />
Alcohol<br />
Alcohol is New Zealand’s most widely used recreational drug. The urban landscape is blighted with<br />
liquor advertisements. New Zealand’s drinking culture is supported and encouraged by alcohol being<br />
for sale 24 hours a day 7 days a week.<br />
The primary driver of the heavy drinking culture is the excessive commercialisation of alcohol.<br />
Two hundred thousand dollars a day is spent by the alcohol industry promoting alcohol to the<br />
population, especially young people, as the vehicle to a successful happy life, being part of the<br />
popular in-group and being sexually attractive. (Sellman, 2011)<br />
150
National drinking surveys have consistently shown around 25% of drinkers or 700,000 New<br />
Zealanders typically drink large quantities when they drink; and among young drinkers aged 15 to<br />
24, the rate is much higher, with 50% of them drinking this way. 108 This has led Alcohol <strong>Action</strong> to write:<br />
There is a national alcohol crisis. However, this crisis is under-recognized because we have<br />
become numbed by the unrelenting presence of alcohol-related problems. The national alcohol<br />
crisis has become our way of life. (Alcohol <strong>Action</strong> Website, n.d.)<br />
The evidence affirming the harm caused by alcohol is overwhelming. Concern around this issue led<br />
to the instigation of the New Zealand Law Commission (NZLC) leading a comprehensive review of<br />
the laws pertaining to the sale, supply and consumption of alcohol in New Zealand. In April 2010,<br />
the Royal Commission published the final Report on the review of the regulatory framework for the<br />
sale and supply of liquor, Alcohol In Our Lives: Curbing the Harm (NZLC, 2010). During the course<br />
of its investigation, the Commission received almost 3,000 submissions, the highest number ever<br />
received on a social issue. Despite the number of submissions received, and the comprehensive<br />
recommendations, the government remains reluctant to confront this social hazard with legislative<br />
changes.<br />
The Report draws heavily from the submission from the Office of the <strong>Child</strong>ren’s Commissioner (2011).<br />
109<br />
It gives a full picture of the social and economic costs to our society and pays particular attention<br />
to the impact on children. The Report leaves no doubt about the negative role alcohol plays in the<br />
lives of children, and leaves no doubt about the negative role alcohol plays in the lives of children<br />
(NZLC, 2010, pp. 91-93).<br />
In summary, it is clear from the preceding discussion that, from conception through to adolescence,<br />
exposure to alcohol has the potential both to cause and be associated with a range of negative<br />
outcomes for children. (NZLC, 2010, p. 91)<br />
Since the publication of the Law Commission’s report, the Chief Scientist has released a comprehensive<br />
report on children’s transition to adolescence which only adds to the concern about the health and<br />
social damage inflicted on young people by alcohol (Gluckman & Hayne, 2011, Chapter 19).<br />
Impacts on children<br />
The next paragraphs summarise the impacts on children that have been well canvassed in the 2010<br />
Law Commission report and associated submissions. It is of deep concern that knowledge about the<br />
damage of alcohol in the lives of children is given scant regard in policy design.<br />
Pregnancy<br />
We do not know what, if any, amount of alcohol is safe. But we do know that the risk of a baby<br />
being born with any of the foetal alcohol spectrum disorders increases with the amount of alcohol<br />
a pregnant woman drinks, as does the likely severity of the condition. And when a pregnant<br />
108 The Alcohol Advisory Council of New Zealand (ALAC) defines a quarter of adult drinkers in New Zealand as “binge<br />
drinkers” because they typically consume seven or more standard drinks per session. (One standard drink contains 10<br />
grams of pure alcohol.) The Ministry of Health’s Alcohol Use Survey 2007/08 defines someone who drinks large amounts<br />
of alcohol as a man who drinks more than six standard drinks or a woman who drinks more than four standard drinks on<br />
a typical drinking occasion. By this measure, the Alcohol Use Survey 2007/08 found: 25% of New Zealand drinkers aged<br />
12 to 65 years consumed large amounts of alcohol on a typical drinking occasion, as did 54% of 18-to-24-year-olds.<br />
109 See the OCC Submission at: http://www.occ.org.nz/__data/assets/pdf_file/0013/8050/CC_Alcohol_21.02.2011.pdf.<br />
151
woman drinks alcohol, so does her baby. Therefore, it’s in the child’s best interest for a<br />
pregnant woman to simply not drink alcohol. (Office of the U.S. Sugeon General, 2005)<br />
Although it is now recognised that no amount of alcohol consumption during pregnancy is safe, a<br />
disturbing number of New Zealand women still drink during this time (Parackal, Parackal, Harraway,<br />
& Ferguson, 2009). There are no long-term studies of the incidence of Foetal Alcohol Spectrum<br />
Disorder (FASD) in New Zealand, however, the widespread acceptance of drinking while pregnant<br />
would indicate this syndrome is not uncommon, and it is estimated that over 600 babies born year are<br />
affected by FASD (P. A. May & Gossage, 2001; Sampson et al., 1997). Its impact on the development<br />
of the baby in the womb is devastating with the main damage being to the central nervous system.<br />
Binge drinking during pregnancy is of particular concern with a recent study showing that the toxins<br />
built up in this behaviour can damage the DNA of unborn children beyond repair (Joenje, 2011).<br />
<strong>Child</strong>hood<br />
Alcohol abuse and the ready availability of alcohol impacts on children’s’ lives a number of ways.<br />
• Drinking in the immediate family environment, especially when linked to domestic violence;<br />
• The abuse and neglect of children;<br />
• The negative impact of alcohol on neighbourhood safety;<br />
• Early uptake of drinking among children and adolescents.<br />
The impact of harmful parental drinking has been well documented by the Office of the <strong>Child</strong>ren’s<br />
Commissioner (Office of the <strong>Child</strong>ren’s Commissioner, 2011). Alcohol <strong>Action</strong> have also written about<br />
the “collateral damage” suffered by New Zealand families because of harmful drinking (Alcohol <strong>Action</strong>,<br />
2011). Despite the developing knowledge of the neurological impact of alcohol, the liberalisation of<br />
regulations and the fiercely competitive alcohol market have led to higher rates of drinking among<br />
younger adolescents.<br />
After many submissions on the concern of the impact of alcohol, the Law Commission formed the<br />
view that a more cautious regulatory approach is necessary, given the strength of the new evidence<br />
regarding the risk to young people from the early initiation of drinking (NZLC, 2010). This advice, too,<br />
has been set aside by the Government.<br />
Vulnerable communities<br />
Alcohol plays a significant role in perpetuating the cycle of poverty (Cerda, Diez-Roux, Tchetgen,<br />
Gordon-Larsen, & Kiefe, 2010). It is a disturbing reality that alcohol is significantly more readily<br />
available in lower socio-economic neighbourhoods than in neighbourhoods of higher socio-economic<br />
standing (Hay, Whigham, Kypri, & Langley, 2009). For example, a recent University of Otago study<br />
found that the average distance a person had to travel to a liquor outlet was 50% greater in more<br />
affluent areas than the most deprived areas (Parackal, et al., 2009).<br />
Alcohol Advisory Organisation (2010) research found that off-licence outlets, including alcohol<br />
retailers, supermarkets and bottle stores, tended to locate in areas of high social deprivation and<br />
high population density. They also found that the addition of a single extra off-licence was associated<br />
with an extra 60 to 65 police events or incidents in the year to June 2009; each additional club or bar<br />
was associated with an extra 98 to 101 police events or incidents; and each additional restaurant<br />
152
or café was associated with an extra 24 to 29 police events or incidents (Alcohol Advisory Council<br />
(ALAC), 2010).<br />
Measures to increase the purchase price of alcohol, to restrict<br />
its marketing and availability, and to more tightly regulate drinkdriving,<br />
would reduce the considerable harm that excessive alcohol<br />
consumption does to New Zealand’s young people (Gluckman &<br />
Hayne, 2011).<br />
Alcoholism is hidden because<br />
it is legal – it’s swept under the<br />
carpet.<br />
(Girl aged 13, 2010)<br />
Gambling<br />
Whether you win credits or lose the spin, the pokie machine sits, like an electronic mugger,<br />
waiting for you to either cash up or play again. It waits, ready to sap every last dollar from your<br />
wallet. It cannot know who you are, or what you can afford. It knows not what you wear, or how<br />
long you’ve been there. Only you know what you really have to lose. (Gambling Watch, 2011)<br />
Table 14.1. Gambling in New Zealand 2010<br />
(Source: Department of Internal Affairs, 2010)<br />
Annual turnover in gambling<br />
Money lost in 2010<br />
Money lost per day<br />
Money lost on pokies<br />
Lottery Commission<br />
$15200 million<br />
$19000 million<br />
$ 5.2 million<br />
$ 849 million<br />
$ 347 million<br />
The addictive and destructive nature of gambling and its public health cost was formally recognized<br />
in New Zealand when the Ministry of Health was tasked with the funding and coordination of problem<br />
gambling services under the Gambling Act 2003, and assumed responsibility for this role on 1 July<br />
2004.<br />
Impact on children<br />
While the economic costs of gambling are well known, a report by the Centre for Social and Health<br />
Outcomes Research and Evaluation (SHORE) on the Socio-Economic Impacts of Gambling (2006)<br />
affirmed that the health and well-being impacts of gambling are also wide-reaching for gamblers and<br />
their family/whānau. More recently, surveys for the Ministry of Health (Casswell, 2008; Ministry of<br />
Health, 2009a) found that those gamblers who spend longer gambling on pokies rated themselves<br />
as being poorer parents/caregivers than those that gambled in other ways.<br />
<strong>Child</strong>ren often live in families on which enormous stresses are placed as a direct result of gambling.<br />
The burden of this may include witnessing family violence and perhaps crime. The Ministry of Health<br />
(2009a) found that one of the more significant ways in which excessive gambling has highly toxic<br />
effects on individuals, families, and the wider community, is gambling-related crime. The study<br />
showed that Māori and Pacific people are 2–3 times more likely to report experiencing problems due<br />
to someone else’s gambling. Research by the Salvation Army (Johnson, 2011b) found that, of their<br />
clients affected by gambling, approximately three-quarters had children directly affected by the loss<br />
of household income arising from gambling. This includes problem gamblers who report domestic or<br />
other violence related to their gambling. On average, the Salvation Army estimates 5–10 people are<br />
affected by the problem gambling of one person (Johnson, 2011b).<br />
153
Effects on parenting and caring<br />
In 2001, children of problem gamblers were reported to<br />
More than 140 children have been<br />
be two to three times more likely to be abused by both the<br />
abandoned in New Zealand casinos<br />
gambler and his or her spouse than their peers (Bellringer, in the last 2 years – but that could be<br />
Abbott, & Brown, 2009). Bellringer et al. (2009) conducted “the tip of the iceberg” when it comes to<br />
the first study of its kind worldwide, on behalf of the Ministry gambling-related child neglect.<br />
of Health, exploring the link between gambling (including<br />
(Leask, 2011)<br />
problem gambling) and unreported crime. Almost two-thirds<br />
of the 33 participants said their first gambling-related crime<br />
was in the same year as, or just a few years after, starting regular gambling. For those already<br />
engaging in crime, criminal behaviours started a few years prior to commencement of regular<br />
gambling. A startling 85% recognised that their gambling had caused harm to others, including<br />
family or whānau. This substantial incidence of unreported gambling-related crime is ‘invisible’ to the<br />
authorities. Bellringer et al. (2009) suggest this quantity of unreported gambling-related crime raises<br />
the possibility that there may be significant economic and social costs associated with gambling<br />
which have not previously been factored into economic and social cost analyses of gambling.<br />
Normalization of gambling<br />
Notwithstanding the Community Gaming Association’s claim that You bet your life… and mine!<br />
it “seeks to achieve positive outcomes for its members and the<br />
communities they serve” (Community Gaming Association, undated), recent research has found that<br />
parents engaging in gambling reported unstable environments and neglect, including lack of time,<br />
lack of quality time, lack of supervision, and compromised provision of food and clothing (Perese,<br />
2009). Increased gambling resulted in children being moved from the forefront of family life, with<br />
older children reporting taking on debt or extra work to compensate for their parent’s gambling<br />
expenses. The gambling by one family member leading to debt for another illustrates that social<br />
hazards reinforce one another, and seldom occur in isolation. This includes alcohol and nicotine<br />
dependence. For example, a UK study found that 73% of problem gamblers had an alcohol disorder<br />
and 60% had a nicotine dependence (Griffiths, Wardle, Orford, Sproston, & Erens, 2009).<br />
Perese (2009) noted that interviewees expressed apprehension at the normalisation of gambling and<br />
the exposure of children to the stresses of debt. Other researchers have also found the environments<br />
that young people grew up in had a significant impact on their future gambling habits:<br />
gambling is more than just an individual behaviour: young people’s choices around gambling<br />
are influenced by factors such as their life experiences and circumstances, and the messages<br />
conveyed to them concerning gambling (Rossen, 2008, p. 19).<br />
Other risk factors for problem gambling in young people found by Rossen (2008) and Nguyen (2009)<br />
were: having a parent with a gambling problem; exposure to gambling by family or friends who are<br />
high-frequency gamblers; or early commencement of gambling. There is now substantial evidence<br />
that there is a moderate risk associated with parental gambling problems, with research findings<br />
consistently indicating that children of problem gamblers are 2 to 4 times more likely to develop<br />
gambling problems themselves than the children of non-problem gamblers (Dowling, Jackson,<br />
Thomas, & Frydenberg, 2010).<br />
154
Gambling in low-income communities is of particular concern, as these communities tend to be<br />
targeted by pokie-machine operators, and are comprised of families least able to afford it. Gambling<br />
behaviour is supply driven: the amount of gambling activity in an area is associated with the density<br />
of gambling opportunities in that area. Nationally, 47% of gambling venues are in decile one, two and<br />
three areas. Non-casino gaming machines or “pokies” are five times more likely to be concentrated<br />
in decile one and two areas, and TAB venues are three times more likely to be located in the most<br />
deprived areas. Gaming machines do provide a source of funding for many sports and charitable<br />
organisations. Although one-third of the money spent on machines is returned to the community<br />
nationally, it is more likely to be returned to more affluent communities and sports organisations<br />
rather than the low-income communities from which much of it is drawn (He Oranga Pounamu,<br />
2006).<br />
Gambling in low-income areas causes damage to the families in those communities, and in particular<br />
to children. The evidence suggests that easy access is the biggest issue. The government claims<br />
20% of profits from gaming machines as tax and thus has no incentive to minimise gambling. Local<br />
councils have no such financial stake and are thus in a better position to adopt a sinking lid policy,<br />
and to restrict the number of gambling venues and gambling machines in their district.<br />
The tide is, however, being turned through the efforts of communities themselves. The Salvation<br />
Army reports (2011b, p. 45), the continuing decline in the prevalence of, and losses from, Class<br />
4 gaming machines; 110 and even while other forms of gambling, especially Lotteries Commission<br />
lotteries, remain very popular, these operations are also showing some decline over the recent year.<br />
In addition, Auckland’s Otara <strong>Action</strong> <strong>Group</strong> has been successful in achieving a sinking lid policy on<br />
pokies in their area, despite active resistance from gambling industry who tried to discredit their<br />
submissions. 111<br />
The research referenced here emphasises the points that gambling is a public health issue and<br />
children are an intrinsic and important part of this public health picture; and the legal social hazards<br />
of alcohol, tobacco, and gambling are often associated, and often precipitate dealings with another<br />
of New Zealand’s legal social hazards: high-priced debt from fringe lenders.<br />
Loan sharks<br />
Most of the developed world has acknowledged the need to cap interest rates in order to provide<br />
protection for the vulnerable members of their communities. 112 The absence of an interest rate cap in<br />
New Zealand means that, in the event of a crisis, many families unable to access high-street credit<br />
turn to loan sharks. This means they then struggle to meet the cost of their necessities like food, or<br />
rent, or power. In the event they are unable to make the repayments on the due date, default fees and<br />
penalty interest accumulate, increasing the financial strain. Thus, easy access to high-priced debt<br />
110 31 September 2010, there were 18,601 Class 4 gaming machines in New Zealand’s clubs and pubs—down 4% from a<br />
year previously, and 14% from 2005 when there were 21,684 such machines in operation. In per capita terms, this decline<br />
is even more noticeable. In 2005, there were 71 gaming machines for every 10,000 population over 18 years. By 2009,<br />
this ratio had fallen to 60 machines per 10,000; and during 2009/10 it fell further to 57 (Johnson, 2011b, p. 43).<br />
111 See http://www.problemgambling.org.nz/community-story_otara-action-group.<br />
112 For example, in Bosnia, Cambodia, Azerbaijan, Kenya, India, Latin America, and West Africa, there has been a usury rate<br />
applied to banks and all financial and microfinance institutions set at 27% annual interest rate, and the central bank and<br />
the Ministry of Finance are responsible for enforcing this law: http://www.mftransparency.org/pages/case-study-interestrate-cap-in-waemu-countries/.<br />
Currently, New South Wales, Victoria, Queensland and the ACT impose an interest rate<br />
cap on regulated consumer credit: http://www.langes.com.au/consumercredit/2010/03/12/interest-rate-caps-under-thenational-credit-scheme/.<br />
155
has the consequence of a deteriorating financial situation for families over time, with the associated<br />
stress, and the risk of loss of goods have been put up as collateral for the loan.<br />
In May 2011, Consumer Magazine sent two mystery shoppers to four fringe-lending operations in<br />
the same 100-metre strip in Porirua. The three issues that emerged were: lack of transparency about<br />
loan costs and charges; high annual rates and fees, up to 463% in one instance; and their advertising<br />
is targeted at vulnerable people. Lenders do not have to disclose the loan costs and terms in advance<br />
of the person signing up, but they do have to disclose the loan terms within five days. Borrowers then<br />
have the right to cancel the loan within three days of that disclosure (Consumer Magazine, 2011).<br />
According to the Ministry of Consumer Affairs, a very high interest rate is not necessarily excessive<br />
for these easy-access loans. If someone borrows $200 from a payday lender and pays back $220<br />
the next week, although the annual interest rate would be 520%, the total amount of interest paid was<br />
only $20. The real problems emerge when a person is unable to repay the loan, so it is compounded,<br />
retaining that same interest rate (Consumer Magazine, 2011).<br />
The recent Financial Service Providers (Registration and Dispute Resolution) Act 2008 does not<br />
cover high interest and fees, so the free dispute-resolution schemes 113 cannot assist consumers<br />
in such cases. The only recourse for people trapped in usurious contracts is through the Disputes<br />
Tribunal if the amount is for $15,000 or less (or $20,000 if both parties agree), or through the Court<br />
system. However, it is expensive to take a case through the Court system, and those suffering under<br />
high interest rates are seldom in a financial position to pursue this option.<br />
Under the Credit Contracts and Consumer Finance Act (CCCFA), the size of fees and default fees<br />
cannot be unreasonable. The CCCFA also allows the Court or a disputes tribunal to reopen a credit<br />
contract if it finds the contract is grossly unfair, or the lender has acted oppressively. Occasionally<br />
the court has decided that an extremely high interest rate was oppressive and reopened the contract<br />
and lowered the interest rate.<br />
The Ministry of Consumer Affairs is reviewing consumer credit law, including the CCCFA and the<br />
Credit (Repossession) Act. As part of the review, the ministry will investigate a suggestion from<br />
community lawyer Bill Bevan that lending money to someone who plainly cannot repay is a breach of<br />
section 29 of the Consumer Guarantees Act 114 because the lending services are not “fit for purpose”.<br />
The problem remains, however, that the consumer must pursue the action through the Courts unless<br />
such breaches are brought under the ambit of the dispute resolution schemes.<br />
Various budgeting services, the Salvation Army, unions and other community groups have recently<br />
re-launched a campaign to crack down on fringe lenders who target vulnerable families and charge<br />
high interest rates on loans (Consumer Magazine, 2011). Labour’s Carol Beaumont has been active<br />
in addressing the problem of loan sharking, and in April, she launched the Community Alliance<br />
Against Loan Sharks. 115 She promoted the Credit Reforms (Responsible Lending) Bill, drawn out of<br />
the ballot and voted down in May 2010, and has since combined with the Green Party to promote two<br />
new private members’ bills on this issue.<br />
113 Financial dispute resolution schemes that are free to consumers are the Insurance and Savings Ombudsmans Scheme<br />
(ISO), Financial Services Complaints Limited (FSCL), the Financial Dispute Resolution Scheme Ltd (FDR), and the<br />
Banking Ombudsman Scheme (BOS).<br />
114 See Consumer Magazine report on the Act at http://www.consumer.org.nz/reports/consumer-guarantees-act/introduction.<br />
115 See http://labour.org.nz/node/3534.<br />
156
After speaking strongly against Beaumont’s bill, National’s Sam Lotu-Iiga submitted his own bill which<br />
would establish a registrar of moneylenders under the Financial Markets Authority to administer a<br />
strict licensing regime, extending to the certification of those employed by moneylenders or who<br />
act as their agents. The maximum penalties for unauthorised moneylending would be a fine of up<br />
to $500,000 and seven years in prison; forms of security would be limited; the issue of oppressive<br />
contracts would be addressed; fees would be prohibited except by regulation; and interest rates<br />
would be capped at 48%, “above which there will be a presumption of oppression that must be<br />
rebutted by the lender” (Lotu-Iiga, 2011).<br />
In June 2011, a finance company’s move to offer loans via text<br />
message perhaps focussed the attention of the Government.<br />
Ferratum New Zealand offers loans of up to $600 via mobile phone,<br />
which it says are hugely beneficial for consumers wanting to make<br />
on-the-spot purchases without having to wait. The Finland-based<br />
company argues that its service allows lenders to meet urgent<br />
needs such as grocery bills. (NZPA, 2011c) People desperate for money can access the loan by<br />
text message, with the cash arriving in minutes, but the interest rates top 60%. For a $300 loan the<br />
interest is more than 60% for 45 days. If unpaid after that time, the debt will be handed to a collection<br />
agency, which would send reminder letters at an additional cost of up to $150 per letter (Wade, 2011).<br />
The issue of loan sharks and fringe lenders is rarely out of the spotlight (New Zealand Herald, 2011).<br />
In July 2011, the new Minister for Consumer Affairs, Simon Power, announced that he, too, 116 will be<br />
holding a Financial Summit in South Auckland, in August 2011, and his target, too, is unscrupulous<br />
credit companies (S. Power, 2011). Initially, his focus was on financial literacy. However, someone<br />
desperate for cash to pay for the groceries while they are standing by the cash register in the<br />
supermarket is not in a position to challenge either the interest rate or the fees charged on the<br />
transaction. As the days went by, Power shifted his position and on 24 June he announced that the<br />
Government is open to putting a cap on the interest rate that can be charged on loans as it looks to<br />
crack down on loan sharks (Television New Zealand, 2011).<br />
Fringe lenders or loan sharks prey on people desperate for money. In their research on fringe lenders,<br />
Cagney and Cossar (2006, p. 16) found 185 firms of fringe lenders; 71 sites (38%) were located in<br />
Auckland, 36 (19%) in Christchurch and 16 (9%) in Wellington. All the loan sharks were located in<br />
low-income areas. Table 14.1 indicates the number of children in 2010 who are potentially impacted<br />
by the oppressive interest rates charged by fringe lenders. The high interest rate charged on an<br />
emergency loan accessed by text from the supermarket is likely to prevent the parents from providing<br />
adequate food for their children the following week.<br />
Financial literacy will assist families in the present and in the future in better management of the<br />
money they do have. Financial literacy will not address the high interest rates accepted by desperate<br />
people. Only capping interest rates will do that.<br />
116 Judith Tizard, Labour’s Minister for Consumer Affairs, held the first South Auckland Financial Summit in 2007, and<br />
Heather Roy, the newly appointed National/Act/Maori Party Minister held one in 2009.<br />
157
Recommendations<br />
<strong>Child</strong> <strong>Poverty</strong> <strong>Action</strong> <strong>Group</strong> urges that the protection of children be at the forefront of the regulatory<br />
framework around social hazards, including:<br />
• Banning tobacco retail displays;<br />
• Requiring plain packaging and graphic warnings to replace brand imagery;<br />
• Ensuring locations where young people are present, including private vehicles, are smoke-free;<br />
• Empowering parents and caregivers to be smoke-free in order to protect their children from<br />
becoming smokers;<br />
• Exposing the tactics and activities of the tobacco industry.<br />
• CPAG supports the recommendations of the Alcohol <strong>Action</strong> group:<br />
o Introduce a minimum price per standard drink to end ultra-cheap alcohol sales;<br />
o Reduce the adult drink-driving limit from 0.08 to 0.05;<br />
o Begin a five-year period of dismantling alcohol advertising and sponsorship;<br />
o Restore alcohol-free status to supermarkets;<br />
o Return the purchase age for both on- and off-licence to 20 years; and<br />
• In recognition of the considerable harm that excessive alcohol consumption does to New<br />
Zealand’s young people: restrict its marketing and availability, and introduce harsher penalties<br />
for drink-driving;<br />
• Recognise the damage ‘problem gambling’ does to the children in a family and in a community,<br />
and support a Public Health approach toward amelioration and solutions;<br />
• Support the ‘sinking lid’ policy toward the reduction of gambling machines, and develop alternative<br />
options for community funding of sports and charities;<br />
• Follow the lead of most of the rest of the developed economies and cap interest rates;<br />
• Support the teaching of financial literacy as part of the curriculum in primary schools.<br />
158
PART FOUR<br />
Chapter 15. Early childhood care and education<br />
Jenny Ritchie 117 and Alan Johnson 118<br />
General introduction<br />
The National Equal Opportunities Network (NEON), a partnership between the Human Rights<br />
Commission and the EEO Trust, 119 argues that the provision of high-quality, affordable, accessible<br />
and available early childhood education benefits both young children and their parents, and ultimately<br />
the community. They give particular attention to the lack of provision of early childhood care and<br />
education places in rural and low-income areas, and the gender imbalance in carer roles that still<br />
operates as a cultural norm. There has been confusion in recent early childhood education policy as<br />
to the value to society of provision. This confusion has centred around the dual aims of meeting the<br />
needs of children and families for quality education and care; and providing support to families and the<br />
economy by providing adequate early childhood services for young children and thus freeing workers<br />
for the workforce. The focus in this chapter is on the causes and consequences<br />
of under-provision of early childhood education. The chapter first provides an<br />
overview of early childhood education in New Zealand. The second section, “To<br />
those that have, more shall be given”, digs deeper into the data, and focuses<br />
particularly on under-provision in low-income and rural communities.<br />
Overview of provision of early childhood education<br />
The opportunities for learning, growth and development offered in high-quality early childhood<br />
education (ECE) programmes have the potential to provide significant benefits for families and their<br />
young children in a range of ways. These include parenting skills and emotional support for families,<br />
and accessing foundational early learning experiences for young children.<br />
High quality early childhood care and education services can be a powerful equaliser, reducing<br />
disadvantages in low-income families. (Fletcher & Dwyer, 2008, p. 66)<br />
A range of New Zealand and international studies found that, in good quality ECE centres, cognitive<br />
gains in mathematics and literacy for children from low-income and disadvantaged homes could be<br />
greater than for most other children (Mitchell, Wylie, & Carr, 2008, p. 3).<br />
The New Zealand government has historically positioned the ECE field outside of the compulsory<br />
sector of primary and secondary provision. This has allowed successive governments to display<br />
varying degrees of detachment from the responsibility for offering high quality and accessible early<br />
childhood education services for all children and their families. The three-term Labour-led government<br />
of Helen Clark made significant steps towards demonstrating a commitment to the provision of highquality<br />
ECE services for all children of families who wanted to access these, with the development<br />
and implementation of Pathways to the Future: Ngā Huarahi Arataki. A 10-Year Strategic Plan for<br />
Early <strong>Child</strong>hood Education (Ministry of Education, 2002). A key plank of this policy was raising the<br />
117 Jenny Ritchie, Associate Professor in Early <strong>Child</strong>hood Teacher Education at Te Whare Wananga o Wairaka – Unitec<br />
Institute of Technology, Auckland, New Zealand.<br />
118 Alan Johnson is Senior Policy Analyst for the Salvation Army Social Policy and Parliamentary Unit.<br />
119 www.neon.org.nz/nationalconversationaboutwork/onthejobissueswhatnext/parentinganddependentcare/.<br />
159
previous minimum requirement for staffing from one person per setting with a three-year level ECE<br />
qualification, to the goal of every staff member being a fully qualified teacher by 2012. In July 2007,<br />
the government’s radically progressive innovation of the introduction of the “20 Hours Free” childcare<br />
policy for three- and four-year-old children was a promising step towards Labour’s acceptance of its<br />
role in providing universal quality early childhood education. However, access for individual families<br />
was dependent on the willingness of particular early childhood services to take up the provision,<br />
many having expressed concern that the government’s funding limit was inadequate. <strong>Further</strong>, the<br />
20 Hours Free was initially only available to ‘teacher-led’ services, thus excluding Playcentre and<br />
Kōhanga Reo.<br />
The current National-led government extended availability of this subsidy to ‘whānau-led’ services<br />
from July 2010. At the same time, the policy was re-titled “20 Hours”, semantically signalling a move<br />
away from the principle of universal free provision of quality early childhood care and education.<br />
Minister of Education Anne Tolley advised early childhood centres that are struggling financially to<br />
introduce fees to top up the ‘20 Hours’ early childcare policy funding (Yahoo!Xtra News, 2010, Feb 1).<br />
ECE Taskforce Overview Information<br />
In October 2010, prompted by concerns about the huge increase in early childhood funding generated<br />
through the ‘20 Hours’ policy, the Ministry of Education announced the establishment of a taskforce<br />
“to undertake a full review” of the early childhood care and education sector (Ministry of Education,<br />
2010, p. 1). The Ministry website on the ECE taskforce claims:<br />
current spending is not reaching all the neediest children and families, but is benefiting many<br />
children who already have the opportunity for a strong start in their education. Costs to Government<br />
are continuing to rise, but with no guarantee of improved outcomes for learners in return.<br />
Whilst there are no ‘guarantees’ in social arenas such as education, as shown throughout this chapter,<br />
the research evidence is emphatic that quality early childhood education is of benefit to all children<br />
and families who are lucky enough to access it. The chief difficulty in our current early childhood<br />
arena is that successive governments have relied on private provision to deliver what is actually<br />
a community benefit. The profit-orientation of many early childhood businesses means that these<br />
enterprises are viewed as being unlikely to deliver sufficient profit margins in low socio-economic<br />
areas. The briefing papers prepared by the Ministry of Education for the EC Taskforce offer some<br />
revealing statistics. These appear below in italics, with commentary following.<br />
Economic disparities<br />
• In 2009, about 22% of all 0–6 year olds lived in a ‘low-income household’ (ECE Taskforce<br />
Secretariat, 2010, p. 2).<br />
There are also compounding factors with regard to the rural/urban divide. The private sector does<br />
not view low population density areas as profitable. As stated earlier in this chapter, high quality early<br />
childhood education provision has been demonstrated to make measurable differences, which are<br />
more marked in children who arrive with the greatest initial disadvantage. Margaret Carr (a widely<br />
respected New Zealand early childhood education academic) and Linda Mitchell responded to last<br />
year’s early childhood policy changes with a strongly worded opinion piece published in the New<br />
Zealand Herald, in which they stated:<br />
160
Economic inequality will now be associated from the early years with educational inequity. The<br />
new education policy established by the May [2010] budget says that we cannot afford the financial<br />
cost of qualified teachers to provide care and education for all of New Zealand’s youngest and<br />
most vulnerable of children. We say that as a nation we cannot afford not to– the long-term social,<br />
economic and educational cost is too high. (Carr & Mitchell, 2010, Wednesday March 9, p. 1)<br />
Reliance on the private, for-profit sector<br />
• In 2009, about 40% of services were for-profit and about 60% non-profit, as compared to 2000<br />
when the same split was 26%/74%. (ECE Taskforce Secretariat, 2010, p. 5)<br />
It is clear that the neo-liberal policy agenda of relying on the private, profit-oriented sector for early<br />
childhood care and education provision, first promoted by the National-led governments of the<br />
decade of the 1990s, has resulted in the<br />
private sector and corporate groups [being] best positioned to respond to the expanding provision<br />
and participation. (H. May & Mitchell, 2009, p. 9)<br />
According to leading early childhood education researchers, May and Mitchell:<br />
Increasing levels of Government funding were, again, making early childhood education service<br />
provision a business opportunity, to the extent that some private childcare businesses were listed<br />
on the stock exchange with the intention of delivering a financial return to stockholders. Multinational<br />
companies such as Macquarie Bank were able to move in and out of the market, rapidly<br />
buying and then selling centres for a large profit. (H. May & Mitchell, 2009, p. 9)<br />
This reliance meant that children, families, and early childhood education workers were increasingly<br />
vulnerable to market forces. This was clearly evident when, after the Australia-based corporate ABC<br />
Learning had expanded rapidly into New Zealand,<br />
the financial collapse of its parent company left New Zealand ABC users and operators in limbo.<br />
(H. May & Mitchell, 2009, p. 9)<br />
Service growth is lower in the poorest areas: 4.4% from 2006 to 2009 after taking account of the<br />
0–4 year old population growth, compared with an average of 11.0% in not low SES areas (ECE<br />
Taskforce Secretariat, 2010, p. 7).<br />
Again, this inequity demonstrates the folly of leaving early childhood provision to the private sector.<br />
Market forces work in inversion to socio-economic need.<br />
Cultural inequities<br />
• There is a persistent gap in take-up of ECE between children from European and higher socioeconomic<br />
status backgrounds and others. While most children participate in at least some ECE<br />
prior to starting school (95.1% overall), participation rates of Māori (91.4%), Pasifika (85.4%)<br />
and children entering deciles 1–4 schools (and hence assumed to be from lower socio-economic<br />
groups, 89.2%) are much lower than this average, which is boosted by the 98.5% European<br />
rate. The reasons for this lower level of participation are complex and likely to relate to both the<br />
supply of, and demand for (including ability to access and afford), ECE services. (ECE Taskforce<br />
Secretariat, 2010, p. 7)<br />
161
• Post-2005 “participation” 120 by Māori increased from 89.9% of four year olds to 91.4%, and for<br />
Pasifika, from 84.5% to 85.4%”. (ECE Taskforce Secretariat, 2010, p. 11)<br />
• Between 2006 and 2026, it is predicted that the European share of the under-five population will<br />
drop from 60% to 50%, with concurrent increases in the Māori, Pasifika and Asian populations.<br />
(ECE Taskforce Secretariat, 2010, pp. 2-3)<br />
Socio-economic and cultural factors regarding early childhood education (non)-participation are<br />
closely interwoven. There is copious research to indicate that Māori families value early childhood<br />
and other education experiences for their children, particularly those in which their children receive<br />
culturally relevant experiences, including the opportunity to learn te reo Māori (AGB/McNair, 1992;<br />
Dixon, Widdowson, Meagher-Lundberg, McMurchy-Pilkington, & McMurchy-Pilkington, 2007; Else,<br />
1997; Te Puni Kōkiri/Ministry of Māori Development, 1998). The recent Ministry of Education-funded<br />
review of its Promoting Participation in Early <strong>Child</strong>hood Education project found that<br />
For all Māori families, having access to ECE environments that supported Māori cultural practices<br />
and language was a key factor in participation. (Dixon, et al., 2007)<br />
This places the onus on the Ministry to ensure that the kinds of provision that Māori and Pacific<br />
families value with regard to their particular cultural priorities is available, and accessible in terms<br />
of financial, logistic and cultural distance (M. Durie, 2003). It is erroneous for the Minister/Ministry<br />
to use the guise of trying to increase participation for these ‘targeted’ groups as the reason for<br />
across-the-board funding/quality cuts. These will affect all children, including those Māori, Pacific,<br />
and families from low socio-economic groups who are fortunate enough to attend early childhood<br />
centres. Reducing the quality of our teachers, and hence of the programmes they are able to offer, is<br />
seriously endangering the futures of not only all young learners, but also of our country’s reputation<br />
for having a world-leading early childhood service (H. May & Mitchell, 2009).<br />
Quality determinants<br />
• The proportion of registered teachers increased from 37% in 2004 to 52% in 2005, and to 64% in<br />
2009. (ECE Taskforce Secretariat, 2010, p. 9)<br />
Whilst a considerable increase is evident, 64% is still low compared to the primary and secondary<br />
education sectors, where all teachers must be registered (or in the two-year initial period of gaining<br />
registration). In order to be registered, a teacher must hold a qualification that is recognised by<br />
the New Zealand Teachers Council, and the current bench-mark is a minimum three-year teaching<br />
diploma or degree. The kindergarten sector, which is legally required to employ only qualified<br />
teachers, has been extremely disadvantaged by the recent 14% reduction in funding (Wells, 2010,<br />
p. 1) which means that services are funded only for 80% of their staffing to be qualified. The cut to<br />
funding is particularly ironic and frustrating given that this not-for-profit, community-based service<br />
has traditionally been a provider of free or very lost-cost, high-quality early childhood education that<br />
has been widely accessed by families from low socio-economic areas (where state kindergartens<br />
have been established).<br />
120 Meaning at least 1 hour per week.<br />
162
Funding issues<br />
• Vote Education ECE spending increased from $300 million in 2000/01 to $1,100 million in 2009/10.<br />
The number and costs of teachers have increased, driven by the teacher-registration targets and<br />
increases in teacher collective agreements, and by services moving quickly to the higher teacher<br />
funding bands.<br />
• There have also been significant volume changes with more children enrolling (an increase of<br />
almost 70%, 2001–2009), and for longer hours (from an average of 16.6 hours in 2005 to 19.5<br />
hours in 2009). (ECE Taskforce Secretariat, 2010, p. 11)<br />
The previous Labour-led Government had been strongly committed to increasing both the quality of,<br />
and participation in, early childhood care and education, for both economic and educational reasons,<br />
and had put these expectations into highly regarded policies such as Pathways to the Future: Ngā<br />
Huarahi Arataki. A 10-Year Strategic Plan for Early <strong>Child</strong>hood Education, and 20 Hours Free ECE.<br />
Given that commitment, it is hardly surprising that funding has needed to be increased substantially.<br />
At times of high employment, availability of early childhood provision is highly desirable for the<br />
economy. Now that we are in an economic downturn, the needs and rights of children and families to<br />
the well-established educational, social and economic benefits of early childhood services are being<br />
viewed by the current National-led Government as less of a priority.<br />
Recent changes to early childhood policy and regulations<br />
Recent changes to early childhood policy are eroding the positive steps that had been achieved to<br />
date through Pathways to the Future: Ngä Huarahi Arataki with regard to the expectation of having fully<br />
qualified early childhood educators, as well as the maximum group sizes for early childhood centres.<br />
Both of these factors are highly significant with regard to the provision of quality early childhood<br />
education. In its Budget 2010, the Government reduced the goal of 100% qualified teachers to a<br />
funding ceiling of 80%. Then on March 3, 2011, the Ministry of Education announced:<br />
From July 1 2011 this year, the maximum centre size that ECE services or hospital-based education<br />
and care services can be licensed for will change from 50 to 150 licensed child places…. The<br />
amended regulations will require one person responsible for every 50 children in a service. This<br />
will maintain the quality of supervision, continue to protect children, and will not add additional<br />
compliance costs to existing services. (Ministry of Education, 2011c, p. 1)<br />
It is incomprehensible that the Ministry has promulgated such a potentially damaging regulation<br />
without waiting for the April 2011 report of the ECE taskforce it set up in October 2010. 121 The research<br />
is unequivocal regarding the value of quality ECE provision:<br />
A number of rigorous, evaluative, controlled longitudinal studies have demonstrated that high<br />
quality ECE and parenting programmes can contribute substantially to school-readiness, improved<br />
educational performance and increased economic success in adulthood. (Heckman, 2006; Karoly,<br />
Kilburn, & Cannon, 2005; Schulman & Barnett, 2006; cited in Waldegrave & Waldegrave, 2009,<br />
p. 7)<br />
The gains are especially clear for children and families who are struggling: “Good quality ECE has<br />
greater benefits for children from low socioeconomic families, but children from middle and high<br />
socioeconomic families also gain.” (Mitchell, et al., 2008, p. 7) However, it is important to note that:<br />
121 Surprisingly, there was no consultation with the sector prior to establishment of this taskforce.<br />
163
“the especially negative effects of poor quality early childhood education for children, who come from<br />
families at risk, is another clear finding” (A. B. Smith et al., 2000, p. 121).<br />
Key components of high quality early childhood education which are especially important are: “qualified<br />
staff, low child: adult ratios, small group size, and staff professional development opportunities”<br />
(Mitchell, et al., 2008, p. 8). These components enhance the possibilities for the quality of staff–<br />
child interaction; the learning resources available; the engagement of children and their families in<br />
the programme; and a supportive environment for children to work together (Mitchell, et al., 2008,<br />
p. 5). <strong>Further</strong>more, early childhood services “that contribute to positive child and family outcomes”<br />
are characterised by: intentional teaching; family engagement with ECE teachers and programmes;<br />
inclusion of social/cultural capital and interests from home; and cooperation between family and<br />
teachers to support the child’s learning; as well as the complexity of the curriculum provided (Mitchell,<br />
et al., 2008, pp. 7-8).<br />
Clearly, the Government has decided that the early childhood sector has been costing too much<br />
money. Its response is to enable more places in lower quality early childhood education settings,<br />
without consideration for the research, or for the potential for long-term ill-effects. Ironically, the<br />
decision-making flies in the face of the economics:<br />
Economists, using conservative estimates of benefits based on recent relevant research evidence<br />
of ECE effects for children from across the socio-economic spectrum, projected cost benefits of<br />
offering universal high-quality ECE for 2-, 3- and/ or 4-year-olds. Most economic evaluations of<br />
ECE programmes have shown that benefits of public spending exceed the costs. Gains are not<br />
realised, or are not as great, if the ECE is of poor quality. Without considering the opportunity costs<br />
of that spending, comparing the investment to other types of early years intervention or alternative<br />
policy options, these findings tend to suggest that public spending for ECE programmes will<br />
result in good returns in terms of maternal employment, higher levels of the participant’s lifetime<br />
earnings, reductions in usage of special education services, lesser criminal activity, and reduced<br />
use of social services that are expected to have a flow-on effect to the economy. (Mitchell, et al.,<br />
2008, p. 7)<br />
Summary<br />
While the financial pressure on Government caused by national and global crises is undeniably<br />
severe, the commitment to ensuring equitable access to quality early childhood provision is too<br />
important to be side-lined. The recent Ministry changes, which cut funding for centres which retain<br />
qualified staff, and enable centres to increase unit sizes so that children may be cared for in centres<br />
catering to 150 children, and with one person responsible for 50 children are a crude and potentially<br />
devastating blow to a sector which has advocated for many years for the quality commitments that<br />
were finally articulated in Pathways to the Future: Ngā Huarahi Arataki. A 10-Year Strategic Plan for<br />
Early <strong>Child</strong>hood Education (Ministry of Education, 2002). As a recent report stated:<br />
It is very important to continue to create access and participation in high-quality ECE for as much<br />
of the population as is possible. The high quality of this sector in New Zealand is ideally placed<br />
to be a buffer against the negative effects of stress on children at risk and create authentic<br />
and natural connections between their parents and extended families, and informed people who<br />
can provide support and information. The ongoing quality of ECE in New Zealand will require<br />
continuing investment and monitoring. (Waldegrave & Waldegrave, 2009, p. 53)<br />
164
To those that have, more shall be given<br />
Middle-class capture is a reality of the provision of early childhood care and education programmes<br />
in New Zealand. This is of concern because of ‘cumulative advantage’:<br />
This idea … has been applied to literary acquisition in primary school where a child entering<br />
school with literacy knowledge continues to achieve literacy advantage while those who enter<br />
without acquisitions tend to lag behind. It is a case of the literacy-rich getting richer and the<br />
literacy-poor getting poorer. (Walden, 2011, p. 7)<br />
Despite political and professional rhetoric on the value of early childhood education for reducing<br />
childhood inequality, there is scant evidence to suggest such a reduction has been prioritised by<br />
those who have designed early childhood education policy in the past decade. There is certainly little<br />
evidence to suggest children from poorer communities have benefited to the same degree as middleclass<br />
children from the rapid growth in government spending on ECE since 2006. While this inequity<br />
is not the result of indifference or malice on the part of those who have designed and approved<br />
funding for early childhood policy, the disappointing outcomes point to a poor understanding by<br />
politicians and their policy advisors of the limits of a paradigm which relies on demand subsidies and<br />
private sector investment decisions.<br />
This part of the chapter considers the inequalities which have resulted from a market-driven and<br />
increasingly privatised ECE sector. Recent changes in the levels of ECE participation and funding<br />
are followed by analysis of levels of participation in ECE across ethnicities and household incomes.<br />
Finally, differences in the local availability of ECE services across a number of communities in New<br />
Zealand are reported and discussed.<br />
Recent changes in ECE participation and funding<br />
The past five years have seen a huge expansion in public spending on ECE from $522 million<br />
in 2006/07 to $1.157 billion in 2010/11, disproportionate to the far more modest increases in the<br />
numbers of children participating in ECE services. The result has been a near doubling of the perenrolment<br />
subsidy for a child attending an ECE centre. Over this period, 2006/07 to 2010/11, the<br />
average hours which children attended an ECE centre increased from 16.9 hours to 19.0 hours so<br />
some of this subsidy increase can be explained by this increase in extent of use. These trends are<br />
shown in Table 15.1 below:<br />
Table 15.1. Trends in ECE enrolments and expenditures 2006-10<br />
2006 2007 2008 2009 2010<br />
Enrolments* 165,254 171,138 176,993 180,910 188,924<br />
Budget $millions nominal 522 586 807 1,029 1,157<br />
Budget** $millions Jun10 574 632 837 1047 1,157<br />
Subsidy*** per enrolment $s Jun10 2,885 3,357 3,571 4,626 5,543<br />
Notes: * Data from Education Counts website and are at July of the respective year.<br />
** Data from NZ Government Budget Appropriations which have been indexed against the CPI.<br />
*** This per-enrolment subsidy is based on the budget for the previous year ie. the subsidy for 2010 is the budget for 2009/10<br />
divided by the enrolments in July 2010.<br />
165
ECE participation by ethnicity<br />
Two sources of official data provide a picture of recent changes in ECE participation by different<br />
ethnic groups. One source is data published by the Ministry of Education and is based on parent<br />
interviews of new entrants at the time they start school. This data, summarised in Table 15.2 below<br />
for Māori, Pasifika and European/Pakeha children, shows that the rate of participation of European/<br />
Pakeha children is about 10% higher than that for Māori children and 15% higher than that of Pasifika<br />
children.<br />
Table 15.2. Proportion of Year 1 students previously attending ECE 2006-09<br />
(Source: Education Counts)<br />
2006 2007 2008 2009<br />
Māori 90% 91% 90% 91%<br />
Pasifika 84% 84% 85% 85%<br />
European/Pakeha 98% 98% 98% 99%<br />
While these reported rates of ECE attendance indicate fairly high levels of participation across the<br />
board these data say nothing of the extent or quality of the participation being reported. For example,<br />
was the reported prior participation for two months or for two years? The data discussed below<br />
suggests a far less equitable pattern of ECE participation than that presented in Table 15.2. The<br />
second source of data is taken directly from Ministry enrolment data, summarised below in Table<br />
15.3.<br />
Table 15.3. ECE enrolments by ethnicity 2006-10 (Source: Education Counts, 2011)<br />
2006 2007 2008 2009 2010 Change 2006-10<br />
Māori 33,019 33,366 34,748 36,118 38,580 17%<br />
Pasifika 9,697 9,993 10,678 11,060 12,111 25%<br />
Asian 9,481 10,230 11,530 12,357 13,181 39%<br />
European/Pakeha 110,366 111,982 113,401 112,618 119,170 8%<br />
Total all ethnicities 165,254 171,138 176,993 180,910 188,924 14%<br />
In isolation, the data in Table 15.3 reveals little about the equity of the current pattern of ECE<br />
enrolments except perhaps that minority ethnic groups, and specifically Pasifika and Asian children,<br />
have benefited relatively more from the increase in enrolment numbers between 2005 and 2010.<br />
Nothing in Table 15.3 suggests anything about the ethnicity of children being born so that we might be<br />
able to assess if ECE participation is relatively equal. The ethnic breakdown of live births is provided<br />
below in Table 15.4 to provide a basis for assessing the fairness of current ECE enrolment patterns.<br />
166
The significant difference between the number of live births and the number of reported ethnicities<br />
of babies in the bottom two rows of Table 15.4 points both to the extent of multiple ethnicity mixing<br />
within New Zealand’s population 122 and to the problems we may have in accurately comparing ethnic<br />
identification from one data source to another. 123<br />
Table 15.4. Live births by ethnicity 2006-09 (Source: Statistics New Zealand; Education Counts, 2011)<br />
2006 2007 2008 2009 Total<br />
06-09<br />
Share of Total<br />
(identified ethnicities)<br />
Māori 17,342 18,717 18,844 18,027 72,930 22.7%<br />
Pasifika 8,926 9,788 10,122 10,068 38,904 12.1%<br />
Asian 6.028 7,076 7,263 7,492 27,859 8.7%<br />
European/Pakeha 41,575 44,680 44,534 43,292 174,081 54.3%<br />
Total all ethnicities 75,760 81,995 82,491 80,549 320,795<br />
Total live births 59,193 64,044 64,343 62,543 250,123<br />
The extent of these problems of definition has not been considered as part of this paper although it<br />
seems unlikely that such a problem can explain away the differences between enrolment rates and<br />
the ethnic breakdown of births which are summarised below.<br />
Table 15.5 illustrates the extent to which European/Pakeha pre-school children are likely to gain<br />
above average access to ECE opportunities while Pasifika and Asian children are less likely to attend<br />
an ECE centre.<br />
Table 15.5. Ethnic shares of births 2006-09 and ECE enrolment July 2010<br />
(Source: Statistics New Zealand; Education Counts, 2011)<br />
Age 1 Age 2 Age 3 Age 4 All enrolments Share of births<br />
2006-09<br />
Māori 21.7% 20.8% 19.7% 20.2% 20.4% 22.7%<br />
Pasifika 5.4% 5.2% 6.6% 7.7% 6.4% 12.1%<br />
Asian 4.6% 5.9% 7.7% 8.4% 7.0% 8.7%<br />
European/<br />
Pakeha<br />
Total all<br />
ethnicities<br />
64.3% 64.8% 63.4% 60.9% 63.1% 54.3%<br />
24,771 36,873 57,729 59,141 188,924<br />
The lower rate of attendance for Asian children may be a result of parents being less willing to send<br />
very young children to an ECE centre as levels of enrolment of Asian children rises as children reach<br />
four years old. The participation by Māori children appears to be just below the Māori share of births.<br />
122 Between 2006 and 2009, 14% of all new-born babies were identified as having more than one ethnicity: around 18% of<br />
European/Pakeha babies, 25% of Pasifika babies, and nearly 50% of Māori babies.<br />
123 Ethnicity is a characteristic which is self-identified by the respondent. Statistics New Zealand allows for the identification<br />
of multiple ethnicities by respondents. This is the basis of data collected by Statistics New Zealand on births. The Ministry<br />
of Education reports on singular ethnicities which presumable requires the respondent (who would normally be the parent<br />
enrolling a child) to identify a preferred ethnicity. There is no way of knowing if the ethnicity/ethnicities (as identified by<br />
its mother) of a new born child is the same as at their enrolment in an early childhood education centre or at school. This<br />
paper assumes that there is not a significant or systematic change in reporting of ethnicities by parents between birth and<br />
such enrolments.<br />
167
It is difficult to estimate rates of enrolment in ECE by ethnicity from birth data because of the complications<br />
around ethnic identification and the allocation of multi-ethnicities from this data into the categories used<br />
by Ministry of Education for reporting of enrolments. This difficulty centres on the lack of an estimate of<br />
a base population against which to calculate enrolment rates. Statistics New Zealand does, however,<br />
provide population estimates by age for both the total population and for the Māori population which of<br />
course allows us to make Māori/non-Māori comparisons of ECE enrolments rates. This comparison is<br />
provided in Table 15.6 below.<br />
Table 15.6. A comparison of Māori & non-Māori ECE enrolment rates 2010<br />
(Source: Statistics New Zealand and Education Counts) 124<br />
Under 3 3 & 4 year olds Under 5’s<br />
MĀORI<br />
ECE enrolment (July 2010) 14,997 23,291 38,288<br />
Estimated population (at 30th June 2010) 55,850 33,310 89,160<br />
Enrolment rate 26.9% 69.9% 42.9%<br />
NON-MĀORI<br />
ECE enrolment (July 2010) 55,351 93,579 148,930<br />
Estimated population (at 30th June 2010) 134,990 87,700 222,690<br />
Enrolment rate 41.0% 106.7% 125 86.9%<br />
Table 15.6 indicates that the ECE enrolment rate for Māori children is likely to be half of that for non-<br />
Māori children. Even in the targeted three- and four-year-old age cohort, the rate of enrolment is<br />
around two thirds of that of non-Māori. The main reason for the apparent discrepancy between the<br />
reported relative position of Māori children is that Table 15.5 uses the larger estimate of all reported<br />
ethnicities in birth data as the basis for estimating the share of Māori children in the total population.<br />
By comparison, Table 15.6 and Statistics New Zealand estimates count a Māori child as someone<br />
with some Māori descent whose parents do not choose to define their child principally as non-Māori.<br />
ECE participation across communities<br />
Opportunities for pre-school children to attend a local ECE centre are not evenly distributed<br />
throughout New Zealand. As a general pattern, wealthier communities have higher rates of access<br />
to ECE places, although not all poorer communities have relatively poor provision of ECE services.<br />
Table 15.7 sets out the national pattern of distribution of ECE enrolments based on local government<br />
regions and on local districts where there are localised problems of poor ECE provision. In mid-<br />
2010, ECE enrolments represented 60% of the country’s under-5 population. Of all regions, only<br />
Auckland had a level of local provision significantly below this national average, while the Bay of<br />
Plenty, Canterbury and Otago regions had rates of provision significantly above average. Carterton<br />
District had the unenviable position of the lowest level of provision of ECE for any local council area<br />
with 34% enrolment of the local children, however, parts of South Auckland have lower levels of<br />
provision.<br />
124 Data from Statistics New Zealand population estimates and ECE enrolment data, Education Counts website.<br />
125 Because some children are enrolled in two or more centres at the same time, this rate exceeds 100%.<br />
168
Table 15.7. Under 5’s population and distribution of ECE places across New Zealand 2010<br />
Under 5’s<br />
population<br />
(June 2010)<br />
ECE enrolments<br />
(July 2010)<br />
Enrolment as % of<br />
under 5’s<br />
NORTHLAND REGION 11,480 6,494 57%<br />
AUCKLAND REGION 108,980 56,225 52%<br />
South Auckland 29,975 11,890 40%<br />
WAIKATO REGION 30,920 18,120 59%<br />
Hauraki District 1,230 603 49%<br />
Waikato District 5,200 2,193 42%<br />
Waitomo District 810 384 47%<br />
BAY OF PLENTY REGION 19,960 14,736 74%<br />
Western Bay of Plenty District 2,810 1,327 47%<br />
GISBORNE DISTRICT 3,940 2,295 58%<br />
HAWKES BAY REGION 11,550 8,266 72%<br />
TARANAKI REGION 7,880 4,722 60%<br />
MANAWATU-WANGANUI<br />
REGION<br />
16,290 10,365 64%<br />
Manawatu District 2,110 943 45%<br />
Tararua District 1,380 599 43%<br />
WELLINGTON REGION 33,930 21,145 62%<br />
Carterton District 540 181 34%<br />
TASMAN-NELSON DISTRICTS 5,890 4,011 68%`<br />
MALBOROUGH DISTRICT 2,830 1,696 60%<br />
WEST COAST REGION 2,200 1,279 58%<br />
Buller District 660 286 44%<br />
CANTERBURY REGION 37,300 25,203 68%<br />
OTAGO REGION 11,870 8,186 69%<br />
SOUTHLAND REGION 6,780 3,884 57%<br />
Southland District 2,250 924 41%<br />
NEW ZEALAND 311,850 187,218 60%<br />
South Auckland is not an officially defined area and despite having a local population of nearly<br />
300,000 people it is usually included in an administrative area known as Counties-Manukau. The<br />
aggregation of South Auckland into Counties-Manukau hides the relative disadvantage of some<br />
communities through the averaging of social outcomes such as ECCE enrolments across middleincome<br />
and low-income neighbourhoods. South Auckland can now be quite easily defined by the<br />
Auckland Council wards of Manukau and Manurewa-Papakura and by the local board areas which<br />
are known as Mangere-Otahuhu, Otara-Papatoetoe, Manurewa and Papakura. Tamaki, another<br />
urban community to the north and east of Otahuhu, has similar socio-economic characteristics to<br />
South Auckland although historically this community is seen as part of the Auckland isthmus and<br />
makes up a distinct part of the Maungakiekie-Tamaki ward of the Auckland Council.<br />
169
Table 15.8 below shows the inadequate distribution of ECE centres, and therefore places, across the<br />
Tamaki and South Auckland communities, a large urban area where a single urban community can<br />
span six to eight kilometres across. The size and scale of such communities means that the local<br />
availability 126 of ECE centres is an important determinant of the feasible access families have to ECE<br />
services and opportunities. 127<br />
Table 15.8. Distribution of ECE places in Tamaki & South Auckland 2010<br />
(Source: Education Counts, 2011)4<br />
Under 5’s<br />
population<br />
(June 2010)<br />
ECE<br />
enrolments<br />
(July 2010)<br />
Enrolment as<br />
% of under 5’s<br />
Tamaki subdivision of Maungakiekie-Tamaki<br />
Ward<br />
4,210 1,358 32%<br />
– Panmure/Glen Innes/Point England 1,710 726 42%<br />
Mangere-Otahuhu Local Board Area 9,234 3,144 34%<br />
– Otahuhu 1,580 473 30%<br />
– Mangere 7,654 2,671 35%<br />
– Mangere – excluding Auckland Airport<br />
precinct<br />
7,654 2,356 31%<br />
Otara-Papatoetoe Local Board Area 7,140 3,276 46%<br />
– Otara 4,095 1,395 34%<br />
– Papatoetoe 3,046 1,881 64%<br />
Manurewa Local Board Area 9,115 3,151 35%<br />
– Manurewa west (west of railway line) 5,630 1,240 22%<br />
– Manurewa east (east of railway line) 3,485 1,911 55%<br />
Papakura Local Board Area 4,485 2,046 46%<br />
– Papakura – core urban area 3,005 966 32%<br />
South Auckland (excluding Tamaki) 29,974 11,890 40%<br />
AUCKLAND REGION 108,980 56,225 52%<br />
NEW ZEALAND 311,850 187,218 60%<br />
While the whole of the area covered by the data in Table 15.8 is poorly served with ECE places,<br />
there is a story within the story. Some areas such as Papatoetoe and the Auckland Airport precinct,<br />
where there are high levels of employment, are relatively well served. Others such as Otahuhu and<br />
Manurewa West are virtual ECE deserts with local provision of ECE at half the national average.<br />
Somewhat ironically, these communities are the ones with high concentrations of pre-schoolers with<br />
8.5% of Otahuhu’s population and 11% of Manurewa West’s population being under five years old,<br />
compared to the national average of 7%. Urban Papakura, Mangere and Otara have rates of ECE<br />
provision which are scarcely better than those of Manurewa West and Otahuhu.<br />
126 In these contexts, ‘local’ is defined by walking distance.<br />
127 Numbers of children attending Kohanga Reo have been estimated based on average attendances in the local authority<br />
area. Home-based services have been omitted from local totals because the business address may not relate to where<br />
services are offered, but home-based services are included in the totals on this table.<br />
128 See footnote 6 for details of data source and limitations.<br />
170
Table 15.9. Distribution of ECE places in Hastings District 2010 128<br />
Under 5’s population<br />
(June 2010)<br />
ECE enrolments<br />
(July 2010)<br />
Enrolment as<br />
% of under 5’s<br />
Flaxmere 1,205 475 40%<br />
Hastings urban area 2,530 1,654 65%<br />
Havelock North 700 757 108%<br />
HASTINGS DISTRICT (includes<br />
homebased services)<br />
5,760 4,338 74%<br />
The pattern of distribution across all three areas covered by the Tables 15.8, 15.9 and 15.10 is similar<br />
in that levels of ECE provision are much higher in middle-class suburbs and neighbourhoods than they<br />
are in poorer communities.<br />
Table 15.10. Distribution of ECE places in Porirua City 2010 129<br />
Under 5’s population<br />
(June 2010)<br />
ECE enrolments<br />
(July 2010)<br />
Enrolment as %<br />
of under 5’s<br />
Porirua East 2,170 924 43%<br />
Rest of Porirua 2,665 1,508 57%<br />
Porirua City (ECE centres only)<br />
Havelock North<br />
PORIRUA CITY (includes<br />
homebased services)<br />
4,820 2,432 50%<br />
4,820 3,028 63%<br />
To provide a comparison with Auckland, and to illustrate the extent of the inequitable distribution of<br />
ECE opportunities within these communities, Tables 15.9 and 15.10 report the distribution of ECE<br />
places in Hastings District and Porirua City respectively.<br />
The comparison is most marked in the case of Hastings District where Havelock North has more than<br />
two-anda-half times the level of provision of Flaxmere. A similar pattern of distribution can be seen<br />
between Porirua East and the western and northern suburbs of Porirua City, between urban Papakura<br />
and the surrounding rural residential suburbs and between Papatoetoe and Otara. Bucking this pattern<br />
is the case of Tamaki where there is a higher level of ECE provision in Glen Innes, Point England and<br />
Panmure than in the wealthier nearby suburbs of Mt Wellington, Panmure Basin and Ellerslie South.<br />
If Aucklanders were to have the same level of provision of ECE services and opportunities as other<br />
New Zealanders, an additional 12,000 places would need to be provided in that city, with over 6,000<br />
of these places in South Auckland and a further 1,000 in Tamaki. The Government’s commitment to<br />
provide capital funding for community-based ECE centres in South Auckland is welcomed although<br />
the rate at which these are being built is unlikely to keep pace with population growth let alone make<br />
up for this deficit.<br />
The failure to plan<br />
There is evidence that poorer communities and/or communities with high concentrations of Māori<br />
and Pasifika people have lower levels of provision of ECE services and centres. There is also<br />
some evidence (see Table 15.3) that, although Asian and Pasifika children have benefited most in<br />
129 See footnote 6 for details of data source and limitations.<br />
171
proportional terms from the recent increase in ECE enrolments and participation, it is European/<br />
Pakeha families and their pre-school children who have benefited most in numerical terms. While<br />
such an outcome might be expected given the sheer numerical dominance of European/Pakeha<br />
people within the population, especially outside of Auckland, European/Pakeha already had the<br />
highest rate of participation before the rapid increase in ECE funding from 2006.<br />
Rates of ECE participation by Māori have actually declined over the past five years despite the<br />
increase in the numbers of Māori children actually enrolled in a licensed ECE centre or service. 130<br />
This paradox is due to the recent baby boom of which almost one third are Māori children. This has<br />
meant that the population of Māori pre-schoolers has grown at a faster rate than their enrolment in<br />
ECE. Based on the enrolment rates reported in Table 15.6 for Māori and non-Māori children, if Māori<br />
enrolment rates are to be lifted to those of non-Māori then an additional 17,000 to 18,000 places are<br />
needed. 131<br />
This decline in enrolment rates may also be a feature of Pasifika families’ ECE experience given their<br />
share of recent births compared with their share of ECE enrolments (see Table 15.5), although there<br />
are no reliable estimates of the Pasifika population on which to confidently base this claim. However,<br />
estimates of the shortfall in Pasifika enrolments suggests that an additional 10,000 to 12,000 places<br />
would be required to bring them up to national average enrolment rates. 132<br />
Importantly, there is no evidence that the relative disadvantage in the ECE stakes of Māori and<br />
Pasifika families and of poor communities has been addressed by the huge increase in ECE funding<br />
between 2006 and 2011 (see Table 15.1). There is no evidence that this neglect was intentional, it<br />
has been a consequence of the ECE policy settings.<br />
Unlike the compulsory and tertiary education sectors, the early childhood sector has no public agency<br />
responsible for planning the supply of educational services. Since its inception, the early childhood<br />
education sector’s growth has been driven by local initiative rather than need: kindergartens,<br />
Playcentres, and more recently Kohanga Reo were all initiated by local community efforts. This<br />
meant that if a community had high levels of transience or lacked leadership or discretionary income,<br />
pre-school educational opportunities were patchy or non-existent.<br />
130 In 2006, 32,351 Māori children aged under five were enrolled in a licensed ECE service out of a total estimated population<br />
of 73,040, providing an enrolment rate of 44.3%. By 2010, 38,288 Māori children under five were enrolled in ECE from<br />
a total population of 89,160 meaning an enrolment rate 42.9%. In 2006 72.7% of three- and four-year-old Māori children<br />
were enrolled but by 2010 this rate had fallen to 69.9%.<br />
131 For under 3s this is 41%–27% = difference in enrolment rate of 14% x 55,850 in the under-3 population = 7,819 + for<br />
3- and 4-year-olds to lift enrolment rate from 70% to 100% = 30% difference x 33,310 = 9,993.<br />
132 Birth statistics report that up to 10,000 children with Pasifika descent are born in New Zealand each year. As 75% of these<br />
children have two parents who identify as Pasifika it is likely that between 7,500 and 8,500 children will be identified as<br />
Pasifika on their enrolment in school each year. At a national average ECE enrolment rate of 60% this would mean that<br />
between 22,000 and 24,000 Pasifika children would be enrolled in ECE. In 2010 there were 12,111 children enrolled (see<br />
Table 15.3).<br />
172
Table 15.11. Changes in ECE provision 2001-10 (total enrolments)<br />
(Source: Education Counts, 2011)<br />
Institution type 2001 2002 2003 2004 2005 2006 2007 2008 2009 2010<br />
Kindergarten 45,439 45,169 45,109 45,287 44,920 44,435 43,695 41,487 39,346 37,600<br />
Playcentres 14,786 14,879 15,200 15,440 15,059 14,888 14,664 14,929 15,171 15,049<br />
Education &<br />
Care Centre<br />
73,192 76,246 78,967 81,096 83,889 86,059 91,733 97,756 101,424 109,204<br />
Homebased 8,546 8,591 9,591 9,922 9,770 9,802 11,073 13,065 15,054 17,084<br />
Te Kohanga Reo 9,546 10,389 10,319 10,418 10,070 9,493 9,236 9,165 9,288 9,370<br />
Correspondence<br />
School<br />
947 913 991 922 813 577 737 591 627 617<br />
Total 152,504 156,187 160,173 163,085 164,521 165,254 171,138 176,993 180,910 188,924<br />
Community<br />
based*<br />
Share<br />
community<br />
based<br />
69,819 70,437 70,628 71,145 70,049 68,816 67,595 65,581 63,805 62,019<br />
45.8% 45.1% 44.1% 43.6% 42.6% 41.6% 39.5% 37.1% 35.3% 32.8%<br />
*Note: Kindergarten, Playcentres and Kohanga Reo<br />
More recently the extension of funding to private sector operators and to social service agencies has<br />
seen an expansion of ECE centres and services into communities where some level of co-payment<br />
from parents was feasible. The needs of families unable to afford such co-payments have been<br />
overlooked or left to community-based ECE providers with long waiting lists to look after. These<br />
community providers have not fared well in this new environment as indicated in Table 15.11 above<br />
which shows both a relative and absolute decline in community-based ECE providers especially<br />
since 2006.<br />
Conclusion<br />
It is a great pity that the Labour Government did not address the inequity of access to ECE as<br />
part of its expansion of ECE budgets. The system we have now remains inequitable but is twice<br />
as expensive, and there appear to be no easy answers for addressing the identified two-fold and<br />
overlapping deficits. There is the deficit created by the children not enrolled in ECE, principally Māori<br />
and Pasifika children. The second deficit is where ECE centres are missing from in a spatial sense.<br />
Most likely these missing ECE centres would otherwise be found in suburbs populated by Māori and<br />
Pasifika families and in small and medium-sized towns populated by Māori communities. However,<br />
the highest deficit is in Auckland.<br />
There is firm evidence of the benefits of good quality early childhood education for later educational<br />
success; and that those who miss out on meaningful access to ECE share a sequence of misfortunes<br />
and missed opportunities throughout their lives. This is not to say that more equitable access to ECE<br />
centres and services is the silver bullet to reducing inequality and rates of welfare dependency, but it<br />
is an important cornerstone of any credible attempts to do so. The ideal response to these deficits in<br />
ECE availability should not be more of the same. The model of market-based provision and demand<br />
subsidies has clearly not worked for New Zealand’s poorest and most vulnerable children.<br />
173
Recommendations<br />
• Government commits to reducing reliance on private sector provision of early childhood education<br />
and care as a long-term objective, aligning the early childhood sector with primary education in<br />
terms of accepting government responsibility for both quality and access expectations in order to<br />
ensure equitable provision;<br />
• Government enables adequate funding provision to ensure that all early childhood education<br />
centres are fully staffed by qualified teachers, and further require ratios of teachers to children and<br />
unit sizes to be maintained in accord with quality guidelines;<br />
• Establish a model of ECE provision that is more intentional in terms of who it serves, where it is<br />
located and what else it provides to support parents and families;<br />
• Base the new model of ECE provision on a neighbourhood-by-neighbourhood and a town-bytown<br />
assessment of future early childhood education needs;<br />
• Start thinking about travel distances in terms of pushing strollers rather than in terms of driving<br />
SUVs.<br />
174
Chapter 16. A turn for the worse? Some recent<br />
developments in the school sector<br />
Vicki M Carpenter 133 and Martin Thrupp 134<br />
Introduction<br />
A persistent feature of the New Zealand school system is the so-called<br />
‘long tail of underachievement’ by economically poor and usually Māori<br />
and Pasifika children, and the pattern of much higher achievement<br />
by middle class and usually Pakeha and Asian children. The 2009<br />
Programme for International Student Assessment (PISA) results on<br />
the Reading Literacy of 15-year-olds, demonstrate that “among the<br />
eight top or high-performing countries or economies, New Zealand had<br />
the widest range of scores … between the bottom five percent (5th<br />
percentile) and top five percent (95th percentile) of students” (Telford<br />
& May, 2010, p. 15). For the most part we see this wide achievement<br />
gap reflecting inequitable conditions in New Zealand society with policy<br />
changes in housing, health, minimum wages, benefit levels being<br />
prerequisites for more socially just school outcomes (Anyon, 2005; Snook & O’Neill, 2010). At the<br />
same time we recognise that education policy has a part to play in unequal educational outcomes<br />
in the way it influences, directs and resources schools, and allows and encourages teachers and<br />
principals to exercise their agency.<br />
Turning then to New Zealand education policy, we note that the issues and recommendations signalled<br />
in the previous (2008) version of <strong>Left</strong> <strong>Behind</strong> are no closer to being addressed. The ‘inconvenient<br />
truth’ of middle-class advantage is as hegemonic as ever, state school zoning systems favour those<br />
already advantaged and full service schools, despite their successes, have not gained momentum.<br />
There is also the stigmatising of lower-decile schools in the media and amongst parents which<br />
continues unabated, the problem that teacher supply is still an issue in lower-decile schools (M. Lee,<br />
2010), and the ‘one-size fits all’ perspectives that continue to dominate many areas of teaching and<br />
teacher education. The impact of child poverty is often underestimated.<br />
Nevertheless, just as education policy could improve the ways it addresses child poverty, it can also<br />
get worse. There are a number of recent school policy developments that we view with concern<br />
because they have the potential to reinforce social inequalities and the effects of poverty in education.<br />
These developments include: more funding to private schools, building schools using public–private<br />
partnerships, changes to zoning laws to give more preference to family connections, the contracting<br />
out of support services to schools, the development of National Standards, and the proposed ‘Teach<br />
First New Zealand’ scheme in teacher education. Although not much has yet been written by New<br />
Zealand academics about these developments (but see, for instance (Carpenter, 2011; Thrupp &<br />
Irwin, 2010), plenty of international literature gives reason for concern.<br />
133 Dr Vicki M Carpenter, Principal Lecturer, School of Critical Studies in Education, The University of Auckland, is a registered<br />
teacher who has taught and held senior positions in a range of New Zealand schools.<br />
134 Dr Martin Thrupp, Professor of Education at Waikato University, has lectured in the UK and undertaken large-scale<br />
research projects in the UK and Europe. He is a member of the Management Committee of <strong>Child</strong> <strong>Poverty</strong> <strong>Action</strong> <strong>Group</strong>.<br />
175
In the space available here we have decided to concentrate on the last two areas – the development<br />
of National Standards, and the proposed ‘Teach First New Zealand’ scheme in teacher education.<br />
These are both good areas for illustrating how policies that do not seem to have an immediate<br />
connection to concerns about poverty may nevertheless pose threats to the children of the poor in<br />
New Zealand. They also well illustrate how our policymakers seem to be often ignoring international<br />
evidence in this regard.<br />
National Standards<br />
Immediately after the election in 2008, legislation to bring National<br />
Standards into all primary and intermediate schools was passed and the<br />
policy was launched in October 2009 (Thrupp & Irwin, 2010). It is the general<br />
assumptions of this new policy, along with its likely effects if it shares of<br />
some the researched characteristics of high-stakes assessment systems<br />
in other countries that make it a threat to the children of the poor. Here we<br />
briefly describe the National Standards policy and its assumptions about<br />
children from poor families and then turn to its potentially damaging effects on those children.<br />
New Zealand’s National Standards are different from a national testing regime where all students<br />
are tested against the same test as in many other countries. Rather they involve teachers and<br />
schools using a range of tests (most of which were designed for formative purposes), as well as<br />
other indications of a child’s level of achievement, to make judgments about a child’s achievement<br />
against a four-point scale: above; at; below; and well below, the standard. These judgments are<br />
made after 1, 2 or 3 years at school in the junior school and then at their year level from years 4–8.<br />
As yet there is no formal process of national moderation between schools, although many schools<br />
are moderating teachers’ judgements internally and in some cases within a cluster of local schools.<br />
The policy requires schools to report to parents in ’plain English’ about a child’s achievement against<br />
the National Standards, although schools do not need to use the language of the four-point scale in<br />
this reporting. On the other hand, schools do need to explicitly report against the scale when they<br />
report annually to the Ministry about student achievement, and from 2011 they are also required to<br />
set annual targets for student achievement, again using the four-point scale.<br />
Although National Standards are not a targeted policy, the Government has made much of National<br />
Standards being able to address the previously noted long tail of underachievement amongst poor<br />
and mainly Māori and Pasifika students. This discursively places the responsibility for addressing the<br />
low achievement levels of students from low socio-economic backgrounds on schools and teachers.<br />
In doing so the policy represents another iteration of the politics of blame where the quality of student<br />
achievement is seen as the result of school-based factors and reference to wider contextual issues<br />
such as socio-economic constraints are ruled out as excuses for poor performance (Thrupp, 2009).<br />
The details of the policy often reflect the same unrealistic thinking. For instance one predictable<br />
outcome of such a policy is that students from poor families will often start behind and be found ‘well<br />
below’ standard year after year even if they are making progress. But rather than acknowledging that<br />
this is a likely effect of the policy, the Government expects schools to rapidly accelerate the progress<br />
of students from disadvantaged backgrounds so that they catch up with their more advantaged peers.<br />
In practice this means that junior teachers are expected to take children who can often barely hold a<br />
pencil or know any letters of the alphabet at five years old and catch them up with students who can<br />
already read well and will continue to draw on considerable material and cultural capital throughout<br />
176
their primary school lives. Disadvantaged students are also supposed to meet national standards that<br />
have turned out to be ‘aspirational’, set in some year levels even above national test means. Finally,<br />
little additional support is being made available to schools except for fifty ‘Student Achievement<br />
Practitioners’ (SAP) who will travel from school to school dispensing advice. As another indication<br />
of the politics of blame, these SAPs are not described as helping schools deal with ‘disadvantaged’<br />
children, but with children who are ‘under-served by schools’ (Ministry of Education, 2011a).<br />
Many other problems caused by the National Standards for the<br />
children of the poor remain to be seen but can be predicted from<br />
research findings about the effects of high stakes assessment in<br />
other countries such as England and the USA. They include:<br />
• schools becoming more unwilling to enrol low socio-economic<br />
students because their level of performance is lower than middle-class students (‘commodification’<br />
of students (Bagley, Woods, & Glatter, 2001));<br />
• a narrowing curriculum focus which becomes less likely to tap the interests of low socio-economic<br />
students (Alexander, 2009; Hursh, 2008; Nicholls & Berliner, 2007; Stobart, 2008);<br />
• the needs of low socio-economic students being overlooked because schools are busy prioritising<br />
the teaching of those students whose achievement will make the most difference to schools’<br />
reputations (‘educational triage’ (Gillborn & Youdell, 2000)); and<br />
• damaging effects on students’ conceptions of themselves as learners (‘i’ll be a nothing’ (Reay &<br />
William, 1999)).<br />
Of course research is required to indicate whether these problems found internationally are going to<br />
be echoed in the New Zealand context, even if some variant of these impacts is quite predictable. The<br />
second author is undertaking such research through the ‘Research, Analysis and Insight into National<br />
Standards’ (RAINS) project, a three-year study investigating how the Boards of Trustees, leadership<br />
teams and teachers of New Zealand primary and intermediate schools are actually responding to<br />
the National Standards in everyday practice and how this response is affecting student learning.<br />
This project is also concerned with the ‘enactment’ of the National Standards, for instance how<br />
individuals in different roles and with different educational beliefs, histories and political stances are<br />
interpreting information to create particular practices, how the National Standards interact with other<br />
policies being enacted in schools such as the New Zealand Curriculum and the Leadership BES, and<br />
how different school contexts (socio-economic, ethnic, school size and type, urban/rural, etc) and<br />
access to resources are influencing practice. Looking at this complexity within and across schools<br />
will illuminate whether there are patterns common enough to characterise the National Standards as<br />
genuinely national or whether they will reflect local differences and inequalities.<br />
For low-decile schools there is also considerable risk of the development of public league tables<br />
of National Standards results as they are unlikely to score well in these compared to middle-class<br />
schools. The impact of such league tables of performance would be far-reaching as they would<br />
intensify public demand for higher achieving middle-class schools, leaving low-decile schools<br />
increasingly disadvantaged in terms of public and professional perception, student enrolments,<br />
funding and staff recruitment. Eventually some low socio-economic schools may be deemed no<br />
longer viable and closed, leaving disadvantaged communities without local schools. It would not be<br />
surprising then if it were schools dominated by students from low socio-economic backgrounds that<br />
177
were most concerned about National Standards. At the same time, because National Standards<br />
are also being criticised by teachers and principals in schools of all deciles, there is an important<br />
opportunity here to connect the concerns of the poor to middle-class interests that are often more<br />
powerful and more likely to be listened to.<br />
Teach First NZ (TFNZ) scheme<br />
At the moment, with few exceptions, initial teacher education (ITE) takes place in Faculties of<br />
Education in Universities, or Wananga. BEd or BTchg degrees take up to four years to complete,<br />
and graduates usually teach in primary schools. Intending primary and secondary teachers who<br />
already have an undergraduate degree are able to complete a one-year graduate ITE programme.<br />
All ITE includes placements in schools, learning the profession alongside expert practitioners. After<br />
graduation the first two years in the classroom, as provisionally registered teachers, involves 4 to<br />
4.5 days per week classroom contact. Teacher professional development overseen by professional<br />
colleagues is also required. Full teacher registration may then be conferred provided the Beginning<br />
Teacher is showing competence (see www.teacherscouncil.govt.nz).<br />
It has recently been signalled that a Teach First New Zealand (TFNZ) scheme of ITE is likely to be<br />
introduced in New Zealand in 2012 (www.teachfirstnz.org). This imported model mirrors overseas<br />
initiatives such as TeachFirst in the UK, Teach for Australia, and Teach for America. By 2013, 20<br />
selected ‘top graduates’ will be fast tracked into hard–to-staff positions in Auckland and Northland’s<br />
low-decile secondary schools. The students will have completed a six-week summer school ITE<br />
programme. For the following two years they will be working as unqualified teachers in economically<br />
poor communities. TFNZ proponents (an independent charitable trust with business funding)<br />
emphasise the attraction of top graduates, and the positive effects such people are likely to have<br />
on low-decile schools. Their advertising brochure places emphasis on the ‘aura of selectivity, similar<br />
to leading corporate firms’, with the programme providing ‘professional and personal leadership<br />
development’ (TFNZ, 2011, p. 15). The proponents’ expectations are that TFNZ alumni numbers<br />
will reach 90 by 2017, and that the programme will expand into other parts of New Zealand. In<br />
terms of the graduates, teaching will fulfil a strong service component (rather like VSA) for their later<br />
leadership career aspirations, probably in business.<br />
The scheme will have its attractions for both students and schools. For the ITE students it offers a<br />
full-time salaried position for two years while learning how to teach in schools. As indicated above, it<br />
is being marketed in a way that will appeal to the idealism of many young people. For economically<br />
challenged schools with high staffing needs, the possibility of having someone to teach a class may<br />
also be appealing, even if the graduate is not a registered teacher.<br />
The TFNZ programme can, however, also be viewed as a token ITE programme combined with a<br />
shallow ‘learning on the job’ model of teacher education. We have a range of concerns about this<br />
development. First, given that New Zealand and overseas research demonstrates the ability to form<br />
strong relationships with students is a prerequisite for effective learning in low-decile schools (Bishop,<br />
Berryman, & Richardson, 2001; Carpenter, McMurchy-Pilkington, & Sutherland, 2002; Delpit, 2006;<br />
Hawk, Cowley, Hill, & Sutherland, 2002), it is hard to envisage how ‘parachuted’, probably white and<br />
middle-class students, with very limited ITE will achieve that. Second, good graduates are already<br />
attracted to teacher education, B+ grade averages and higher have been common in recent years;<br />
that aspect of the TFNZ rationale appears redundant. Third, a six-week programme signals a very<br />
serious and worrying ‘dumbing down’ of teacher expertise and professionalism. Fourth, TFNZ is<br />
178
funded by a charitable trust. Why is the state abdicating responsibility for its failure to address the<br />
‘long tail of underachievement’? What is the long-term agenda of funders? Business (for example,<br />
Chapman Tripp, Deloitte, KPMG) is likely to gain some control of ITE curriculum – the six-week<br />
programme they advocate will unquestionably limit curriculum and pedagogical content. Whose<br />
interests will be served by TFNZ? The winners, we suggest, are unlikely to be pupils and their<br />
communities.<br />
Research on similar overseas programmes, such as Teach for America (TFA) is not encouraging.<br />
It tends to demonstrate that such programmes have made very little positive difference to overall<br />
student achievement. TFA was established over 20 years ago, and thousands of young people,<br />
selected as top graduates from various universities, have completed five weeks of teacher education<br />
and have been mentored into two-year positions in America’s hard-to-staff poor urban schools. Yet<br />
the programme has also been widely criticised. Labaree (2010, p. 52) has suggested that TFA’s<br />
approach:<br />
reinforces an old and dangerous vision of teaching as a form of slumming, a missionary effort<br />
by the White middle class to elevate minorities and the lower classes through the medium of<br />
education.<br />
Darling-Hammond (1994) is another researcher who is<br />
scathing about the TFA programme. She describes it as<br />
bad for recruits (they are ill-prepared), for schools (they<br />
lack support and resources and the programmes are<br />
disruptive), and children (they are poorly taught). She<br />
argues that TFA does not look at teaching as a profession but instead relies on enthusiasm and<br />
youth, that TFA “cheapens education” because it says that “anyone can teach”. Darling-Hammond,<br />
(1994, p. 33) argues for “alternatives to putting ill-prepared recruits in classrooms for a revolving-door<br />
trip into and out of teaching”. With colleagues she has also found TFA recruits less effective than<br />
certified teachers (Darling-Hammond, Holtzman, Gatlin, & Heilig, 2005).<br />
In our view New Zealand does not have the population of teacher education students to support truly<br />
parallel and comprehensive programmes for low socio-economic schools such as those that exist<br />
in the USA (see Leland & Harste (2005) for an example). We could, however, do far more within<br />
existing ITE programmes to better serve the needs of children in poverty (see Carpenter (2010)<br />
for a programme initiative). A critical evaluation of how current ITE programmes are meeting the<br />
needs of lower-decile schools, followed by appropriate changes, would be a better way forward. ITE<br />
demographics and programme content matters. It matters that those leading and involved in ITE<br />
are aware of the seriousness of our current situation for the education of children of the poor, and<br />
are well prepared and willing to address the social justice issues New Zealand faces. It also matters<br />
that adequate ITE programme time and curriculum content is made available for students to grapple<br />
with the deep and complex attitudinal and professional issues involved with teaching in lower-decile<br />
schools.<br />
Suitable attributes of teachers for economically poor rural or urban communities need to be a key<br />
focus. In such places, many are Māori and Pasifika; lots are on benefits; work is low paid; community<br />
health in general is poor; home ownership is minimal; household overcrowding can be the norm;<br />
teacher and student transience is high (more than 60% per annum in some schools); student<br />
attendance can be erratic; large numbers of children can arrive at school hungry or without lunch;<br />
179
many students do not have English as their first language; and most adults have minimal education.<br />
At the same time, children are very loved by their families, and most have strong cultural and religious<br />
beliefs which are central to, and binding of, their communities. Communities have high expectations<br />
that schools will educate their children well. Within the macro-level structural limitations which can<br />
impede their lives, parents are invariably supportive of their children’s education.<br />
An ideal teacher for such communities is, like all other teachers, intelligent, knowledgeable about<br />
subject areas and teaching strategies, hard-working, and compassionate. The ability to form strong,<br />
positive and empowering relationships with pupils and their communities is, however, the extra and<br />
baseline prerequisite for successful teaching in lower-decile schools (Carpenter, et al., 2002; Hawk,<br />
et al., 2002; Jeynes, 2007; Macfarlane, Glynn, Cavanagh, & Bateman, 2007). More than teachers<br />
working in wealthier contexts, lower-decile school teachers need to understand the politics of pupils’<br />
lives and be advocates for social justice. At the same time teachers in lower-decile schools must<br />
have very high expectations of all learners.<br />
How successful is ITE at preparing teachers for effective teaching in such contexts? A recent Ministry<br />
of Education report (Kane, 2005) indicated that ITE content requires serious critical reflection and<br />
change. Aside from Maori-centred providers, the researchers found there was “less compelling<br />
evidence … that (ITE) qualifications are underpinned by critical themes or ethics, such as commitment<br />
to inclusion or social justice” (Kane, 2005, p. xiv). An identified implication of the findings was that<br />
student teachers should be required to demonstrate how they work effectively with Maori and Pasifika<br />
children (Kane, 2005, p. xxi). All of this takes time and suggests more rather than less, and more<br />
tightly focused ITE preparation is required before students are given responsibility for classrooms of<br />
pupils.<br />
ITE demographics also require greater attention. Most of today’s<br />
successful ITE applicants have a white middle-class habitus, and by<br />
far the largest percentages of applicants are women. The New Zealand<br />
teaching workforce was 76% women in 2010, and 74% were Pakeha<br />
or European. Meanwhile our national demographic is changing. By<br />
2026, Māori, Asian and Pasifika populations are likely to form 60% of the population (Statistics New<br />
Zealand, 2010b). Māori, Pasifika and working-class children generally comprise our long tail of<br />
underachievement – they are those our current system is failing. While we are not arguing that an<br />
ethnic match is essential for effective teaching, children can be motivated by observing and being<br />
with teachers of the same ethnicity who are in positions of authority and this positioning may be used<br />
to advantage by such teachers.<br />
In short, we maintain that ITE student selections and programme content can and should be a<br />
stronger part of the solution. We do not share the optimism of the TFNZ programme’s proponents, and<br />
have serious misgivings about the effects TFNZ recruits might have. <strong>Child</strong>ren in poor communities<br />
deserve more than an education funded by charity, which places teachers in their classrooms who<br />
will be ill-prepared by the standards of today’s ITE, let alone by the standards of ITE that was really<br />
focussed on meeting the needs of children in rural or urban, economically poor communities.<br />
180
Conclusions<br />
This paper has traversed a number of themes relevant to schools and child poverty. Perhaps one of<br />
the most important points illustrated by our discussion of National Standards and Teach First New<br />
Zealand is that the policies and practices which need to be adapted or avoided to reduce the impact<br />
of child poverty in education are often much less obvious than, say, school programmes to provide<br />
food to poor children, even if that is also worthwhile. Rather there are numerous aspects of schooling<br />
which need to be addressed, including policies which are currently being rolled out. Also notable is<br />
that while both the National Standards and TFNZ development make some claim on being different<br />
than what is happening internationally, there is much relevant international research which suggests<br />
caution about these and other recent policies.<br />
The willingness of proponents to ignore or dismiss such research is remarkable but the fact is that neoliberal<br />
policy is often not evidence-informed. For instance in the US, Lubienski (2008) points out that<br />
although the body of academic research evidence does not support US school choice programmes,<br />
these continue to grow because choice has increasingly become an ideology supported by advocacy<br />
groups despite whatever the research ‘says’. Here in New Zealand we think a careful reading of<br />
relevant research suggests alternatives to both National Standards and TFNZ that would better<br />
serve the children of the poor and indeed New Zealand society as a whole.<br />
Recommendations<br />
• That the New Zealand Government acknowledge that international research suggests that the<br />
National Standards policy may have perverse and damaging effects;<br />
• That the Government investigate such effects thoroughly and respond accordingly rather than<br />
pushing ahead with the policy regardless of its impact;<br />
• That the Government look for ways to avoid further damage being created by ‘league tables’<br />
of National Standards achievement, acknowledging that it is not feasible to take full account of<br />
school context in such tables;<br />
• That the Government takes sustained action towards addressing the supply of quality teachers to<br />
low-decile schools in ways that do not involve mirroring charity and business-based models which<br />
overseas research have shown to be largely ineffective;<br />
• That teacher education providers take greater account, in teacher education and postgraduate<br />
courses, of the social justice issues surrounding education and children in poverty;<br />
• That teacher education providers actively develop and promote courses for teachers wishing to<br />
teach in lower-decile schools. Such courses would focus on empowering and culturally appropriate<br />
teaching and learning in lower socio-economic contexts.<br />
181
Chapter 17. Youth and employment<br />
M. Claire Dale, 135 and Lucie Trask, Nicole Slight, Sarah Larsen, and Caleb McConnell 136<br />
It is always tempting for governments to treat the<br />
young as being expendable. They don’t vote, they<br />
have few commitments, and most of them seem<br />
able enough to cope with whatever gets thrown their<br />
way. Here – and elsewhere around the world – the<br />
government seems willing to exploit that resilience,<br />
and be relatively complacent about its failure to<br />
provide outlets for the intelligence and creativity of<br />
the next generation…. Moreover, … an entire generation of students who have been unlucky<br />
enough to graduate in a recession now risk being passed over by employers as ‘damaged goods’<br />
once the upswing in economic activity finally arrives. (G. Campbell, 2011) 137<br />
Youth unemployment in New Zealand<br />
High numbers of unemployed youth is a major national and international issue. The Household<br />
Labour Force Survey (2010a) showed that most of the jobs lost in the downturn were held by young<br />
people. Between December 2007 and December 2009, employment of 15-19 year olds declined<br />
by 34,400, and employment of 20-24 year olds declined by 11,300; while employment for the<br />
population 25 years and older increased by 13,200. Māori youth employment fell by 17% between<br />
December 2007 and December 2009, followed by European (down 14%) and Pacific youth (down<br />
12%). Employers appear to prefer older, experienced workers due to perceived attitudes of youth<br />
to work and stereotypes of young people’s work ethic. It also seems that, when compared to older<br />
workers, youth have been concentrated in the most affected industries of hospitality, the retail trade,<br />
communication services and construction, and are more likely to lose their jobs (Department of<br />
Labour, 2010).<br />
Reasons for the low rates of<br />
youth employment in New<br />
Zealand (Figure 17.1) and<br />
internationally include the<br />
impact of the recession:<br />
young people are more likely<br />
to be laid off due to their lack<br />
of skills and experience.<br />
Other factors are changes to<br />
technology, and increasing<br />
use of technology in place of<br />
human labour.<br />
Figure 17.1. Employment Rate , 2006-2011 (Department of Labour, 2011b)<br />
135 Dr M. Claire Dale is Research Fellow with the Retirement Policy and Research Centre at the University of Auckland, and<br />
a member of <strong>Child</strong> <strong>Poverty</strong> <strong>Action</strong> <strong>Group</strong>.<br />
136 Lucie Trask, Nicole Slight, Sarah Larsen, and Caleb McConnell are studying Law at Victoria University, and are Members<br />
of the Wellington Community Justice Project.<br />
137 Thanks to Gordon Campbell for his images and analysis of youth unemployment in New Zealand.<br />
182
Also, employers do not have time or resources to train young people; and tax cuts have reduced<br />
funding for apprenticeships (Tertiary Education Union, 2011). It is worth noting that in Germany and<br />
other countries that have maintained provision of, and funding for, apprenticeships, the effects of the<br />
economic downturn have not been so concentrated on the young.<br />
In New Zealand, after a major dismantling of the apprenticeship system in the 1970s, the modern<br />
apprenticeship was introduced in the 1990s, and now that, too, is due for a major shake-up as it<br />
is failing both the funders and the apprentices who are involved. A damning report by the Mayors’<br />
Taskforce for Jobs, representing 68 of the country’s 73 mayors, has found the system is dogged<br />
by dysfunction and tension between industry training organisations and other apprenticeship<br />
coordinators: apprenticeships are reaching only 4.2% of Pakeha in the target 16 to 21 age group,<br />
2.9% of young Māori and 1.3% of Pacific youth; and only 12% of the 12,933 apprentices are female.<br />
Even among those who started apprenticeships in 2002, only 41% of Pakeha, 34% of Pacific and<br />
just 27% of Māori completed their apprenticeships within six years – much longer than the expected<br />
three to four years (Collins, 2010).<br />
While New Zealand has a low rate Figure 17.2. Adult and youth unemployment 2010<br />
of unemployment at around 6.6%, (Source: Economist, from OECD data)<br />
compared to the OECD average of<br />
8.2%, one in five young New Zealanders<br />
are out of work (Department of Labour,<br />
2011b). Data from the OECD (Figure<br />
17.2) for the 2010 September quarter<br />
indicated that 19.4% of New Zealanders<br />
aged 15 to 24 were unemployed. Some<br />
regions are worse off than others. In<br />
Dunedin in February 2011, more than<br />
one in three of those receiving an<br />
Unemployment Benefit were under the<br />
age of 25. At the same time, both Otago<br />
University and Otago Polytechnic are<br />
expecting to limit enrolments (Rudd,<br />
2010). So, young people are being<br />
excluded from opportunities for both<br />
employment and education. It is not surprising that the increased pressure on families is coinciding<br />
with a rise in violence against family members (Studholme, 2011).<br />
In June 2011, while unemployment across New Zealand was at 6.6%, in Auckland it was 7.9%, and<br />
in Northland it was 9.8%, the worst in the nation. Three years ago, when 10% of working-age New<br />
Zealanders were on benefits, the figure was already 16% in Northland, and 19% for Northlanders<br />
aged 18 to 24. In 2011, while 12% of working-age New Zealanders are on welfare, in Northland it<br />
is 21%, and for Northlanders aged 18 to 24 it is 29% (S. Collins, 2011). What is likely to happen to<br />
these young people?<br />
Without employment or training, young people can risk regrettable life choices. The next 12 to 18<br />
months are crucial. (Black, 2011)<br />
183
In New Zealand overall, youth are four times more likely to be unemployed than adults. Figure 17.3<br />
shows the long-term youth-to-adult ratio has continued to be high with a spike around the time of the<br />
recession. 138<br />
Included in these unemployed<br />
youth figures are those ‘Not in<br />
Employment, Education or Training’<br />
(NEET). NEETs are often from<br />
Māori and Pasifika communities, or<br />
disadvantaged backgrounds, and<br />
drop out of education early. In the<br />
December 2010 quarter, compared<br />
to national youth average of 16.8%,<br />
the unemployment rate for Māori<br />
youth was 27.4% and the Pacific<br />
youth unemployment rate was<br />
27.2%. For Joris de Bres, the Race<br />
Relations Commissioner:<br />
Figure 17.3. New Zealand’s historical unemployment levels by<br />
age group (G. Campbell, 2011)<br />
Particularly because the population profile of the Maori and Pacific community is such that they<br />
are predominantly young, this is an issue that we just have to address for our collective future.<br />
(de Bres, 2010)<br />
There is conflicting evidence about the labour market effect of removal of the (lower) Youth Minimum<br />
Wage. When youth wage rates increased, Hyslop and Stillman (2007) found no consistent and robust<br />
evidence of any adverse effects of the changes on teenage employment; yet Hospitality Association<br />
chief executive Bruce Robertson claims: “Elimination of youth wage has been to a point a disincentive<br />
for traditional youth employers.” (NZPA, 2011b)<br />
Equal Employment Commissioner Judy McGregor, says:<br />
The high unemployment of young Māori and Pacific people and the current bias against hiring<br />
some young people are issues we all need to be concerned about. (J. A. McGregor, 2010)<br />
An improvement in education access and opportunities is not a complete solution. Having a university<br />
degree no longer guarantees that you will get a good job, and that is becoming increasingly true with<br />
each passing decade. Education is not the solution for a society of broadly shared prosperity, we<br />
have to build that society directly. As Krugman (2011) argues:<br />
We need to restore the bargaining power that labour has lost over the last 30 years, so that<br />
ordinary workers as well as superstars have the power to bargain for good wages. We need to<br />
guarantee the essentials, above all health care, to every citizen.<br />
University graduates here are being hit by the economic downturn. The unemployment rate of this<br />
group is mostly determined by the economic situation in New Zealand. Current graduates are the<br />
children of the baby-boomers which means there are extra numbers of graduates. <strong>Further</strong> issues are<br />
that the New Zealand labour market offers mostly service industry jobs and is made up of smaller<br />
businesses. Often graduates are too qualified. Employers also see taking on a new graduate as a<br />
138 Youth wage rates (for those aged 16 to 19) were abolished in 2006 on the grounds of age discrimination.<br />
184
isk and prefer older, more experienced workers. However, graduates have an advantage as they<br />
can often find work overseas or return to further studies.<br />
The persistently high rate of youth unemployment internationally does not diminish the size or<br />
urgency of the problem in New Zealand. What is needed is an education system that recognises a<br />
diversity of skills and learning styles from the start, and smarter connections with the industries that<br />
might want to employ them, as Lincoln University economist Paul Dalziel said in a recent interview<br />
(McCrone, 2011):<br />
The New Curriculum for secondary schools has brought in the right framework. There is the<br />
Government’s youth guarantee scheme to fund 16 and 17-year-olds on polytechnic courses, and<br />
the new trade academies at schools like Christchurch’s Linwood College which allow students to<br />
spend part of the week learning metalwork in class, then have job training with a local business.<br />
New Zealand needs more of these kinds of programmes to make it easier for the young to leap<br />
the barriers to getting a first job.<br />
The work of Higgins and her colleagues (Higgins & Nairn, 2006; Higgins, Nairn, & Sligo, 2010)<br />
on transition from school to the post-school world of work and/or tertiary education highlights the<br />
contradictions and tensions between the ways in which young people expect this transition to happen,<br />
the realities of the contemporary labour market and the expectations of policy makers. The current<br />
environment is in fact very bumpy, uncertain and unpredictable, and jobs, if they are available do not<br />
follow the smooth, linear path anticipated and reflected in much of the policy focus about job markets<br />
and the necessity of qualifications.<br />
Throughout New Zealand, there is a range of mentoring services to<br />
assist in making good decisions throughout secondary and tertiary<br />
education, and to aid the transition from education to employment. 139<br />
There are also youth-to-work initiatives operating in many regions,<br />
and several outstanding examples of regional good practice.<br />
McGregor (2010, p. 9) refers to the Incubator programme in Hawke’s<br />
Bay targeting low-decile schools; the Wonderful Wāhine programme<br />
targeting young Māori women at Nelson Girls’ College; and in Otorohanga, the Trade Training Centre<br />
which has kept apprenticeship completion rates above 90% compared to a less than 20% national<br />
average. In Dunedin, February 2011 figures showed that more than one in three of the people receiving<br />
an Unemployment Benefit was under the age of 25, which has spurred the Methodist Mission to offer<br />
a pilot called Make A Plan (MAP), 140 targeting students who have successfully passed the National<br />
Certificate of Educational Achievement (NCEA) Levels 2 or 3 but missed out on acceptance at a<br />
university or polytechnic, and are “too qualified” to go on Tertiary Education Commission or MSDfunded<br />
‘second-chance’ learning courses (Black, 2011).<br />
In contrast to the non-government-organisation (NGO) responses, the Government is hoping that<br />
“boot camp will sort youth unemployment” (Wright, 2011). The eight-week military activity camps<br />
(Macs) run near Christchurch cost about $36,000 for each participant, and so far 36 offenders<br />
aged 14 to 17 have completed a course as a last resort to turn their lives around. While the Social<br />
139 See, for example, the Youth Mentoring Network: http://www.youthmentoring.org.nz/about/index.cfm.<br />
140 The MAP programme includes art, music, voluntary service, as well as off-site elements aimed at expanding the abilities,<br />
self-reliance and group skills of the participants. While the primary focus is on the next step after MAP: further education<br />
through entry to Polytechnic or University, and work, the programme includes ‘leaving home’ skills like cooking, budgeting,<br />
tenancy issues, and dealing with agencies.<br />
185
Development Ministry and <strong>Child</strong>, Youth and Family youth justice services are unable to disclose the<br />
number and nature of offences committed by the participants before and after the camps, evidence<br />
in New Zealand and internationally shows that short sharp programmes like boot camps have a very<br />
high recidivism rate (Torrie, 2011). Social Development and Employment Minister Paula Bennett’s<br />
plans include investing $55.2 million over the next four years into three programmes to help youth<br />
employment. This money is taken from other spending, such as the Community Max Scheme which<br />
is to be axed. 141 The programmes in favour are:<br />
• Limited Service Volunteer courses with the army, to get a further $25 million;<br />
• A new wage subsidy called ‘skills for growth’ to get $17.2 million;<br />
• The existing wage subsidy scheme Job Ops 142 is to get $13 million (Bennett, 2009).<br />
The increasing cost of tertiary education, and student loans<br />
In 2010 Victoria University increased its student fees by 5%, following a trend that has been apparent<br />
for the past 10 years across all New Zealand universities. In the same year student levies at Victoria<br />
were increased to $514, a 94% increase (Victoria University Student Union, 2010). The average<br />
cost of a university course per year in 2011 is between $5,000 and $6,000. Such high fees act as a<br />
deterrent when young people are weighing up whether to study or whether to enter the workforce.<br />
This cost impacts disproportionately on students from lower socio-economic backgrounds, and<br />
students who do not have the necessary financial or social support. In 2009, the retention rate of<br />
Maori students in tertiary education was 54% (Education Counts, 2011). A significant reason for the<br />
low retention rate could be the increasing cost of education. Also, there are many students leaving<br />
secondary school who cannot consider further study toward tertiary qualifications because of the<br />
increasing cost.<br />
In 2006, the Labour government introduced the interest-free student loan scheme. Students can<br />
borrow for their course fees, and for up to $167 per week for living costs. Depending on their individual<br />
situation, students may be entitled to government allowances; and can apply for scholarships. These<br />
schemes are helpful, but they do not alter the fact that nearly three-quarters of students enter the<br />
workforce with an average debt of $15,000. The high university costs force the average New Zealand<br />
student to incur a student loan in order to pay for their education. “Nearly 900,000 people have taken<br />
student loans since the scheme started (1992), and more than two-thirds have not fully repaid the<br />
money.” (Binning, 2010) In 2009, 199,000 students (71% of all students) borrowed $1,389 million<br />
in student loans. Entering the workforce with a $50,000 student loan leaves students with limited<br />
prospects. The common goal of graduates has changed from buying a home to paying off their<br />
student loan.<br />
The current Government has repeatedly said that the current<br />
interest-free student loans policy is fiscally unsustainable,<br />
should not have been introduced, and is preventing them<br />
from being able to balance the books as they would like.<br />
The Government is trying to ensure outstanding loans are<br />
repaid, but Inland Revenue has had to write off millions of dollars of the debt because of death and<br />
141 The Community Max jobs included: Ureweras: paying young people to catch and tame wild horses; Kawerau: alter<br />
second-hand clothes for six months; Northland: over $100,000 was spent on a now overgrown garden.<br />
142 The Government’s “Job Ops” scheme offers 4,000 opportunities of a $5,000 wage subsidy over six months to help lowskilled<br />
young people find work.<br />
186
ankruptcy and accepts that some of the money will never be repaid. As at 30 September 2010, the<br />
combined total amount overdue from New Zealand and overseas-based borrowers – was more than<br />
$316 million (Inland Revenue Department, 2011).<br />
While Government has repeatedly affirmed the pre-election promise not to remove interest-free<br />
student loans, it has introduced a 10% bonus for voluntary student loan repayments that total $500 or<br />
more in a tax year (1 April to 31 March), provided all other student loan obligations have been met. 143<br />
Student loans are not directly a tertiary education funding issue; they actually operate as a tax on<br />
education, and, because of the way they are designed, are a regressive tax that means the poorest<br />
students and graduates pay the most tax on their education. 144 If student loans continue to rise, they<br />
will serve as a greater deterrent for individuals to seek tertiary education. They will also deny a greater<br />
number of students the opportunity to further educate themselves at a university or polytechnic. It<br />
thus falls on the Government to decide how much they value education, and tertiary students.<br />
The changes to the tertiary loan scheme announced in the 2011 Budget on 19 May, promoted as<br />
“Key student support initiatives” include:<br />
• Restricting student loan eligibility for those with an overdue student loan repayment obligation of<br />
$500 or more who are in default for more than one year.<br />
• Restricting borrowing for people aged 55 and over to tuition fees only.<br />
• Removing the entitlement for part-time full-year students to borrow for course-related costs.<br />
• Holding the student loan repayment threshold at $19,084 until 1 April 2015.<br />
• Requiring every new loan application to include a contact person as one of the conditions of<br />
accessing a student loan.<br />
• Shortening the repayment holiday for overseas-based borrowers from three years to one year,<br />
and requiring borrowers to apply for the repayment holiday and provide a New Zealand-based<br />
contact person before they go overseas.<br />
• Improving fairness for New Zealand-based borrowers by beginning to broaden the definition of<br />
income for student loan repayment purposes, and investigating other options to further broaden<br />
the definition of income in the future.<br />
• Extending the exemption to the two-year student loan and allowance stand-down for permanent<br />
residents and Australians to include the sponsored family members of protected persons.<br />
Revenue Minister Peter Dunne and Tertiary Education Minister Steven Joyce say that the student<br />
support changes will limit lending to borrowers who are less likely to repay their loans, while ensuring<br />
that borrowers are meeting their repayment obligations. “The student loan scheme still remains one<br />
of the most generous in the world, offering interest-free loans for all borrowers who remain in New<br />
Zealand.” (S. Joyce & Dunne, 2011)<br />
Gender bias in employment<br />
The latter half of the twentieth century saw dramatic changes to the lives of New Zealand women.<br />
They not only entered the workforce in record numbers, but began entering occupations that had<br />
143 See http://www.ird.govt.nz/studentloans/payments/voluntary/bonus/sl-voluntary-repayment-bonus.html?utm_<br />
source=emailbo&utm_medium=newsletter&utm_campaign=2010MarSLNotifyMe.<br />
144 See Tertiary Education Update 24 March 2011: http://teu.ac.nz/category/news/tertiary-update/.<br />
187
een previously dominated by men (Ridgeway, 1997, p. 218). However,<br />
women are still not equally represented in most top-level professional<br />
roles (Human Rights Commission, 2010c, p. 2) and most importantly,<br />
women have not achieved pay equity with their male counterparts.<br />
Recent statistics indicate women earn 11–13% less than men overall<br />
(Human Rights Commission, 2010b, p. 66).<br />
Equal education has not guaranteed women equal standing as employees; and part of the answer to<br />
this could be the existence of male-dominated networks in many professions that women have not<br />
been able to penetrate (Justice Susan Glazebrook, 2010). It also seems clear that ingrained gender<br />
bias is still present in New Zealand society.<br />
Inequality persists despite the dramatic increase in women’s participation in tertiary education; and<br />
despite the Equal Pay Act 1972, the Human Rights Act 1993, the State Sector Act 1986, and the<br />
Gender Inclusive Job Evaluation Standard 2006, that were introduced to ensure equal treatment<br />
in the workplace for New Zealanders. This inequality occurs in both the government and corporate<br />
sector (Human Rights Commission, 2010b, p. 2) and has important implications for young women<br />
moving from tertiary education into employment. The inequitable remuneration which women<br />
experience results in young women having a triple jeopardy in the workplace: they are discriminated<br />
against in recruitment and employment because they are young, and because they are female, and if<br />
they are employed, they are paid 11% to 13% less than their male counterparts. If the current gender<br />
bias is to be challenged there is a need for strong statutory support and most importantly, a change<br />
of attitude in society. But, like youth unemployment generally, this is another issue that is off the radar<br />
in New Zealand, and not given the attention it deserves.<br />
Illiterate and innumerate in New Zealand<br />
Results for 2010 show nearly 20% of students did not achieve the literacy requirements of NCEA and<br />
almost 15% did not achieve the numeracy requirements (NZQA, 2011). According to the 2011 New<br />
Zealand Qualifications Authority (NZQA) report, literacy “is the written and oral language people use<br />
in their everyday life and work. It includes reading, writing, speaking and listening”. NZQA’s definition<br />
of numeracy is:<br />
… the bridge between mathematics and daily life. It includes the knowledge and skills needed to<br />
apply mathematics to everyday family and financial matters, work and community tasks” (NZQA<br />
2011).<br />
From 2012, instead of eight credits in English and Mathematics respectively at Level 1 to meet<br />
the literacy and numeracy requirements of NCEA, students will need to achieve 10 credits (NZQA,<br />
2011), and will be able to achieve these credits in a wide range of subjects. Higher levels of literacy<br />
and numeracy in the workplace lead to better staff attendance and retention, higher quality work<br />
with fewer errors, and increased levels of productivity and customer service (Retail Institute NZ,<br />
2010). Universities and employers in New Zealand have complained about the levels of literacy and<br />
numeracy amongst school leavers. Research has shown that students who leave school with low<br />
levels of literacy and numeracy are less likely to be promoted, will receive lower wages, and are more<br />
likely to be unemployed or in jobs with poor job security (Bynner, 2004, p. 39).<br />
The consequence of not succeeding in this area [employment] is the phenomenon that poses<br />
perhaps the biggest threat to cohesive society, social exclusion. (Bynner, 2004, p. 45)<br />
188
It will be several years before we will be able to see what difference the changes to the NCEA<br />
requirements will make. What we already know is that literate and numerate young people are more<br />
likely to have choice, possibility and opportunity to succeed.<br />
Summary<br />
It is particularly unfortunate that no consideration was given in the latest Budget to supporting<br />
and funding the apprenticeship system. <strong>Action</strong> is needed regarding: reviewing the secondary<br />
school curriculum to ensure it is meeting the students’ needs and supporting their diverse learning<br />
styles, and relationships are built with industry; affordable access to tertiary education; support<br />
for apprenticeships; and addressing issues of inequality, including gender inequality. If nothing is<br />
done, youth unemployment will continue to increase. This, in turn, will compound youth disaffection,<br />
marginalisation and exclusion.<br />
Recommendations<br />
• All political parties commit to a substantial reduction of youth unemployment rates as part of the<br />
2011 election, develop a range of policies to achieve this and evaluate and monitor those policies;<br />
• Create and fund additional training opportunities, including apprenticeships and mentor services;<br />
• Develop a fuller range of training programmes and job opportunities for Māori and Pasifika young<br />
people to reduce their unemployment rates;<br />
• New incentives for employers to employ young workers;<br />
• Open up tertiary education opportunities for further study and skill development until the economy<br />
improves;<br />
• The education system needs to recognise the diversity of skills beyond the academic and develop<br />
these;<br />
• Support and develop opportunities for school students to make connections with industries that<br />
might want to employ them;<br />
• Require a commitment from New Zealand employers to monitor their employees and prioritise<br />
remedying gender inequity.<br />
189
PART FIVE<br />
Chapter 18. The costs of child poverty<br />
John Pearce 145 and Steve Poletti 146<br />
Executive Summary<br />
Estimates of the national costs of child poverty exist for the UK and<br />
the USA, but although much detailed work on specific aspects of cost<br />
has been done no comprehensive assessment of the costs of child<br />
poverty to the New Zealand economy has been produced.<br />
The impact of child poverty on the national economy arises primarily<br />
through the ‘poverty of experience’ of children who grow up in<br />
poverty. It is manifested through reduced lifetime contribution to<br />
the economy; through higher risks of ill health; and through greater<br />
involvement in crime.<br />
We review the international literature for countries comparable to<br />
New Zealand and find estimates for the costs of child poverty to the economy of 3% to 4% of GDP.<br />
Our own calculations for New Zealand find that the costs of child poverty are in the range from 3.8%<br />
to 4.6% of Gross Domestic Product (GDP), a cost for each of the 200,000 children growing up in<br />
poverty over their lifetime of approximately $600,000, at an annual cost of $35,000 a year. This<br />
translates to an annual cost to each New Zealand wage earner of approximately $4,000.<br />
Introduction<br />
As detailed elsewhere in this report, children growing up in households which experience persistent<br />
poverty face enormous hardship and distress. There is a compelling case on grounds of fairness and<br />
social justice to introduce policies to alleviate child poverty.<br />
This chapter examines a different argument. <strong>Child</strong>ren who grow up in poverty are likely to be less<br />
productive in later life, more likely to be involved in criminal activities, tend to impose an increased<br />
burden on the health system, and to die at a younger age. Each of these tendencies imposes a cost<br />
to society. The cost may be direct or it may be an opportunity cost. If children have better access<br />
to resources at an early age, they are more likely to end up as productive and healthy members of<br />
society.<br />
A recent paper by Heckman and Masterov (2007, p. 447) from the University of Chicago (no less!)<br />
summarise the argument thus:<br />
We argue that, on productivity grounds, it appears to make sound business sense to invest in<br />
young children from disadvantaged backgrounds. …Early interventions that partially remedy the<br />
effects of adverse early environments can remedy some of the damage done by disadvantaged<br />
families and have high economic return relative to other policies. They will benefit not only the<br />
145 John Pearce is a member of Analytica, an Auckland Think Tank, and a consulting Decision Analyst.<br />
146 Dr Steve Poletti is a member of <strong>Child</strong> <strong>Poverty</strong> <strong>Action</strong> <strong>Group</strong>’s Management Committee and a Lecturer in Economics at<br />
the University of Auckland.<br />
190
children themselves, but also their own children as well as society at large...An accumulating body<br />
of evidence shows that early childhood interventions are more effective than interventions that<br />
come later in life. Remedying early disadvantages at later ages is costly, and often prohibitively<br />
so. This is because of the dynamic nature of the human skill formation process. Skill begets<br />
skill, learning begets learning. Early disadvantage if left untouched leads to academic and social<br />
difficulties in later life. Advantages accumulate, so do disadvantages.<br />
We examine some of the evidence behind such statements and attempt to derive an approximate<br />
quantitative figure of the cost of child poverty in New Zealand. Many of the studies we cite are from<br />
the UK or the USA, as unfortunately there has been little domestic research on this area. However<br />
the costs of child poverty, as a fraction of GDP, are broadly the same in both of those countries, and<br />
we have no reason to suspect the figures would differ greatly in New Zealand. In the last section, we<br />
report on some preliminary estimates arrived at using New Zealand data.<br />
Our overarching framework is that child poverty (actually family poverty) means an adverse<br />
environment for children to grow up in, which in turn leads to a ‘poverty of experience’. Firstly, poor<br />
educational outcomes are an important contribution to lower lifetime earnings. Secondly, children<br />
growing up in disadvantage are more likely to resort to crime in later life. Thirdly, poor health, both in<br />
childhood and later life, is strongly correlated with child poverty.<br />
These factors contribute to a vicious inter-generational cycle where children who grow up in poverty<br />
become parents likely to have lower income and education, which impacts adversely on the<br />
environment for their children and contributes to poor life outcomes.<br />
We will show that the income and educational attainment of parents count equally in determining<br />
the lifetime income of the child. This means that the impact of eliminating childhood poverty will be<br />
significantly greater in the long run: increased resources for children leads to better educational<br />
outcomes and increased income as adults, breaking the vicious cycle described above. It also<br />
means that other interventions, apart from eliminating child poverty, are likely to be necessary to<br />
allow disadvantaged children to realise their full potential.<br />
Traditional approaches to estimating the cost of child poverty have<br />
compared the outcomes for children growing up in the lowest socioeconomic<br />
group with outcomes for the rest of society. This approach,<br />
focussed on income, or family deprivation 147 as a measure of poverty<br />
of experience, underestimates the true impact of the ‘poverty of<br />
experience’ in society. For example family culture is clearly an important<br />
factor. Evidence for this is found in the OECD survey of educational<br />
performance (PISA, 2009, p. 62) which identifies ‘resilience’ as the<br />
ability to rise above the consequences of poverty. That study’s finding<br />
that children from deprived backgrounds in China, Korea and Finland do<br />
considerably better in educational tests than expected suggests that low<br />
income is only a proxy for ‘poverty of experience’. Many children in families that are income poor may<br />
still live in a family environment which enables them to overcome disadvantage and achieve their full<br />
potential. Conversely many children in families with income above the poverty line suffer poverty of<br />
experience which reduces their opportunities in later life.<br />
147 In New Zealand the Deprivation Index is used as a measure of socio-economic status. This measures income, employment<br />
status, beneficiary status, access to a car and telephone, single parent status, qualifications, home ownership, and<br />
bedroom occupancy rate.<br />
191
That low income is only a proxy for ‘poverty of experience’ is also apparent in the increasing relative<br />
incidence of crime with socio-economic status (which takes into account factors relevant to ‘poverty<br />
of experience’ such as parental education), and with the gradation of academic success with school<br />
socio-economic ranking. A further example of the impact of family culture, the source of poverty of<br />
experience, is shown in the relative academic success of Asian children in New Zealand. 148 In our<br />
view, eliminating the effects of poverty means eliminating the effects of ‘poverty of experience’ on all<br />
children, and including those who still suffer those effects, notwithstanding that their parental income<br />
is not in the lowest quintile.<br />
This new perspective on the scale of the impact of child poverty indicates the need to focus policy<br />
interventions not only on income for those families suffering the effects of poverty from cash shortages;<br />
but also on supporting positive family cultures right across the income spectrum. Parenting skills, and<br />
family culture, appear to be as powerful influence on lifetime outcomes for children as family income.<br />
The potential benefits of successfully eliminating ‘the effects of poverty of experience’ are much<br />
larger than have been recognised in the past from merely eliminating low income poverty.<br />
Here we initially focus on income as an indicator of ‘poverty of experience’ as data is readily available.<br />
It should be kept in mind that the issue is much more complex than our focus on income suggests.<br />
In the following sections we consider the costs of child poverty; firstly the lost opportunity through<br />
forgone productivity, and then the direct costs of crime and health. Then we look at the adverse<br />
impact on GDP. Finally we draw some conclusions and make some recommendations.<br />
Productivity costs<br />
Productivity costs, UK<br />
The UK’s Rowntree Study (Blanden, Hansen, & Machin, 2010) uses recent data from the British<br />
Cohort Study (BCS) to estimate the impact that growing up in poverty has on lifetime earnings.<br />
The longitudinal BCS follows all those born in a week on April 1970 in the UK. These children were<br />
tracked at ages 5, 10, 16, 26, 30 and 34. The data collected includes the subjects’ family incomes at<br />
age 16, and the subjects’ earnings at age 34. The data allowed controls to be added for observable<br />
parental characteristics such as education and lone parent status which do not change if income<br />
changes. This allows the authors to control for these variables and estimate the short term impact<br />
of eliminating child poverty. In the longer term though, as argued above, eliminating child poverty<br />
should mean the next generation is better educated and their children will experience an improved<br />
environment which will foster their development and break the vicious cycle.<br />
Blanden, et al. (2010) find that if no other factors are controlled for, child poverty reduces earnings<br />
at age 34 by 28%. Controlling for family characteristics such as lone parent status and parental<br />
education results in a reduction of earnings at age 34 by 21%. They also compared the difference in<br />
life experience of children with family incomes between £100-£200 a week to those earning less than<br />
£100 a week, which should give some indication of the actual impact of reducing child poverty. They<br />
find, depending on what variables are controlled for, a reduction in earnings at age 34 of between<br />
10% and 14%.<br />
To gain insight into one of the causes of the lower earnings, Blanden, et al. (2010) also control for the<br />
education qualifications achieved by the child. As expected, controlling for education does reduce<br />
148 For example for low income areas 95% of Asian children achieving an NCEA 3 score of 40 go on to study for a Bachelors<br />
degree. For European, Maori and Pasifika children, only 80% will continue on to tertiary study.<br />
192
the impact of child poverty but not by as much as one might think. For the full sample, controlling<br />
for education and family characteristics reduces the impact of income at age 16: earnings are 15%<br />
less compared to 28% with no controls. This gives weight to the hypothesis that child poverty leads<br />
to lower educational qualifications and lower earnings. However, the evidence also suggests that<br />
a child living in poverty who achieves the same educational qualifications as a child who grows<br />
up in more privileged family can still expect relatively lower earnings at age 34. They also find that<br />
poverty reduces the probability of being employed: individuals in poor households at age 16 are 4-7<br />
percentage points less likely to be employed at age 34.<br />
Using these results, Blanden, et al. (2010) estimate the impact on GDP if all childhood poverty<br />
was eliminated. They work on the assumption that the child poverty rate is 22.3% in the UK, which<br />
is similar to the New Zealand rate. Depending on what factors are controlled for, they find that<br />
elimination of child poverty in the UK would increase GDP by 1% to 2%. They also note that about<br />
one quarter to one third of this would be transferred to the government through a higher tax take.<br />
Transferring these results to the New Zealand context, annual GDP is approximately $178 billion, so<br />
eliminating child poverty would likely increase GDP by $2-4 billion with the government tax revenue<br />
likely to increase by around $0.5-$1 billion. 149<br />
Productivity costs, USA<br />
Holzer, Schanzenbach, Duncan, & Ludwig (2007) review the literature on the economic costs of<br />
poverty in the US and use the relationships found there to estimate the costs of poverty in terms of<br />
forgone income and productivity, crime, and poor health. They begin by raising issues that are at the<br />
heart of the welfare debate, asking: are the costs of child poverty a direct result of low income or of a<br />
broader range of family and community forces that afflict low income families? They write:<br />
Susan Mayer’s book (1997) argues that the costs of poverty have less to do with income and<br />
more with the quality of family life, schools and neighbourhoods that poor children experience.<br />
In turn these non-pecuniary factors might be reflected in a range of attitudes, behaviours, and<br />
values that poor children develop and carry into adulthood, which might have been caused by<br />
their parents’ and/or peers’ attitudes, behaviours, and values in addition to (or even instead of)<br />
their low childhood income. Of course the latter interpretation does not imply that poverty is any<br />
less costly to children who experience it. (Holzer, et al., 2007, p. 44)<br />
Clearly some of this is circular: families live in poor neighbourhoods because they are poor; but<br />
none the less it is an important point. Rather than try to grapple with unravelling all this, Holzer, et<br />
al. (2007) define the costs of child poverty very broadly to include income effects; all the personal<br />
characteristics imparted by parents, schools and neighbourhoods to children who grow up with or in<br />
them; and the entire range of environmental factors associated with poverty in the US.<br />
Our view, elaborated below, is that raising family income is important but other policies are also<br />
important to help children who grow up in poverty to realise their potential, and to avoid the effects<br />
of the ‘poverty of experience’ at the heart of many of the consequences of material poverty. Other<br />
factors such as parental education or neighbourhood factors are also likely to be relevant. Thus as<br />
far as policy goes it is important to know how significant these other factors are. 150 For example, if<br />
149 This is in the long run: the GDP gains from reducing child poverty accrue slowly over 20-30 years as children grow up<br />
and enter the workforce.<br />
150 From this perspective it is disappointing that the approach of Holzer et. al. (2007) is not more nuanced. None the less<br />
their paper is an important contribution.<br />
193
neighbourhood variables are important, one possible policy response would be to pepper pot state<br />
housing, as New Zealand’s first Labour government did. One important point made by Holzer, et al.<br />
(2007) is that research by Duncan, Wei-Jun Yeung, Brooks-Gunn, and Smith suggests that “poverty<br />
in early life may be most damaging” (1998), and it may well be true that even short spells of poverty<br />
during these years can impose large and permanent costs on children. Unfortunately only a few<br />
studies address this important question.<br />
Holzer, et al. (2007) cite two studies: Mayer (1997) and Corcoran & Adams (1997) which show,<br />
without controlling for parental education or other characteristics, that doubling the income of families<br />
below or at the poverty line raises subsequent male incomes by 30-40%. Based on estimates such<br />
as these Holzer et. al. (2007) estimate the adverse impact of reduced productivity resulting from child<br />
poverty at roughly 2.1% of GDP. They use a figure of 10% for children who grow up in poverty for half<br />
their childhood and a further 8% who experience poverty at least one fourth of the time. 151 They then<br />
consider possible unobserved heredity factors which may explain lack of earning potential. Based<br />
on Jencks and Tach’s (2006) 152 review of studies of twins, they suggest the best estimate is that the<br />
hereditary portion of intergenerational transmission of inequality is about 40%. This implies that the<br />
entire range of environmental factors represents 60%. They then factor out the hereditary component<br />
and find that the experience of growing up in some or severe poverty reduces the nation’s aggregate<br />
output by 1.3% (but see Footnote 18).<br />
Studies which attempt to directly estimate the effect of higher income on children’s achievement in<br />
poor families are also reviewed by Holzer, et al. (2007). For example, Morris, Duncan, & Rodrigues<br />
(2006) use data from random assignments of welfare mothers into groups that receive extra income<br />
and those that did not. They find earning supplementation has significant positive effects on child<br />
achievement, and their experimental evidence also suggests that earnings supplements boost<br />
achievement of younger children the most. 153<br />
One of the few studies that focuses on early childhood poverty is Duncan, Ziol-Guest, and Kalil (2010).<br />
That careful study, controlling for a large number of variables, 154 finds that a US$3,000 increase in<br />
annual income for the family of a child growing up in poverty between birth and age 5 is associated<br />
with a 19% higher annual earnings between the ages of 27-37. They claim to be the first study “to link<br />
high-quality income data across the entire childhood period with adult outcomes measured as late as<br />
age 37”. The large number of variables they control for adds weight to their conclusions:<br />
Our list of variables controlling for conditions at the time of birth is extensive and ought to reduce<br />
a great deal of potential bias. More important, and unusual for studies such as ours, is that<br />
our estimates of the impacts of early childhood income control for income in middle childhood<br />
and adolescence. As such, factors such as genetic influence are likely to affect later and early<br />
childhood income, and thus are controlled, in some degree by our inclusion of income in other<br />
childhood stages. (Duncan, et al., 2010, p. 322)<br />
Translating the Duncan, et al. (2010) results into impact on GDP: child poverty in the US for children<br />
under 5 reduces productivity, and hence GDP, by approximately 1% of GDP.<br />
151 For this group they estimate the impact on earnings as a half compared to those who are in poverty at least half the time.<br />
152 These studies use mostly Swedish data and hence may overstate the importance of heredity factors for countries such<br />
as New Zealand which are considerably less equal.<br />
153 Dahl and Lochner (2006) find similar results.<br />
154 Including ethnicity, parental education, parental expectations and whether the observed home is “dirty”.<br />
194
Productivity costs, New Zealand<br />
There have been no comparable studies for New Zealand. We estimate the productivity costs for<br />
New Zealand as follows. The main driver for increases in productivity due to elimination of child<br />
poverty is through better educational outcomes which are reflected in higher earnings (productivity).<br />
We estimate a new distribution of qualifications and hence income once child poverty is eliminated.<br />
It may be objected that this approach assumes that increased qualifications will be reflected in job<br />
opportunities and earning capability; and that this increase in jobs and job opportunities also requires<br />
capital investment and economic growth. We consider that this investment represents part of the<br />
cost side of potential policy changes to reduce poverty. Such productive investment in jobs will be<br />
expected to create its own return on capital, and is essentially self-funding. The successful lifting of<br />
educational attainment, as represented by qualifications, is a good first approximation of long term<br />
benefit, and hence opportunity value, since investment in jobs may be assumed to be made on<br />
internal project economic considerations. 155<br />
Education affects both Figure 18.1. Percentages of School Leavers with University<br />
the probability of being Entrance, 2009<br />
in work (as opposed to<br />
unemployed) and the<br />
likely level of earnings.<br />
Qualifications are a proxy<br />
for future employment<br />
and income. An example<br />
of this effect of school<br />
decile on educational<br />
outcomes, in this case<br />
University Entrance (UE)<br />
achievement rate, is shown in the Ministry of Education Annual Report (2011b). The difference in<br />
success in achieving UE might lift from 18% (Deciles 1+2) to around 29% (Deciles 3+4) compared<br />
to having no qualification, an 11% points increase. The national average success rate was 44%<br />
(2009). 156 The chart is reproduced here as Figure 18.1.<br />
Figure 18.1 shows the trend of schools UE pass rates (at least NCEA3) with school population decile<br />
is strong. Schools from Deciles 1 and 2 average 18% pass rates. 157 Deciles 3, 4, and 5 average 30%.<br />
Average for all schools is 44%. 158<br />
The New Zealand Ministry of Education comment on these figures:<br />
There is a clear positive correlation between the socioeconomic mix of the school the student<br />
attended and the percentage of school leavers achieving a university entrance standard. Schools<br />
in the lowest deciles (1 and 2) draw their students from communities with the highest degree of<br />
socio-economic disadvantage. Students from schools in the highest deciles (9 and 10) are three<br />
155 This also assumes that investment and job creation conditions can attract capital investment in New Zealand to create<br />
value-creating jobs.<br />
156 School Leavers with a university entrance standard on http://www.educationcounts.govt.nz/indicators.<br />
157 For schools, Decile 1 has the lowest income, and Decile 10 has the highest income. For health, Decile 1 has the highest<br />
income.<br />
158 http://www.educationcounts.govt.nz/statistics/schooling/school_leavers2/university-entrance-standardnumbers-2009<br />
UE-standard-by-year-level-and -decile-2009.<br />
195
times more likely to leave school having achieved a university entrance standard, than students<br />
from schools in the lowest decile schools. There is a large variation in the proportion of school<br />
leavers achieving a university entrance standard amongst schools within each decile. (Ministry of<br />
Education, 2011b)<br />
Because ‘School Deciles’ are not population deciles, the lowest 20% of pupil population covers<br />
Deciles 1, 2, 3, and 10% of Decile 4. Their recent UE pass rate is 24%. There is no reason to believe<br />
that the innate ability of children in decile 1-3 schools is any different to the ability of children in higher<br />
decile schools. Therefore we take the view that eliminating poverty will lift the performance of these<br />
children to the average of the rest of the population rather than to the achievements of the next decile<br />
up. That is, eliminating poverty could be expected to lift their performance to equal the average of<br />
decile 4-10 schools: 48%. The 24% point gain in pass rate for this disadvantaged group will increase<br />
the number of people having at least UE as their highest qualification by 5 percentage points (and<br />
lower those with no qualification by the same amount).<br />
Most students who pass University Entrance go on to achieve higher qualifications, or vocational<br />
or trade qualifications, which carry higher lifetime earning potentials. Applying the mix of future<br />
qualifications based on the current workforce qualification mix and reported earnings by qualification,<br />
we can estimate the productivity effect of eliminating child poverty. Statistics New Zealand report<br />
December 2010 earnings by highest qualification and the number in each category. We estimate a new<br />
distribution by assuming that the increased number of students with UE as their higher qualification<br />
is distributed according to the current labour force distribution. Multiplying by the numbers in the<br />
workforce brings the productivity gain to approximately $3.1 billion a year. Thus we estimate that<br />
eliminating child poverty would, in the long term, lift earnings $3.1b annually (1.8% of GDP).<br />
Table 18.1. Effect on Earnings of Eliminating <strong>Child</strong> <strong>Poverty</strong><br />
Highest<br />
qualification<br />
Current Mix<br />
in Workforce<br />
Mix if <strong>Child</strong><br />
<strong>Poverty</strong><br />
eliminated<br />
Average<br />
Weekly<br />
Wage<br />
Relative<br />
weekly<br />
wages<br />
No qual NCEA 1<br />
or 2<br />
UE<br />
Diploma Vocational or<br />
Trade Qual.<br />
University<br />
Degree<br />
Other Average<br />
postschool wage<br />
23.2% 15.9% 5.9% 8.1% 27.4% 15.5% 3.9% $675.1<br />
16% 18.3% 6.5% 8.8% 29.5% 16.7% 4.2% $692.8<br />
$451 $502 $527 $496 $763 $1124 $716<br />
$100 $169 $249 $159<br />
Summary of productivity costs of child poverty<br />
We have summarised here the evidence from a number of papers evaluating the opportunity cost of<br />
lost GDP resulting from child poverty. A number of studies put this at between 1-2% of GDP in the<br />
US, UK and New Zealand. The lower estimates result from controlling for parental and/or hereditary<br />
characteristics. Eliminating child poverty will over time result in a healthier and more productive<br />
workforce, contributing to a higher national income and higher tax take for the government. For New<br />
Zealand these gains will eventually be from $2-$4 billion a year, with a concurrent annual increase<br />
196
in government revenue of $500 million to $1 billion. The lower estimates are likely in the medium<br />
term as attributes such as parental education cannot change in this time frame. In the longer run the<br />
control variables such as parental characteristics or neighbourhood variables are likely to change as<br />
the first cohort gains from better education and income providing more resources and support in turn<br />
for their children’s development.<br />
Crime costs<br />
There have been a number of studies examining the costs of crime in the US. Anderson (1999)<br />
estimates the per capita cost of crime at $4,818 (US$2004) which for the US as a whole is around<br />
$1.4 trillion or 11.9% of GDP (US$11.8 trillion in 2004). 159 The per capita costs in the US are likely to<br />
be higher than New Zealand reflecting the fact that the imprisonment rate and murder rate in the US<br />
are the highest in the world, and that the US costs include the loss of earnings by murder victims,<br />
which are 76% of all victims costs (which are apparently not included in the New Zealand costs).<br />
Roper & Thompson (2006) in a Treasury Working Paper estimated the costs of crime for 2003/4 in<br />
New Zealand at NZ$9.1 billion: $2.1 billion public sector costs, $7 billion private sector costs (=6.2%<br />
of NZ$148 billion GDP or NZ$2,220 per capita). The New Zealand costs include direct costs such<br />
as operating prisons, opportunity costs such as production forgone for those in prison, and the direct<br />
and indirect costs borne by the victims. Our preliminary estimates put the cost of crime in New<br />
Zealand at $9 to $16 billion a year.<br />
Heckman and Masterov (2007) focus on child participation in crime in later life, and the strong<br />
empirical relationship between early adverse family environments, citing evidence from Lochner and<br />
Moretti (2004) who find that poorly educated people are more likely to commit crime. There is strong<br />
evidence of a causal correlation between child poverty, low educational achievements and crime.<br />
The Perry Preschool programme, discussed below, randomly assigned children from disadvantaged<br />
families to an enriched preschool child development programme and found that participants<br />
averaged significantly fewer lifetime arrests than the comparison group. Heckman & Masterov (2007)<br />
consider similar studies and conclude that treatment group members are shown by most studies<br />
to have dramatic reductions in criminality and participation in the criminal justice system. In short:<br />
impoverished environments promote crime; and enriched environments reduce crime.<br />
Levitt (1997) estimates that additional police officers in large US cities reduce crime costs to the<br />
value of $200,000 a year at a direct public cost of $80,000 a year. (Lochner and Moretti (2004)<br />
estimate that the same result can be achieved by producing more high school graduates at a cost of<br />
$15,000 a year in direct costs. Thus from a policy perspective, as Heckman & Masterov (2007) write,<br />
per dollar spent, education is far more effective than expenditure on police.<br />
Estimates of the crime costs of child poverty, US, UK and New Zealand<br />
There is much less consensus in the academic literature on the costs of crime resulting from child<br />
poverty, and empirical estimates vary widely. Holzer, et al. (2007) review two US studies. The first by<br />
Bjerk (2007) finds significant correlation. He estimates that youth growing up in families in the bottom<br />
quartile of the income distribution are 1.3 times as likely to be involved in crime compared to youth<br />
growing up in the second quartile. <strong>Further</strong>more the effect is non-linear, for example there is little<br />
difference in crime for children growing up in the third and fourth quintiles respectively. The second,<br />
earlier study by Elliot and Ageton (1980) uses data from the national youth survey, and finds that<br />
159 See: http://research.stlouisfed.org/fred2/graph/?s[1][id]=GDP.<br />
197
‘lower class’ youth report committing nearly 4 times as many violent crimes as ‘middle class’ youth.<br />
Confronted with these estimates, Holzer, et al. (2007) conclude that the annual incidence of crime<br />
attributable to poverty is 20%. They provide evidence that this is likely to understate the true costs<br />
because it is well known that national surveys underestimate the true rates of self-reported crimes,<br />
especially among minorities. 160<br />
Once this figure is arrived at, it is straightforward to use estimates of the total costs of crime in the US<br />
to find total crime costs of child poverty. Holzer, et al. (2007) find that a conservative estimate of the<br />
cost of crime due to child poverty is 2% of GDP. After correcting for hereditary effects (40%) 161 they<br />
estimate the total cost is 1.3% of US GDP.<br />
Bramley and Watkins (2008) report on the direct public service costs of child poverty in the UK.<br />
They estimate the fraction of child crime (up to age 18) and youth crime (18-24) attributable to child<br />
poverty. Crime rates are established for each geographical area and regressed against child poverty<br />
in that area, or on child poverty and a range of demographic and geographical indicators. The first<br />
model attributes 44% of child and youth crime to child poverty while the second model with more<br />
controls (for factors related to child poverty such as parental education) attributes a smaller share of<br />
26% to child poverty. In our view it is not unreasonable to extrapolate these percentages to all crime<br />
since criminal patterns of behaviour are usually established by the age of 24 and then reinforced in<br />
later life.<br />
Brand and Price (2000) estimate the total cost of crime in England and Wales in 2000 at £60 billion<br />
or around 7.2% of GDP. Using the Bramley and Watkins (2008) figures, this would mean that the<br />
child poverty costs of crime are between 1.9% and 3.2% of GDP, depending on how many factors<br />
are controlled for.<br />
In our view these estimates are on a much less firm footing than the productivity cost estimates<br />
described above. There is not a great deal of research in this area and the figures vary somewhat.<br />
Our best guess based on these studies is that the crime costs of child poverty are between 1.3% and<br />
3.2% of GDP for both the US and the UK.<br />
In New Zealand Fergusson, Swain-Campbell, and Horwood (2004, p. 957) conclude:<br />
On the basis of this evidence there seems to be little doubt that, as a general rule, individuals<br />
from socioeconomically disadvantaged and deprived environments show a greater propensity to<br />
engage in crime.<br />
As part of the Christchurch Health and Development Study, they studied 1,265 children from birth to<br />
age 21 years. For the sample in Table 18.2 (D Fergusson, et al., 2004, Table 4) 162 the relative rates<br />
of self-reported offending and convictions by six socioeconomic strata of their families at ages 0-6<br />
were:<br />
160 For example, estimates are that for minorities there is under reporting by a factor of 2 to 4 (Hindelang, Hirschi, & Weis,<br />
1981).<br />
161 In our view this overestimates the impact of hereditary effects. Rhee & Waldman (2002) in a meta study of 51 twin and<br />
adoption studies quote heritability influences from 0 to 0.71. Walters (1992) meta study found a 9% influence. Mason<br />
and Frick (1994) suggest 50% genetic influence. Miles and Carey (1997) found up to 50%. James (2002) quotes twin<br />
studies showing heritability of antisocial traits, but that their expression in anti-social behaviour is highly modulated by<br />
upbringing- environmental conditions. In other words expression of hereditary effects is not significant for behavioural<br />
outcomes compared to early childhood environment.<br />
162 Unadjusted ratios reported, since these capture all effects of disadvantage.<br />
163 We note that lower socioeconomic groups have a much higher probability of conviction relative to their self-reported<br />
offending.<br />
198
Table 18.2. Relative effect of socioeconomic status on childhood offending ages 15-21<br />
1 2 3 4 5 6<br />
Self-reported offending 1 1.26 1.59 2.01 2.53 3.21<br />
Officially recorded convictions 163 1 1.92 3.67 7.03 13.48 25.82<br />
This suggests that reducing the relative offending rates of <strong>Group</strong> 6, the lowest socioeconomic strata,<br />
to the average of the remainder of the population would reduce crime by between 13% 164 (selfreported)<br />
and 39% (based on convictions). Since most criminal behaviour is early established (D<br />
Fergusson, et al., 2004) this suggests that the effects of socioeconomic status might reduce the<br />
costs of both youth and adult crime in New Zealand, 165 by $1.7 billion annually, or 19%. 166 Eliminating<br />
poverty for 20% of children would increase this figure (based on a sixth of the population) to about<br />
23%.<br />
Studies by the Rowntree Trust indicate that 51% of crime costs are attributable to those aged under<br />
25. Analysis of New Zealand Police ‘apprehension rates by age’ show 48% of crime committed<br />
by those under 20 years (population 1.27 million) compares to 52% by 2.8 million older adults. A<br />
significant majority of criminal behaviour is established by age 20, thus a significant proportion of the<br />
adult costs of crime are a consequence of youth crime. Based on Spier (2001) we conservatively<br />
estimate that about 75% of adult crime flows on from youth criminal behaviour, since 78% of over<br />
20 year olds have prior convictions. Eliminating poverty would not only reduce youth crime by 23%,<br />
but also reduce adult crime by around 18%. Overall this corresponds to a long term 20% reduction<br />
in cost of crime.<br />
The Treasury estimate for the costs of crime in New Zealand is $2.1 billion for public sector costs, and<br />
$7.0 billion for mainly victim costs. We believe these estimates are understated, primarily because<br />
of the assumptions on the ratio of actual crime to reported crime. Treasury assumes a ratio of 4:1,<br />
based on UK and Australian data.<br />
The Ministry of Justice’s Crime and Safety Survey (NZCASS) (2010) indicates that only about 12% of<br />
crime reported to the survey is recorded in police statistics as reported crime. This suggests that the<br />
Treasury estimate of costs of crime is significantly understating the actual cost. Since the NZCASS<br />
data is twice the assumed 4:1 ratio between actual and reported crime; the true figure is more likely<br />
to be nearer 8:1. This ratio would roughly double victim costs; and take the estimated New Zealand<br />
total cost of crime from $9.1 billion to nearer $16.1 billion. The New Zealand Treasury ratio of actual<br />
to reported crime is also inconsistent with the self-reported crime and conviction ratios in the table<br />
above from Ferguson (2004) combined with official conviction rates which yields a figure of 11:1. 167<br />
The Treasury’s 4:1 is likely to be a serious underestimate.<br />
We conclude that the costs of crime resulting from low socioeconomic status (for the lowest 20% of<br />
the youth population) is in the region of 23% of youth crime, and 19% of all crime, which has a cost<br />
range of $9-$16 billion; thus potential savings of $1.7 to $2.6 billion or 1.0% to 1.5% of GDP.<br />
164 Reported crime from 3.21 to 1.68 (=1.53) for 1/6 th of youth population, or 0.255 in a whole cohort average of 1.933,<br />
or 13% overall. Convictions would fall from 25.82 to 5.42 (=20.4) for 1/6 th of youth population, or 3.4 in a whole cohort<br />
average of 8.77, or 39% overall.<br />
165 The Treasury’s Costs of Crime estimates were based on multiplying up reported crime to estimate actual crime, and this<br />
figure is considered to be somewhere between self- reported offending, and convictions.<br />
166 This figure is derived by assuming the justice system costs are proportional to convictions (so would reduce by 39% if<br />
child poverty eliminated) whilst the private costs (victims) are proportional to self-reported crime (which would reduce by<br />
13%).<br />
167 Authors own calculation. Details available on request.<br />
199
Table 18.3. Savings estimates from reduced crime by elimination of <strong>Child</strong> <strong>Poverty</strong><br />
Treasury estimate<br />
Authors’ estimate<br />
Ratio of Actual to reported Crime 4:1 8:1<br />
Costs of Crime<br />
Government $2.1b<br />
Government $2.1b<br />
Public $7.0b<br />
Public $14.0b<br />
Total $9.1b<br />
Total $16.1b<br />
Apprehensions by age Under 20 43%<br />
Over 20 57%<br />
Savings from Eliminating <strong>Poverty</strong> Government 13%<br />
Public 39%<br />
Savings Government $0.82<br />
Public $0.91<br />
Government $0.82<br />
Public $1.82<br />
Proportion of Costs<br />
Of Crime<br />
Of GDP<br />
Health costs<br />
Total $1.73<br />
19%<br />
1.0%<br />
Total $2.64<br />
16%<br />
1.5%<br />
Holzer, et al. (2007) also examine the health costs of child poverty. Their key reference is a paper<br />
by Cutler & Richardson (1998) who estimate ‘quality of life health measures’ (QALY). They use an<br />
annual value for a year of life of $100,000 which is then adjusted according to QALY. For example<br />
QALY for blindness is 0.89 so the value for a year of life for someone who is blind is $89,000. Or<br />
alternatively the ‘cost’ of blindness for a year is $11,000. Similarly the ‘cost’ of an early death would<br />
be $100,000 a year. When Cutler and Richardson (1998) analyse the cost of morbidity and mortality<br />
against child poverty at birth they find that the extra cost is around $124,000 compared to a new born<br />
child in a household above the poverty line. Holzer, et al. (2007) using a similar approach estimate<br />
the economic value of lost quality of life caused by child poverty to be 1.1% of GDP. 168 They also find<br />
that poverty raises direct health costs by around 0.2% of GDP but note that, because expenditures<br />
on Social Security, Disability Insurance, and other categories are omitted due to lack of estimates<br />
of these poverty effects, this estimate is likely to understates the true effects of poverty. Totalling the<br />
direct costs and the loss of quality and quantity of life costs gives a child poverty health cost of 1.3%<br />
of GDP.<br />
Bramley and Watkins (2008) consider only the direct health costs in the UK. They estimate these to<br />
be £2 billion or about 0.3% of GDP. This approach considers only direct health costs to age 18, and<br />
ignores all longer term health effects, including direct health system costs; loss of work capacity and<br />
earnings potential; and welfare cost consequences.<br />
A related study by LaVeist, Gaskin, and Richard (2009) looks at the economic burden of health<br />
inequalities in the US. They find the direct and indirect costs of health disparities to be approximately<br />
168 This does not include lost earnings which has been estimated above.<br />
200
1.8% of GDP. DeVol and Bedroussian (2007) put long term conditions in the US as costing US$1.3<br />
trillion, of which 85% ($1.1 trillion) was indirect, lost productivity costs.<br />
The Ministry of Health (2001a) examined the top causes of disability adjusted life years (DALYs) lost<br />
by specific conditions in New Zealand. The report found that nine of the top 10 causes were longterm<br />
conditions. As detailed elsewhere in this publication, many of these conditions are a direct result<br />
of child poverty.<br />
In the absence of any overall economic cost studies, we make an estimate: we assume some fraction<br />
of adult over-25 health is a consequence of the childhood poverty experience. There is strong<br />
evidence for this in the literature. Researchers for End <strong>Child</strong> <strong>Poverty</strong>, a UK charity, quote Power, Li,<br />
and Manor (2000, p. 9):<br />
Adults at 33 years of age in the 1958 British national cohort were 50 per cent more likely to report<br />
limiting illness if they had experienced disadvantage at seven and 11 years of age.<br />
Power, et al. (2000) quote Kuh & Wadsworth (2003) who report that good health is associated with<br />
better socioeconomic conditions in childhood and higher educational qualifications. Magnuson &<br />
Votruba-Drzal (2009) report that, by age 50, in comparison to individuals whose incomes are 200%<br />
of the poverty line or greater, individuals who have experienced poverty in childhood are 46% more<br />
likely to have asthma, 83% more likely to have been diagnosed with diabetes, and 40% more likely<br />
to have been diagnosed with heart disease. The comparison of those under the poverty line with<br />
those at or above twice that level, corresponds to the first quintile, compared to the other 4 quintiles,<br />
in New Zealand wages terms. 169 This is equivalent to comparing Deprivation Index 9 and 10 with a<br />
population of Deprivation Index 1 to 8. Haas (2007, p. 113) confirms the linkages:<br />
This study assesses retrospective childhood health reports and examines childhood health as<br />
a predictor of adult health. The results suggest that such reports are of reasonable reliability<br />
as to warrant their judicious use in population research. They also demonstrate a large positive<br />
relationship between childhood and adult health. Compared with excellent, very good, or good<br />
childhood health, poor childhood health is associated with more than three times greater odds<br />
of having poor adult self-rated health and twice the risk of a work-limiting disability or a chronic<br />
health condition. These associations are independent of childhood and current socioeconomic<br />
position and health-related risk behaviours.<br />
Holt (2010) identified the risk of ill health by educational qualification. This shows that the unqualified<br />
have a 13% probability of an annual ill-health cost, compared to 9.2% for the population at large<br />
(and 8.4% for the qualified groups).This is a 45% or 58% higher probability (i.e. relative risk). A high<br />
proportion of children growing up in poverty are in this unqualified group. 170<br />
Based on these studies we conservatively estimate that experience of childhood poverty increases<br />
the chances of ill health in later life by 50% compared to the average.<br />
Analysis of New Zealand relative hospital admissions 171 suggests that the Decile 9 and 10 Deprivation<br />
Index 172 patients under age 24 have about 80% higher incidence of admission than the average of<br />
169 NZIS June ’10 qtr tables /Table 8. Personal Incomes; Quintile 1 = $180 pw; Quintile 2 = $379 pw/<br />
170 From the analysis of qualification based on UE pass rates (24% v 48%), about double the proportion of children in poverty<br />
will be in this unqualified group later in life, compared to the rest of the population.<br />
171 Analysis of Indicator handbook data.<br />
172 Deciles 9 and 10 are the most deprived deciles in the Health Index, the opposite of the Education Index.<br />
201
their age group (and 137% higher than patients from Deprivation Index groups 1-8). The excess<br />
admissions represent about 16% (and up to 27%) of under-24 admissions. Based on the proportion<br />
of admissions from under 24 age group 29% 173 then the excess admissions of the Decile 9 and 10<br />
group represent about 4.6% to 8% of all hospital admissions. Moreover, these admissions reflect a<br />
propensity for remaining a higher proportion of admissions and costs in later years also as discussed<br />
above.<br />
The 50% higher chance of ill health for adults who experienced child poverty translates into a 10%<br />
excess ill health figure since 20% of adults will be in this group. Adding these up in proportion based<br />
on the relative populations of under and over age 24 gives the estimate that the effects of growing<br />
up in this deprived quintile is be between 11.8% and 14.8% of health services costs. Vote Health is<br />
around $11.8 billion, and direct health costs are estimated at $15.4 billion 174 so the effects of child<br />
poverty on hospital direct costs might be around $1.8 billion to $2.3 billion (1% to 1.3% of GDP).<br />
Education opportunity costs<br />
Evidence from enriched preschool programs<br />
One of the recurring themes that has emerged in our survey of the literature is how much of the<br />
costs of poverty are due to lack of income and how much should be attributed to other factors such<br />
as parental education, neighbourhood effects, and heredity factors. Our reading of the evidence is<br />
that about half of the costs can be directly attributed to lack of income. Income poverty is also proxy<br />
for other factors in a child’s environment which cause disadvantage. An interesting question then<br />
is: ‘What policy interventions, if any, can address the non-monetary disadvantages that children<br />
experience growing up in poverty?’<br />
A number of studies in the US have tried to examine the impact of programmes that attempt to enrich<br />
the early years of childhood directly. The most famous of these is the Perry preschool experiment<br />
(Schweinhart, 2006). An intensive preschool programme was administered to 5 different waves of<br />
randomly selected disadvantaged children in the US between 1962 and 1967. A randomly selected<br />
control group did not undertake the special programme. Between the ages of 3 and 5 years, the<br />
children who participated in the program had daily 2.5 hour classroom sessions on weekday mornings<br />
and a weekly 90 minute home visit by a teacher to involve the mother in the educational process. The<br />
children’s progress was then tracked at regular intervals.<br />
Heckman and Masterov (2007) estimate the cost in 2004 would be US$8,785 per participant year.<br />
They report a significant boost in children’s IQ up to the age of about 8 which then fades. They<br />
summarise the results of the programme thus:<br />
Test scores for the treatment group were consistently and significantly higher through to age 14.<br />
Participants had higher grades and were more likely to be employed and to earn more and they<br />
were less dependent on welfare. There was substantially less crime among participants, both in<br />
terms of incidence and severity, a recurrent finding of early intervention programs. (Heckman and<br />
Masterov, 2007, p. 480)<br />
Heckman and Masterov (2007) report similar results for two other early intervention studies, and<br />
consider the impact of introducing such a scheme to all children from disadvantaged backgrounds.<br />
173 Publicly-funded-hospital-discharges-07-08.<br />
174 Cost of Health Expenditure from Health Expenditure Trends in New Zealand 1996-2006, MoH 2008, from Ministry of<br />
Health’s website: http://www.moh.govt.nz Table 5.3.<br />
202
Eventually all benefits to society, including savings for government, reduced crime costs, and<br />
increased productivity, total $422 billion or 3% of GDP. They estimate 175 the total rate of return of<br />
introducing the Perry preschool program to be 16%.<br />
Of course care needs to be taken in extrapolating these figures to the New Zealand context<br />
especially as there has been increased support for pre-school education over the last decade or<br />
so. Nevertheless the experiment demonstrates that there may be policy options to address factors<br />
associated with child poverty and deprivation apart from lack of physical resources which hinder the<br />
opportunities for children with disadvantaged backgrounds to reach their potential.<br />
Summary Table<br />
Bringing together the three categories of impact assessed above we see an overall impact of child<br />
poverty on New Zealand’s economy of 3.8% to 4.6% of GDP.<br />
Table 18.4. Summary of Impact of eliminating child poverty on GDP<br />
Overseas<br />
New Zealand<br />
Loss of<br />
Productivity<br />
1% to 2% of GDP UK 1.8% of GDP NZ<br />
2.1% of GDP US less 40%<br />
hereditary, 1.3% of GDP.<br />
1% of GDP (under 5 study)<br />
Saving from<br />
reduced Crime<br />
1.9% to 3.2% of GDP UK 1.0% to 1.5% of GDP NZ<br />
Health Costs<br />
reduced<br />
Total<br />
1.3%-2% of GDP US<br />
0.4% of GDP direct costs to age 18<br />
only UK<br />
1.3% to 1.8% of GDP US<br />
1% to 1.3% of GDP NZ<br />
3.8% to 4.6% of GDP<br />
Finally we note that this estimate may be conservative when using data based on socio- economic<br />
indexes based on geographical area.<br />
As discussed above what is likely to be more important for outcomes for children is their ‘poverty<br />
of experience’ rather than conventional child poverty which is based on income alone. We could in<br />
principle try to construct a ‘poverty of experience’ variable based on a range of variables. The list<br />
could include income, neighbourhood, education of parents, whether parent/s have a job, whether<br />
they suffer from alcohol or drug abuse or have a history of depression, overcrowding, family culture,<br />
as well as many other variables.<br />
If we could identify children suffering from poverty of experience in this way, and intervene to move<br />
them towards the average childhood experience, then we believe the gains would be substantially<br />
bigger than just focusing on income alone.<br />
Both the school decile index and the health deprivation index take other factors into account besides<br />
175 See supporting statistics in Chapter 12 to Gluckman et al (2011 ) who quote evidence that early intervention programmes<br />
will benefit: cost ratios of 2.3 to 1 to 16 to 1.<br />
203
parental income. For example the health deprivation index considers the proportion of the population<br />
in each area using the following variables (in decreasing weight order):<br />
• People aged 18-64 receiving a means tested benefit;<br />
• People living in households with income below an income threshold;<br />
• People not living in own home;<br />
• Single parent family;<br />
• Unemployment;<br />
• Qualifications: People aged 18-64 without any qualifications;<br />
• Living space: People living in households below a bedroom occupancy threshold;<br />
• Communication: People with no access to a telephone;<br />
• Transport: People with no access to a car.<br />
Clearly the deprivation index captures some of what we mean by ‘poverty of experience’, but there<br />
are many important variables that are not included, for example: whether the parents suffer from<br />
depression or have a drug or alcohol problem. 176 <strong>Further</strong>more the geographical basis of these socio<br />
economic indicators means that they will contain a mixture of deprived and non-deprived families in<br />
each area.<br />
These factors we believe significantly bias our estimates of the cost of child poverty (interpreted in<br />
the way just described) downwards, perhaps significantly so. <strong>Further</strong> research is needed to quantify<br />
this.<br />
Conclusion<br />
The results of the literature review and our own calculations are collected in Table 18.4 above.<br />
The international evidence for the US and UK is that the costs of child poverty in those countries is<br />
between 3% and 4% of GDP. Our calculations find for New Zealand the annual costs are between<br />
3.8% to 4.6% of GDP.<br />
Capturing the potential savings of eliminating poverty requires policy actions that address both the<br />
‘Income Barrier’ for families in income poverty, and that provide acceptable focussed support for<br />
parents of children who are suffering from ‘poverty of experience’. In our view addressing income<br />
adequacy is an important first step but not enough on its own to address the second issue we have<br />
identified.<br />
Reducing child poverty requires a sustained intergenerational effort, which can have a significant<br />
effect on the long term national economy.<br />
176 The NZDEP Survey 2006 uses 9 deprivation-related variables: means-tested benefit; household income; access to<br />
a telephone; unemployed; single-parent families; no qualifications; dwellings not owner-occupied; access to a car;<br />
occupancy/overcrowding (C Salmond, P Crampton, & J Atkinson, 2007, pp. 40-41)<br />
204
Bringing up children in poverty has bad consequences for a society, and for all its citizens. We<br />
believe we have demonstrated it has serious economic consequences for New Zealand. What is<br />
now required is prompt creation of new policy and action plans to reduce child poverty. Creation and<br />
justification for deploying new initiatives can now be assisted by knowledge of the scale of potential<br />
benefits.<br />
The next steps will depend on efforts to estimate the costs, and impacts, of each new initiative, to<br />
enable policy choice based on benefit cost comparisons.<br />
Recommendations<br />
Six broad issues must be addressed:<br />
• Creation of productive well-paid jobs that enable all those who wish to work to find economically<br />
valuable work;<br />
• If parent/s of children are unable to work, increase their income above the poverty line. At the very<br />
least family incomes should be lifted enough so that the children are no longer living in poverty;<br />
• Offer cultural education, motivation, and opportunities to families whose children suffer from<br />
“poverty of experience” to enable them to recognise, and act on the potential to lift their children<br />
to a lifetime out of poverty. It is based on supporting “peer leadership” by the natural leaders of<br />
local communities, in creating and sustaining acceptable ways of reducing poverty;<br />
• Developing willingness in the Government and the public service to experiment on a variety of<br />
local initiatives, based on the broad body of existing research, and to accept that whilst some will<br />
fail, the best will be capable of replication. Local “ownership” of programs to reduce poverty may<br />
well be as important to their success as compelling prior research evidence;<br />
• Investigate the potential of enriched pre-school programmes for children with deprived<br />
backgrounds;<br />
• Recognising that the time scale of achieving measurable results is long. Persistence and patience<br />
is required:<br />
a. Impacts on child health costs will accrue benefits progressively over 20 years, with ongoing<br />
lifetime savings thereafter;<br />
b. Crime cost savings will commence after about 15 years, and will increase over about 20<br />
years;<br />
c. Increased productivity effects will emerge from about year 20, and will increase<br />
progressively over the next 20 years.<br />
205
Summary of Chapter<br />
Recommendations<br />
Chapter 2. <strong>Child</strong> poverty and inequality<br />
• Adopt an official poverty line at 60% of the contemporary median, disposable, after housing costs,<br />
household income;<br />
• Also monitor poverty on a fixed line basis;<br />
• Supplement these measures by regular surveys of hardship;<br />
• Set net income for those on benefits so that no-one is under the poverty line;<br />
• Pledge to end child poverty in New Zealand by 2020;<br />
• Acknowledge the vital social and economic contribution made by good parenting;<br />
• Create a senior Cabinet position with responsibility for children, such as a Minister for <strong>Child</strong>ren, to<br />
support the move toward a child-centred approach to policy and legislation; and fund child-impact<br />
assessments of existing national and local policies;<br />
• Monitor all major indicators of child poverty and report these on a regular basis with specific target<br />
reductions to be met on the way to ending child poverty by 2020.<br />
Chapter 3. Work, Families and <strong>Poverty</strong><br />
• Review and adjust benefit levels to ensure that families with children are not below the poverty<br />
line;<br />
• Acknowledge the work of caring for dependents by ensuring that this work is treated as being of<br />
equal status to paid work;<br />
• Reject WWG recommendations which fail to meet the above objectives and which treat<br />
beneficiaries as second class citizens.<br />
Chapter 4. The Whānau Ora Approach<br />
• A true fundamental review of the social security system that does not threaten the amount of<br />
income support that is given to families in need, but seeks to identify ways to make the existing<br />
system less individualistic and more responsive to whānau needs;<br />
• This review needs to be carried out in true conjunction with Māori;<br />
• That Whānau Ora providers give assistance and training in social security provisions to whānau<br />
to ensure whānau are fully apprised of their entitlements.<br />
206
Chapter 5. New Zealand Pacific <strong>Child</strong>ren and Their Families<br />
Seek a commitment from leaders in Pacific Communities, Government agencies, and Parliamentarians<br />
to:<br />
• Address inequalities with appropriate healthcare;<br />
• Design integrated strategies and interventions for Pacific peoples.<br />
Chapter 6. Working for Families<br />
• Remove all hours worked requirements from child-based family assistance.<br />
• Reverse the decline in Working for Families as set out in the 2011 budget for the years 2012-2018.<br />
• Simplify to make Working for Families more understandable.<br />
• Abolish the In Work Tax Credit and add $60 per week to the first-child Family Tax Credit.<br />
• Fully adjust the Family Tax Credit for inflation every year. Leave the rate of abatement at 20%.<br />
• Administer all payments of the Family Tax Credit through the IRD and pay the full amount to one<br />
caregiver. No shared care apportionment.<br />
• Abolish the Minimum Family Tax Credit and allow more flexibility for those on part benefits.<br />
• Raise the first $100 market income threshold for abatement of the Domestic Purposes Benefit to<br />
$180 per week and the second $200 threshold to $250. Extend the 30 cents in the dollar abatement<br />
of net benefit, effective between $180 and $250, to all beneficiaries with young children.<br />
• Eventually universalise $20 of the Family Tax Credit for each child under 5 as part of a return a<br />
commitment to the principle of inclusion; but only if accompanied by an increase in the progressivity<br />
of the tax scale and not at the expense of meeting poverty reduction among the poorest.<br />
Chapter 7. Paid Parental Leave in New Zealand: catching up with Australia?<br />
• Improve the level and coverage of financial support for all new parent/s and their newborn children<br />
so that none miss out.<br />
• Investigate a Baby Bonus equivalent to ensure all newborn children are funded for the best<br />
possible start.<br />
• Change the PPL eligibility requirements so that the work test does not require the same employer<br />
and so promote flexibility in meeting work requirements.<br />
• Investigate how to encourage firms to remain in contact with their employees, and enable new<br />
parents to maintain their links to the labour market.<br />
• Allow parents/primary caregivers to share the PPL.<br />
• Pay the PPL at a standardised rate, rather than an earnings-based percentage.<br />
Chapter 8. Reforming <strong>Child</strong> Support<br />
• <strong>Child</strong> Support reform must have the child’s well-being at the centre, not the financial needs of the<br />
Crown, nor of just the non-custodial parent.<br />
207
• <strong>Child</strong> Support reform must act to ameliorate child poverty for children in families supported by a<br />
benefit or low income.<br />
• Part or all of <strong>Child</strong> Support should be paid directly to the parent on a benefit and used in the<br />
income assessment of the beneficiary.<br />
• <strong>Child</strong> Support reform must aim to simplify agreements between parents, and arrangements with<br />
the IRD and Work & Income rather than complicate them and cause stress and anxiety.<br />
• <strong>Child</strong> Support reform must be conducted in a holistic environment that takes into account issues<br />
of the caregiver’s opportunity costs, the way Working for Families tax credits operate, and the<br />
government initiatives to re-define family income for social assistance purposes.<br />
• More resources for post-separation parenting courses and financial counselling are needed to<br />
encourage voluntary arrangements outside of the <strong>Child</strong> Support scheme to gain the benefits from<br />
flexibility and co-operation.<br />
Chapter 9. Tax Reform and the macro economy: Heaven help the children<br />
• Review the economic management of the past four years that has relied on tax cuts to stimulate<br />
the economy, borrowing to fund disaster relief and spending cuts to restrain the budget deficit.<br />
Learn the lessons from Australia.<br />
• Return GST to 10% as in Australia and complement with progressive taxation. If there is no<br />
appetite for that, then far more generous compensation of lower income groups is required via<br />
higher benefits and more generous tax credits.<br />
• Aggregate all income for tax purposes under a comprehensive income tax approach.<br />
• Tax all investments at the appropriate marginal tax rate of the investor and eliminate special<br />
treatments.<br />
• Reform the tax treatment of rental housing and home-ownership investment to remove regressive<br />
advantages with either a Capital Gains Tax or a Risk Free Rate Method approach.<br />
• Abandon income splitting as a policy under the Income Sharing Bill.<br />
Chapter 10. <strong>Poverty</strong> and violence, and children<br />
• Locate the best interests of children at the centre of programmes and services for children and<br />
families faced with issues of violence and child abuse;<br />
• Include an understanding of the significance of poverty in the context of child abuse, and adopt a<br />
comprehensive and holistic approach to child abuse and violence towards children;<br />
• Provide comprehensive and sustained services to ensure long-term improvement for children in<br />
severely disadvantaged and deprived families;<br />
• Wherever possible, considering the best interests of the child, treat parents as active partners in<br />
the development of effective services;<br />
• The small number of children who are unable to be provided for adequately and appropriately by<br />
their parents are especially at risk and require particular attention and priority for their protection<br />
and their effective development.<br />
208
Chapter 11. Families, <strong>Child</strong>ren, and the Law<br />
• New Zealand needs to withdraw its reservations to UNCROC and implement all of its obligations<br />
under the convention;<br />
• The Family Court and Department of <strong>Child</strong>, Youth and Family should be resourced so that cases<br />
relating to children can be properly and promptly resolved;<br />
• <strong>Child</strong>ren born in New Zealand automatically become New Zealand citizens;<br />
• Non-New Zealand citizen children are entitled to health and education services while they are in<br />
New Zealand;<br />
• No children or young people should be detained in police cells and steps should be taken to<br />
ensure there are always beds available in youth justice facilities, and<br />
• The age of criminal responsibility should be raised back up to 14 years;<br />
• Counselling programmes should be made available for child domestic violence victims and<br />
witnesses;<br />
• Implement the safe@home programme or an equivalent service nationwide;<br />
• Amend the Social Security Act to require the best interest of children to be taken into account in<br />
all decision-making relating to benefits or alleged benefit fraud;<br />
• Establish an independent benefits review system, either through an Ombudspersons Office or<br />
ACC review model.<br />
Chapter 12. <strong>Child</strong> Health and <strong>Poverty</strong><br />
• The first priority is to create free access to primary care services for children under 6 years: all<br />
days of the week and for afterhours services;<br />
• Increase the governments' strategic and financial commitment to children’s health and child<br />
mental health, as a much larger percentage of the national health budget;<br />
• Government to respond to concerns and recommendations from 2010 PHAC report;<br />
• Create a national health target that focuses on reducing poverty-related admissions to hospital<br />
for children;<br />
• Urgently develop a national strategy to focus on under-nutrition in children. Strategies could<br />
include making breakfast available to all in Decile 1 and 2 schools;<br />
• Monitor mental health and substance use, and institute a national programme for screening for<br />
depression (as the TaskForce for Prevention in USA).<br />
Chapter 13. Housing poverty and children<br />
• That research be undertaken by NGOs universities and Government agencies to more closely<br />
establish the relationship between inadequate housing and the poor health and educational<br />
outcomes being achieved for many New Zealand children.<br />
• The Government develop and fund a national housing plan to address the emerging housing<br />
shortages identified by the Department of Building.<br />
209
Chapter 14. The impact of social hazards on children<br />
<strong>Child</strong> <strong>Poverty</strong> <strong>Action</strong> <strong>Group</strong> urges that the protection of children be at the forefront of the regulatory<br />
framework around social hazards, including:<br />
• Banning tobacco retail displays;<br />
• Requiring plain packaging and graphic warnings to replace brand imagery;<br />
• Ensuring locations where young people are present, including private vehicles, are smokefree;<br />
• Empowering parents and caregivers to be smokefree in order to protect their children from<br />
becoming smokers;<br />
• Exposing the tactics and activities of the tobacco industry.<br />
• CPAG supports the recommendations of the Alcohol <strong>Action</strong> group:<br />
o Introduce a minimum price per standard drink to end ultra-cheap alcohol sales;<br />
o Reduce the adult drink-driving limit from 0.08 to 0.05;<br />
o Begin a five year period of dismantling alcohol advertising and sponsorship;<br />
o Restore alcohol-free status to supermarkets;<br />
o Return the purchase age for both on- and off-license to 20 years; and<br />
• In recognition of the considerable harm that excessive alcohol consumption does to New<br />
Zealand’s young people: restrict its marketing and availability, and introduce harsher penalties<br />
for drink-driving;<br />
• Recognise the damage ‘problem gambling’ does to the children in a family and in a community,<br />
and support a Public Health approach toward amelioration and solutions;<br />
• Support the ‘sinking lid’ policy toward the reduction of gambling machines, and develop alternative<br />
options for community funding of sports and charities;<br />
• Follow the lead of most of the rest of the developed economies and cap interest rates;<br />
• Support the teaching of financial literacy as part of the curriculum in primary schools.<br />
Chapter 15. Early childhood care and education<br />
• Government commit to reducing reliance on private sector provision of early childhood education<br />
and care as a long-term objective, aligning the early childhood sector with primary education in<br />
terms of accepting government responsibility for both quality and access expectations in order to<br />
ensure equitable provision;<br />
• Government enable adequate funding provision to ensure that all early childhood education<br />
centres are fully staffed by qualified teachers, and further require ratios of teachers to children<br />
and unit sizes to be maintained in accord with quality guidelines;<br />
• Establish a model of ECE provision that is more intentional in terms of who it serves, where it is<br />
located and what else it provides to support parents and families;<br />
210
• Base the new model of ECE provision on a neighbourhood by neighbourhood and a town by town<br />
assessment of future early childhood education needs;<br />
• Start thinking about travel distances in terms of pushing strollers rather than in terms of driving<br />
SUVs.<br />
Chapter 16. A turn for the worse? Some recent developments in the school sector<br />
• That the New Zealand Government acknowledge that international research suggests that the<br />
National Standards policy may have perverse and damaging effects;<br />
• That the Government investigate such effects thoroughly and respond accordingly rather than<br />
pushing ahead with the policy regardless of its impact;<br />
• That the Government look for ways to avoid further damage being created by ‘league tables’<br />
of National Standards achievement, acknowledging that it is not feasible to take full account of<br />
school context in such tables;<br />
• That the Government takes sustained action towards addressing the supply of quality teachers to<br />
low decile schools in ways that do not involve mirroring charity and business-based models which<br />
overseas research have shown to be largely ineffective;<br />
• That teacher education providers take greater account, in teacher education and postgraduate<br />
courses, of the social justice issues surrounding education and children in poverty;<br />
• That teacher education providers actively develop and promote courses for teachers wishing to<br />
teach in lower decile schools. Such courses would focus on empowering and culturally appropriate<br />
teaching and learning in lower socio-economic contexts.<br />
Chapter 17. Youth and employment<br />
• All political parties commit to a substantial reduction of youth unemployment rates as part of the<br />
2011 election, develop a range of policies to achieve this and evaluate and monitor those policies;<br />
• Create and fund additional training opportunities, including apprenticeships and mentor services;<br />
• Develop a fuller range of training programmes and job opportunities for Māori and Pasifika young<br />
people to reduce their unemployment rates;<br />
• New incentives for employers to employ young workers;<br />
• Open up tertiary education opportunities for further study and skill development until the economy<br />
improves;<br />
• The education system needs to recognise the diversity of skills beyond the academic and develop<br />
these;<br />
• Support and develop opportunities for school students to make connections with industries that<br />
might want to employ them;<br />
• Require a commitment from New Zealand employers to monitor their employees and prioritise<br />
remedying gender inequity.<br />
211
Chapter 18. The costs of child poverty<br />
• Creation of productive well paid jobs that enable all those who wish to work to find economically<br />
valuable work;<br />
• If parent/s of children are unable to work, increase their income above the poverty line. At the very<br />
least family incomes should be lifted enough so that the children are no longer living in poverty;<br />
• Offer cultural education and motivation and opportunities to families whose children suffer from<br />
“poverty of experience” to enable them to recognise, and act on the potential to lift their children to<br />
a lifetime out of poverty. It is based on supporting “peer leadership” by the natural leaders of local<br />
communities, in creating and sustaining acceptable ways of reducing poverty;<br />
• Developing a willingness in Government and the public service to experiment on a variety of local<br />
initiatives, based on the broad body of existing research, and to accept that whilst some will fail,<br />
the best will be capable of replication. Local “ownership” of programs to reduce poverty may well<br />
be as important to their success as compelling prior research evidence;<br />
• Investigate the potential of enriched pre-school programmes for children with deprived<br />
backgrounds;<br />
• Recognising that the time scale of achieving measurable results is long. Persistence and patience<br />
is required:<br />
a. Impacts on child health costs will accrue benefits progressively over 20 years, with ongoing<br />
lifetime savings thereafter;<br />
b. Crime cost savings will commence after about 15 years, and will increase over about 20<br />
years;<br />
c. Increased productivity effects will emerge from about year 20, and will increase<br />
progressively over the next 20 years.<br />
212
References<br />
Aber, J. L., & Bennett, N. G. (1997). The effects of <strong>Poverty</strong> on <strong>Child</strong> Health and development. Annual<br />
Review of Public Health, 18, 463-483.<br />
Adolescent Health Research <strong>Group</strong>. (2007). Youth’07: The Health and Wellbeing of Secondary<br />
School Students in New Zealand. Technical Report. Auckland: The University of Auckland.<br />
AGB/McNair. (1992). Survey of Demand for Bilingual and Immersion Education in Māori. Wellington:<br />
Ministry of Education/AGB/McNair.<br />
Alcohol <strong>Action</strong>. (2011). We Need More Than Just Tinkering. May 2011 Newsletter.<br />
Alcohol Advisory Council (ALAC). (2010). Manukau Outlet Density Research Reports. AlcoholNZ,<br />
10.<br />
Alexander, R. (Ed.). (2009). <strong>Child</strong>ren, their World, their Education: Final report and recommendations<br />
of the Cambridge Primary Review. London: Routledge.<br />
Alpert, H., Behm, I., Connolly, G., & Kabir, Z. (2011). Smoke-free Households with <strong>Child</strong>ren and<br />
Decreasing Rates of Paediatric Clinical Encounters for Otitis Media in the United States<br />
Tobacco Control, 20, 207-211.<br />
Anastasiadis, S. (2010). Health and Wealth. Working Paper 10/05. Wellington: New Zealand Treasury.<br />
Anda, R. F., Felitti, V. J., Bremner, J. D., Walker, J. D., Whitfield, C., Perry, B. D., et al. (2006). The<br />
enduring effects of abuse and related adverse experiences in childhood. A convergence of<br />
evidence from neurobiology and epidemiology. European Archives of Psychiatry & Clinical<br />
Neuroscience, 256(3), 174-186.<br />
Andersen, J., & Guillemard, A. (2005). Conclusion: policy change, welfare regimes and active<br />
citizenship. In J. Andersen & P. Jensen (Eds.), ‘Active citizenship: the new face of welfare.<br />
Bristol: The Policy Press.<br />
Andersen, J., Guillermard, M., Jensen, P., & Pfau-Effinger, B. (Eds.). (2005). The Changing Face of<br />
Welfare. Bristol: The Policy Press.<br />
Andersen, J., & Jensen, P. (Eds.). (2005). ‘Active’ citizenship: the new face of welfare. Bristol: The<br />
Policy Press.<br />
Anderson, D. (1999). The Aggregate Burden of Crime. Journal of Law and Economics, 42, No. 2,<br />
611-642.<br />
Andrulis, D. P. (1998). Access to care is the centerpiece in the elimination of socioeconomic disparities<br />
in health. Annals of Internal Medicine, 129(5), 412-416.<br />
Anyon, J. (2005). Radical possibilities. Public policy, urban education and a new social movement.<br />
New York: Routledge.<br />
Armstrong, J. (2010). Whānau Ora – Nanny State in drag? (10 April 2010) New Zealand Herald Retrieved<br />
from http://www.nzherald.co.nz/opinion/news/article.cfm?c_id=466&objectid=10637382<br />
213
Auld, J. (2006). Transience: Impact on Students and Schools. Dunedin College of Education, Otago<br />
University, Dunedin.<br />
Australian Productivity Commission. (2009). Paid Parental Leave: Support for Parents with Newborn<br />
<strong>Child</strong>ren. Canberra.<br />
Bagley, C., Woods, P., & Glatter, R. (2001). Implications of school choice policy: interpretation and<br />
response by parents of students with special educational needs. British Education Research<br />
Journal, 27(3), 287-307.<br />
Baker, M., McNicholas, A., Garrett, N., Jones, N., Stewart, J., Koberstein, V., et al. (2000). Household<br />
crowding a major risk factor for epidemic meningococcal disease in Auckland children.<br />
Pediatr Infect Dis J, 19(10), 983-990.<br />
Bandiera, F., Richardson, A., Lee, D., He, J., & Merikangas, K. (2011). Secondhand Smoke Exposure<br />
and Mental Health Among <strong>Child</strong>ren and Adolescents. Arch Pediatr Adolesc Med, 165(4),<br />
332-338.<br />
Banks, G. (2011). Evidence and Social Policy: The Case of Gambling. Canberra: Australian<br />
Productivity Commission. Gary Banks presentation to the South Australian Centre for<br />
Economic Studies in Adelaide on 30 March 2011. Available http://www.pc.gov.au/speeches/<br />
evidence-and-social-policy-gambling.<br />
Barnett, R. (2001). Coping with the costs of primary care? Household and locational variations in the<br />
survival strategies of the urban poor. Health Place, 7(2), 141-157.<br />
Barriere, D. (2009). <strong>Child</strong> Abuse an Epidemic in New Zealand. Retrieved 4 April, 2011, from http://<br />
www.child-abuse-effects.com/child-abuse-an-epidemic-in-new-zealand.html<br />
Bedggood, M., & Gledhill, K. (Eds.). (2011). Law into <strong>Action</strong>. Economic, Social and Cultural Rights in<br />
Aotearoa New Zealand. Auckland: Thomson Reuters.<br />
Bellringer, M., Abbott, M., & Brown, R. (2009). Gambling and Unreported Crime. Report for the<br />
Ministry of Health. Auckland: Gambling and Additions Research Centre, AUT University &<br />
Centre for Gambling Studies, The University of Auckland.<br />
Bennett, P. (2009). Media release 14 September 2009: More than 1000 Job Ops created for young<br />
people. Retrieved from http://www.beehive.govt.nz/release/more-1000-job-ops-createdyoung-people.<br />
Bennett, P. (2010). Paula Bennett Future Focus First Reading Speech 30 March 2010. Retrieved<br />
from http://www.beehive.govt.nz/speech/paula-bennett-future-focus-first-reading-speech-<br />
30-march-2010.<br />
Besharov, D., & Laumann, L. (1997). Don’t call it child abuse if It’s really poverty. Journal of <strong>Child</strong>ren<br />
and <strong>Poverty</strong>, 3(1), 5-36.<br />
Bill English. (2011). Media Release: Over $17b infrastructure investment in pipeline. Wellington: New<br />
Zealand Parliament.<br />
Binning, E. (2010, 1 November 2010). Student loans – the debt mountain. New Zealand Herald.<br />
Retrieved from http://www.nzherald.co.nz/nz/news/article.cfm?c_id=1&objectid=10684474<br />
214
Bishop, R., Berryman, M., & Richardson, C. (2001). Te Toi Huarewa. Effective teaching and learning<br />
strategies, and effective teaching materials for improving the reading and writing in te reo<br />
Maori of students aged five to nine in Maori-medium education (Report to the Ministry of<br />
Education). Wellington: Ministry of Education.<br />
Bjerk, D. (2007). Racial Profiling, Statistical Discrimination, and the Effect of a Colorblind Policy on<br />
the Crime Rate. Journal of Public Economic Theory, 9(3), 543-567.<br />
Black, L. (2011). What future for Dunedin’s young people? Press Release. Retrieved from http://<br />
www.scoop.co.nz/stories/AK1102/S00641/what-future-for-dunedins-young-people.htm<br />
Blakely, T., Tobias, M., Atkinson, J., Yeh, L.-C., & Huang, K. (2007). Tracking disparities: Trends<br />
in ethnic and socioeconomic inequalities in mortality 1981-2004. Public Health Intelligence<br />
Occasional Bulletin No. 38. Wellington: Ministry of Health.<br />
Blanden, J., Hansen, K., & Machin, S. (2010). The Economic Cost of Growing Up Poor: Estimating<br />
the GDP Loss Associated with <strong>Child</strong> <strong>Poverty</strong>. Fiscal Studies(31), 289-311.<br />
Boden, J. M., Fergusson, D. M., & Horwood, L., J. (2010). Risk factors for conduct disorder and<br />
oppositional/defiant disorder: evidence from a New Zealand birth cohort. Journal of the<br />
American Academy of <strong>Child</strong> & Adolescent Psychiatry, 49(11), 1125-1133.<br />
Bollard, A. (2010). Crisis. One central bank governor & the global financial collapse Auckland:<br />
Auckland University Press.<br />
Boulton, A., Simonsen, K., Walker, T., Cumming, J., & Cunningham, C. (2004). Indigenous Participation<br />
in the ‘New’ New Zealand Health Structure. Journal of Health Services Research and Policy,<br />
9(2).<br />
Bradshaw, J. (2006). <strong>Child</strong> Support and child poverty”. Benefits, 14(3).<br />
Bradshaw, J., Finch, N., & Eardley, T. (2003). How does the Australian child benefit package compare<br />
internationally? Paper presented at the “Australian Transfers and Inequality in comparative<br />
context”, Australian Social Policy Conference 2003.<br />
Bramley, G., & Watkins, D. (2008). The public service costs of child poverty. London: Joseph<br />
Rowntree Foundation.<br />
Brand, S., & Price, R. (2000). The Economic and Social Costs of Crime London: Home Office<br />
Research Study 217.<br />
Bull, A., & Gilbert, J. (2007). Student movement and schools – what are the issues? Wellington: New<br />
Zealand Council for Educational Research.<br />
Bynner, J. (2004). Literacy, Numeracy and Employability: Evidence from the British Birth Cohort<br />
Studies. Literacy and Numeracy Studies, 13, 31-48.<br />
Cagney, P., & Cossar, D. (2006). Fringe Lenders in New Zealand: Desk research project for Ministry<br />
of Consumer Affairs. Wellington: Research New Zealand.<br />
Callister, P., & Galtry, J. (2009). Baby Bonus or Paid Parental Leave – Which one is Better? Social<br />
Policy Journal of New Zealand, (34).<br />
215
Campbell, G. (2011). Failure to launch: the Government’s reluctance to engage with youth<br />
unemployment. Werewolf, March(21). Retrieved from http://werewolf.co.nz/2011/03/failureto-launch/<br />
Campbell, R. M. (1927). Family Allowances in New Zealand. The Economic Journal, 37(147), 369-<br />
383.<br />
Carpenter, V. M. (2010). Opening eyes to different worlds. Waikato Journal of Education, 15(1), 121-<br />
133.<br />
Carpenter, V. M. (2011, Tuesday April 19). ‘Bloodlines’ aim for schools unfair. New Zealand Herald,<br />
p. 11.<br />
Carpenter, V. M., McMurchy-Pilkington, C., & Sutherland, S. (2002). Kaiako Toa – highly successful<br />
teachers in low decile schools. Set, 1, 4-8.<br />
Carr, M., & Mitchell, L. (2010, Wednesday March 9). Young thrive with skilled teachers.<br />
NZ Herald. Retrieved from http://www.nzherald.co.nz/opinion/news/article.cfm?c_<br />
id=466&objectid=10654148<br />
Carroll-Lind, J., Chapman, J., & Raskauskas, J. (2011). <strong>Child</strong>ren’s perceptions of violence: the nature,<br />
extent and impact of their experiences. Social Policy Journal of New Zealand(37), 13.<br />
Carroll, P., Casswell, S., Huakau, J., Howden-Chapman, P., & Perry, P. (2011). The widening gap:<br />
perceptions of poverty and income inequalities and implications for health and social<br />
outcomes. Social Policy Journal of New zealand(37), 12.<br />
Casswell-Laird, O. (2010). <strong>Child</strong> Support: a summary and comparison of legislation and policy in<br />
New Zealand and Australia, Backgrounder. <strong>Child</strong> <strong>Poverty</strong> <strong>Action</strong> <strong>Group</strong>.<br />
Casswell, S. (2008). Assessment of the Social Impacts of Gambling in New Zealand. Report to<br />
Ministry of Health. Auckland: SHORE www.shore.ac.nz.<br />
Centre for <strong>Child</strong> and Family Policy Research. (2005). Outcome / impact evaluation of Family Start –<br />
Final report. Auckland: Auckland UniServices Limited.<br />
Centre for Social and Health Outcomes Research and Evaluation (SHORE). (2006). Socio-Economic<br />
Impacts of Gambling. Developing a methodology for assessing the socio-economic impacts<br />
of gambling in New Zealand. Auckland: Massey University.<br />
Centre for Social Research and Evaluation, & Inland Revenue Te Tari Taake. (2007). Receipt of the<br />
Working for Families Package. Wellington: Ministry of Social Development.<br />
Cerda, M., Diez-Roux, A., Tchetgen, E., Gordon-Larsen, P., & Kiefe, C. (2010). The relationship<br />
between neighbourhood poverty and alcohol use: Estimation by marginal structural models.<br />
Epidemiology & Infections, 21, 482-489.<br />
Chapple, S., & Cronin, J. (2007). A preliminary economic analysis of the impact of the <strong>Child</strong> Support<br />
scheme on labour supply and child poverty in New Zealand.<br />
Chemin, A. (22 July 2011, 22 July 2011). Norway lets fathers do their share. The Guardian Weekly,<br />
p. 28.<br />
216
Cheung, J. (2007). Wealth Disparities in New Zealand. Paper presented at the Social Policy, Research<br />
and Evaluation Conference. Retrieved from www.stats.govt.nz/sofie<br />
Cheyne, C., O’Brien, M., & Belgrave, M. (2005). Social Policy in Aotearoa New Zealand (3rd ed.).<br />
Melbourne: Oxford University Press.<br />
<strong>Child</strong> and Youth Mortality Review Committee Te Rōpū Arotake Auau Mate o te Hunga Tamariki Taiohi.<br />
(2009). Fifth Report to the Minister of Health Reporting Mortality 2002-2008. Wellington:<br />
<strong>Child</strong> and Youth Mortality Review Committee. Available http://www.cymrc.health.govt.nz/<br />
moh.nsf/pagescm/7657/$File/cymrc-fifth-ministres-report-02-08.pdf.<br />
<strong>Child</strong> Youth and Family and Ministry of Social Development. (2006). <strong>Child</strong>ren at increased risk of death<br />
from maltreatment and strategies for prevention. Wellington: Ministry of Social Development.<br />
<strong>Child</strong>ren’s Commissioner. (2008). Omnibus Survey Report. One year on: Public attitudes and New<br />
Zealand’s <strong>Child</strong> Discipline law. Wellington: Office of the Commissioner for <strong>Child</strong>ren.<br />
<strong>Child</strong>ren’s Commissioner. (2010). Report of the New Zealand <strong>Child</strong>ren’s Commissioner to the<br />
United Nations Committee on the Rights of the <strong>Child</strong> 2010. Wellington: The Office of the<br />
Commissioner for <strong>Child</strong>ren.<br />
Clark, H., & Maharey, S. (2001). Pathways to Opportunity. Nga Ara Whai Oranga. From Social<br />
Welfare to Social Development. Wellington: Ministry of Social Development.<br />
Claus, I., Leggett, G., & Wang, X. (2009). The costs of raising children Paper presented at the New<br />
Zealand Association of Economists Annual Conference, Wellington.<br />
Collins, S. (2010). Major shakeup ahead for apprenticeship system. New Zealand Herald. Retrieved<br />
from http://www.nzherald.co.nz/nz/news/article.cfm?c_id=1&objectid=10628850<br />
Collins, S. (2011, 19 April). Loan sharks leaving families unable to buy food, say experts. New<br />
Zealand Herald. Retrieved from http://www.nzherald.co.nz/nz/news/article.cfm?c_<br />
id=1&objectid=10720285<br />
Collins, S. (2011, 11 June). Youth in holding pattern as recession bites north. New Zealand<br />
Herald. Retrieved from http://www.nzherald.co.nz/economy/news/article.cfm?c_<br />
id=34&objectid=10731524<br />
Community Gaming Association. (undated). Community Gaming Association: Welcome. Wellington:<br />
Community Gaming Association. Available http://www.cga.org.nz/files/home.asp.<br />
Connolly, M., & Doolan, M. (2007). Lives Cut Short. <strong>Child</strong> death by maltreatment. Wellington:<br />
Dunmore Press.<br />
Consumer Magazine. (2011). The fringe lending sector. Consumer New Zealand.<br />
Corak, M. (2006). Do poor children become poor adults? Lessons from a cross-country comparison<br />
of generational earnings mobility. IZA Discussion Paper Series, 1993, 64.<br />
Corcoran, M., & Adams, T. (1997). Race, Sex, and the Intergenerational Transmission of <strong>Poverty</strong>. In<br />
G. Duncan & J. Brooks-Gunn (Eds.), Consequences of Growing Up Poor. New York: Russell<br />
Sage Foundation.<br />
217
CPAG. (2010). Submission to Policy Advice Division, Inland Revenue Department, on “An Incomesplitting<br />
tax credit for families with children: an official issues paper”. Retrieved from http://<br />
www.cpag.org.nz/assets/Incomesplitting2010.pdf<br />
Craig, E., Anderson, P., Taufa, S., & Jackson, C. (2009). The Health Status of Pacific <strong>Child</strong>ren and<br />
Young People in New Zealand. Dunedin: New Zealand <strong>Child</strong> and Youth Epidemiology<br />
Service, University of Otago, & Auckland UniServices Ltd.<br />
Craig, E., & et al. (2011). The <strong>Child</strong>rens Social Health Monitor, New Zealand. Infant Mortality: New<br />
Zealand <strong>Child</strong> & Youth Epidemiology Service.<br />
Craig, E., Jackson, C., Han, D., & NZCYES Steering Committee. (2007). Monitoring the Health of<br />
New Zealand <strong>Child</strong>ren and Young People: Indicator Handbook Auckland: Paediatric Society<br />
of New Zealand and the New Zealand <strong>Child</strong> and Youth Epidemiology Service.<br />
Craig, E., McDonald, G., Wicken, A., Reddington, A., & Taufa, S. (2010). The Determinants of Health<br />
for Pacific <strong>Child</strong>ren and Young People in New Zealand. Dunedin: New Zealand <strong>Child</strong> and<br />
Youth Epidemiology Service, University of Otago, and the Ministry of Health.<br />
Craig, E., Taufa, S., Jackson, C., & Han, D. Y. (2008). The Health of Pacific <strong>Child</strong>ren and Young<br />
People in New Zealand. Auckland: Paediatric Society New Zealand, University of Auckland/<br />
Uniservices.<br />
Cutler, D., & Richardson, E. (1998). The value of health: 1970–1990. American Economic Review,<br />
88, 97-100.<br />
Dahl, G., & Lochner, L. (2006). The Impact of Family Income on <strong>Child</strong> Achievement. Working Paper.<br />
Cambridge, MA: National Bureau of Economic Research.<br />
Dale, M. C., Wynd, D., St John, S., & O’Brien, M. (2010). What Work Counts? Work incentives and<br />
sole parent families. Auckland: <strong>Child</strong> <strong>Poverty</strong> <strong>Action</strong> <strong>Group</strong>.<br />
Dalgety, J. (2010a). Changing Families’ Financial Support and Incentives for Working Annex, Report<br />
2. Employment incentives for couple parents: Labour market effects of changes to financial<br />
incentives and support. Wellington: MSD and IRD.<br />
Dalgety, J. (2010b). Changing Families’ Financial Support and Incentives for Working. The summary<br />
report of the evaluation of the Working for Families package. Wellington: MSD and IRD.<br />
Dalgety, J., Dorsett, R., Johnston, S., & Spier, P. (2010). Employment incentives for sole parents:<br />
Labour market effects of changes to financial incentives and support. Technical report.<br />
Wellington: Inland revenue Department, Ministry of Social Development.<br />
Darling-Hammond, L. (1994). Who will speak for the children? Phi Delta Kappan, 76(1), 21.<br />
Darling-Hammond, L., Holtzman, D. J., Gatlin, S. J., & Heilig, J. V. (2005). Does teacher preparation<br />
matter? Evidence about teacher certification, Teach for America, and teacher effectiveness.<br />
Paper presented at the American Educational Research Association Conference.<br />
de Bres, J. (2010). Recession hammers youth employment. NewsTalkZB. Retrieved from http://www.<br />
newstalkzb.co.nz/newsdetail1.asp?storyID=170952<br />
218
Delamere, J. P. (2011). New Zealand Government declares best interests of children ‘not a<br />
consideration’. NZLawyer Online.<br />
Delpit, L. (2006). Lessons from teachers. Journal of Teacher Education, 57(3), 220-231.<br />
Department of Building and Housing. (2005). Statement of Intent 2005/2008. Wellington: Ministry of<br />
Housing.<br />
Department of Building and Housing. (2010). New Zealand Housing Report 2009/10: Structure<br />
Pressure and Issues. Wellington: Ministry of Housing.<br />
Department of Internal Affairs. (2010). Gambling expenditure statistics 2010. Wellington: Department<br />
of Internal Affairs.<br />
Department of Labour. (2010). The impact of the recession on young people. Household Labour<br />
Force Survey Investigation Report. Retrieved from http://dol.govt.nz/publications/lmr/hlfsinvestigation-reports/recession-impact/index.asp<br />
Department of Labour. (2011a). How have Maori and Pacific people been affected by the recession?<br />
Retrieved from http://www.dol.govt.nz/publications/lmr/hlfs-investigation-reports/maoripacific-been-affected-recession/index.asp<br />
Department of Labour. (2011b). Youth Labour market Fact Sheet – March 2011. Household Labour<br />
Force Survey. Retrieved from http://www.dol.govt.nz/publications/lmr/quick-facts/youth.asp<br />
Department of Social Welfare. (1994). Te Punga: Our Bicultural Strategy for the Nineties. Wellington:<br />
Department of Social Welfare.<br />
DeVol, R., & Bedroussian, A. (2007). An Unhealthy America: The Economic Burden of Chronic<br />
Disease. Santa Monica: Milken Institute.<br />
Dixon, R., Widdowson, D., Meagher-Lundberg, P., McMurchy-Pilkington, A., & McMurchy-Pilkington,<br />
C. (2007). Evaluation of Promoting Early <strong>Child</strong>hood Education (ECE) Participation Project.<br />
Report to the Ministry of Education. Wellington: Ministry of Education.<br />
Dowling, N. A., Jackson, A. C., Thomas, S., A,, & Frydenberg, E. (2010). <strong>Child</strong>ren at risk of developing<br />
problem gambling. Melbourne: Gambling Research Australia, a joint initiative of the University<br />
of Melbourne, Monash University & the Victorian Government.<br />
Drucker, P. (1997). The Consequences of <strong>Poverty</strong> and <strong>Child</strong> Maltreatment on IQ Scores Paper<br />
presented at the Vincentian Center Faculty Colloquium, 9 October 1997. Retrieved from<br />
http://www.vincenter.org/97/drucker.html<br />
Dube, S. R., Felitti, V. J., Giles, W. H., & Anda, R. F. (2003). The impact of adverse childhood<br />
experiences on health problems: evidence from four birth cohorts dating back to 1900.<br />
Preventive Medicine, 37(3), 268-277.<br />
Duncan, G., Wei-Jun Yeung, W., Brooks-Gunn, J., & Smith, J. (1998). How Much Does <strong>Child</strong>hood<br />
<strong>Poverty</strong> Affect the Life Chances of <strong>Child</strong>ren? American Sociological Review(63), 406-423.<br />
Duncan, G., Ziol-Guest, K., & Kalil, A. (2010). Early-<strong>Child</strong>hood <strong>Poverty</strong> and Adult Attainment,<br />
Behavior, and Health. <strong>Child</strong> Development, 81(1), 306-325.<br />
219
Dunne, P. (2010). Supporting children. A Government discussion document on updating the child<br />
support scheme. Retrieved from http://taxpolicy.ird.govt.nz/sites/default/files/2010-ddsupporting-children-full.pdf<br />
Dunne, P. (2011a). Address to the International Fiscal Association Conference, Minister of Revenue<br />
11th March Holiday Inn Wellington.<br />
Dunne, P. (2011b). Breakfast Address to Chapman Tripp’s 2011 Policy Series for Party Leaders.<br />
Auckland: ANZ Centre, Auckland, 15 June.<br />
Dunne, P. (2011c). Dunne unveils key <strong>Child</strong> Support review submission themes. Press Release, 21<br />
February.<br />
Durie, M. (2001). Mauri Ora: the Dynamics of Maori Health: Oxford University press.<br />
Durie, M. (2003). Te Pae Mahutonga. A Navigational Guide for Promotion of Secure Identity and<br />
Best Outcomes for Māori <strong>Child</strong>ren. Keynote Presentation. Paper presented at the 8th Early<br />
<strong>Child</strong>hood Convention, Palmerston North.<br />
Durie, M. (2005). Nga Tai Matatu – Tides of Maori Endurance. Melbourne: Oxford University Press.<br />
ECE Taskforce Secretariat. (2010). Overview of the New Zealand Early <strong>Child</strong>hood Education (ECE)<br />
System. Introductory Briefing. Retrieved from http://www.taskforce.ece.govt.nz/wp-content/<br />
uploads/2010/11/1-Overview-of-the-NZ-Early-<strong>Child</strong>hood-Education-System.pdf<br />
Education Counts. (2011). Progress against Māori Education Plan targets – Ka Hikitia – Managing<br />
for Success: The Māori Education Strategy 2008-2012. Wellington: Ministry of Education.<br />
Edwards, E. A., Asher, M. I., & Byrnes, C. A. (2003). Paediatric bronchiectasis in the twenty-first<br />
century: Experience of a tertiary children’s hospital in New Zealand. [Article]. Journal of<br />
Paediatrics and <strong>Child</strong> Health, 39(2), 111-117.<br />
Elliot, D., & Ageton, S. (1980). Reconciling Race and Class Differences in Self Reported and Official<br />
Estimates of Delinquency. American Sociological Review, 45, 95-100.<br />
Else, A. (1997). Maori Participation & Performance in Education. A Literature Review and Research<br />
Programme: Ministry of Education.<br />
Enright, J., & Scobie, G. E. (2010). Healthy, Wealthy and Working: Retirement Decisions of Older<br />
New Zealanders. Wellington: The Treasury, New Zealand.<br />
Environmental Protection Agency. (1993). Fact Sheet: Respiratory Health Effects of Passive<br />
Smoking. Washington: Environmental Protection Agency. EPA Document Number 43-F-93-<br />
003, January 1993.<br />
Espiner, G. (Writer). (2010). A one-stop shop for social services?<br />
Esping-Andersen, G. w. G., Duncan, Hemerijck, Anton, Myles, John). (2002). Why We Need a New<br />
Welfare State. Oxford: Oxford University Press.<br />
Evans, S. (2005). Beyond gender: class, poverty and domestic violence. Australian Social Work,<br />
58(1), 36-43.<br />
220
Families Commission. (2009). What separating parents need when making care arrangements for<br />
their children. Wellington Families Commission.<br />
Families Commission. (2010a). Paid Parental Leave: Issues for Today’s Economic Times. Wellington.<br />
Families Commission. (2010b). Put the children first in child support scheme. Media release.<br />
Retrieved from http://www.familiescommission.govt.nz/news-events/child-support/put-thechildren-first-in-child-support-scheme<br />
Fancourt, N., Turner, N., Asher, M. I., & Dowell, T. (2010). Primary health care funding for children<br />
under six years of age in New Zealand: why is this so hard? J Prim Health Care, 2(4), 338-<br />
342.<br />
Fergusson, D., John Horwood, J., Ridder, E., & Grant, H. (2005). Early Start Evaluation Report.<br />
Wellington: Ministry of Social Development.<br />
Fergusson, D., Swain-Campbell, N., & Horwood, L. J. (2004). How does childhood economic<br />
disadvantage lead to crime. Journal of <strong>Child</strong> Psychology & Psychiatry, 45.5, 956-966.<br />
Fergusson, D. M., Boden, J. M., & Horwood, L. J. (2008). Exposure to childhood sexual and physical<br />
abuse and adjustment in early adulthood. [Editorial Material]. <strong>Child</strong> Abuse & Neglect, 32(6),<br />
607-619.<br />
Fletcher, M., & Dwyer, M. (2008). A fair go for all children. <strong>Action</strong>s to address child poverty in New<br />
Zealand. A report for the <strong>Child</strong>ren’s Commissioner and Barnardos. Wellington: Office of the<br />
<strong>Child</strong>ren’s Commissioner.<br />
Flory, K., Lynam, D., Milich, R., Leukefeld, C., & Clayton, R. (2004). Early adolescent through young<br />
adult alcohol and marijuana use trajectories: Early predictors, young adult outcomes, and<br />
predictive utility. Development and Psychopathology, 16(01), 193-213.<br />
Forrest, C. B., Simpson, L., & Clancy, C. (1997). <strong>Child</strong> health services research. Challenges and<br />
opportunities. Journal of the American Medical Association, 277(22), 1787-1793.<br />
Frederick, J., & Goddard, C. (2007). Exploring the Relationship Between <strong>Poverty</strong>, <strong>Child</strong>hood Adversity<br />
and <strong>Child</strong> Abuse from the Perspective of Adulthood <strong>Child</strong> Abuse Review, 16, 363-341.<br />
Gambling Watch. (2011). Fact Sheet: Know the facts before you spin: The New Zealand Coalition<br />
for Gambling.<br />
Gelles, R. J. (1992). <strong>Poverty</strong> and Violence Towards <strong>Child</strong>ren. American Behavioural Scientist, 35(1),<br />
258-274.<br />
Gilbert, R., Spatz Widom, C., Browne, K., Fergusson, D., Webb, E., & Janson, J. (2009). Burden<br />
and consequences of child maltreatment in high-income countries. The Lancet, 373, 68-81.<br />
Gillborn, D., & Youdell, D. (2000). Rationing Education: Policy, Practice, Reform, and Equity.<br />
Buckingham: Open University Press.<br />
Gluckman, P., & Hayne, H. (2011). Improving the Transition: Reducing Social and Psychological<br />
Morbidity During Adolescence. A report from the Prime Minister’s Chief Science Advisor.<br />
Wellington: Office of the Prime Minister’s Science Advisory Committee.<br />
221
Goff, P. (2010). Labour will remove GST from fresh fruit and veges Retrieved from http://www.labour.<br />
org.nz/node/2656<br />
Government of Australia. (2009). Australia’s Paid Parental Leave Scheme: Supporting Working<br />
Australian Families. Retrieved from http://www.facs.gov.au/sa/families/progserv/paid_<br />
parental/parental_leave/Pages/AustraliasPaidParentalLeaveScheme.aspx<br />
Government of Australia. (2010a). Family Assistance: Paid Parental Leave Scheme. Retrieved from<br />
http://www.familyassist.gov.au/payments/family-assistance-payments/paid-parental-leavescheme/<br />
Government of Australia. (2010b). Paid Parental Leave at a glance. Paid Parental Leave –<br />
Information for employers and consultation outcomes, from http://www.familyassist.gov.au/<br />
publications/paid-parental-leave---information-for-employers-and-consultation-outcomes/a.-<br />
paid-parental-leave-at-a-glance.php<br />
Graham-Berman, S. A., & Seng, J. (2005). Violence exposure and traumatic stress symptoms as<br />
additional predictors of health problems in high-risk children. Journal of Pediatrics, 146(3),<br />
349-354.<br />
Grant, C. (2001). Ethnic comparisons of disease severity in children hospitalized with pneumonia in<br />
New Zealand. Journal of Paediatrics and <strong>Child</strong> Health, 37(1), 32-37.<br />
Griffiths, M., Wardle, H., Orford, J., Sproston, K., & Erens, B. (2009). Internet gambling, health,<br />
smoking and alcohol use: Findings from the 2007 British Gambling Prevalence Survey.<br />
International Journal of Mental Health and Addiction, 9(1), 1-11.<br />
Grimmond, D. (2011). 1000 days to get it right for every child. The effectiveness of public investment<br />
in New Zealand children. Wellington: A report prepared by Infometrics for Every <strong>Child</strong> Counts.<br />
Haas, S. (2007). The long term effects of poor childhood health: An assessment and application of<br />
retrospective reports. Demography 44(1), 113-135.<br />
Hancock, J., & Walters, V. (2009). Seen but not yet heard. NZLawyer Online(125).<br />
Hargreaves, B. (2011). March 2011 Quarterly Survey. New Zealand Residential Rental Market, 14(1).<br />
Hawk, K., Cowley, E. T., Hill, J., & Sutherland, S. (2002). The importance of the teacher/student<br />
relationship for Maori and Pasifika students. set(3).<br />
Hay, G. C., Whigham, P. A., Kypri, K., & Langley, J. D. (2009). Neighbourhood deprivation and access<br />
to alcohol outlets: A national study. Health and Place, 15<br />
He Oranga Pounamu. (2006). Submission to Christchurch City Council proposed change of gambling<br />
venue policy. Christchurch: He Oranga Pounamu.<br />
Heckman, J., & Masterov, D. (2007). The Productivity Argument for Investing in Young <strong>Child</strong>ren.<br />
Cambridge, MA: National Bureau of Economic Research, Inc.<br />
Helu, S. L., Robinson, E., Grant, S., Herd, R., & Denny, S. (2009). Youth ’07 The Health and wellbeing<br />
of secondary school students in New Zealand: Results for Pacific young people.<br />
Auckland: The University of Auckland.<br />
222
Henderson, J. (1963). Ratana: The Man, The Church, the Political Movement, The Polynesian Society.<br />
In M. Durie (Ed.), Te Mana Te Kawanatanga – the politics of Māori Self Determination, 2004:<br />
Oxford University Press.<br />
Herman, K. M., Craig, C. L., Gauvin, L., & Katzmarzyk, P. T. (2009). Tracking of obesity and physical<br />
activity from childhood to adulthood: the Physical Activity Longitudinal Study. Int J Pediatr<br />
Obes, 4(4), 281-288.<br />
Hertzman, C., Siddiqi, A., Hertzman, E., Irwin, L. G., Vaghri, Z., Houweling, T., et al. (2010). Bucking<br />
the inequality gradient through early child development. British Medical Journal, 340.<br />
Hickey, B. (2011). Stop slide into poverty. Herald on Sunday(April 3rd ).<br />
Hickling, J., Miller, C., & Hosking, J. (2009). Australia’s First Smoke-Free Car Laws—What’s the<br />
Impact? Darwin, Australia: Oceania Tobacco Control Conference.<br />
Higgins, J., & Nairn, K. (2006). ‘In transition’: Choice and the children of New Zealand’s economic<br />
reforms. British Journal of Sociology of Education, 27(2), 207-220.<br />
Higgins, J., Nairn, K., & Sligo, J. (2010). Vocational imagination and labour market literacy: young<br />
New Zealanders making education-employment linkages. Journal of Vocational Education<br />
and Training, 62(1), 13-25.<br />
Hill, R. (2004). State Authority, Indigenous Autonomy: Crown-Maori Relations in New Zealand/<br />
Aotearoa 1900-1950. Wellington: Victoria University Press.<br />
Hindelang, M. J., Hirschi, T., & Weis, J. G. (1981). Measuring delinquency. Beverly Hills: Sage<br />
Publications.<br />
Hodgson, P. (2007, 27 August). More support for free doc visits for under-6s. Retrieved 26 May,<br />
2010, from http://www.beehive.govt.nz/node/30431<br />
Holt, H. (2010). The cost of ill health: New Zealand Treasury Working Paper Series 10-14.<br />
Holzer, H., Schanzenbach, D., Duncan, G., & Ludwig, J. (2007). The economic costs of poverty in<br />
the United States: Subsequent effects of children growing up poor. Washington DC: Center<br />
for American Progress.<br />
Hopgood, T., Asher, M. I., Wall, C. R., Grant, C. C., Stewart, J., Muimuiheata, S., et al. (2010).<br />
Crunching the numbers: The affordability of nutritious food for New Zealand children Nutrition<br />
& Dietetics, 67, 251–257.<br />
Hornibrook, C. (2008). Parental control and the child’s right not to be hit. University of Otago, Dunedin.<br />
Howden-Chapman, P., Matheson, A., Crane, J., Viggers, H., Cunningham, M., Blakely, T., et al.<br />
(2007). Effect of insulating existing houses on health inequality: cluster randomised study in<br />
the community. BMJ, 334(7591), 460.<br />
Howden-Chapman, P., Pierse, N., Nicholls, S., Gillespie-Bennett, J., Viggers, H., Cunningham, M.,<br />
et al. (2008). Effects of improved home heating on asthma in community dwelling children:<br />
randomised controlled trial. BMJ, 337, a1411.<br />
223
Huang, C., & Elliffe, C. (2011). Busting the myths of a capital gains tax. 12th January 2011. Retrieved<br />
from http://www.nzherald.co.nz/business/news/article.cfm?c_id=3&objectid=10699125<br />
Human Rights Commission. (2010a). Annual report of activities under the Optional Protocol to<br />
the Convention Against Torture 1 July 2009 to 30 June 2010. Auckland: Human Rights<br />
Commission.<br />
Human Rights Commission. (2010b). Human Rights in New Zealand 2010 – Summary. Auckland:<br />
Human Rights Commission.<br />
Human Rights Commission. (2010c). New Zealand Census of Women’s Participation 2010. Auckland:<br />
Human Rights Commission.<br />
Human Rights Tribunal. (2008). <strong>Child</strong> <strong>Poverty</strong> <strong>Action</strong> <strong>Group</strong> Inc v Attorney General. The Decision.<br />
Wellington: Human Rights Review Tribunal<br />
Hursh, D. (2008). High-Stakes Testing and the Decline of Teaching and Learning. New York: Rowman<br />
& Littlefield.<br />
Hvinden, B., & Johansson, H. (Eds.). (2007). Citizenship in Nordic Welfare States. Abingdon:<br />
Routledge.<br />
Hyslop, D., & Stillman, S. (2007). Youth Minimum Wage Reform and the Labour Market. Labour<br />
Economics, 14(2), 201-230.<br />
Immervoll, H., & Pearson, M. (2009). A good time for making work pay? Taking stock of in-work<br />
benefits and related measures across the OECD (No. 81): Organisation for Economic Cooperation<br />
and Development.<br />
Infometrics. (2010). ECC Discussion Paper 1. The nature of economic costs from child abuse and<br />
neglect in New Zealand. Wellington: Every <strong>Child</strong> Counts.<br />
Inland Revenue Department. (2011). Student loan quarterly report 2010-2011: First quarter – July –<br />
September 2010. Wellington: Inland Revenue Department, Te Tari Taake.<br />
Interest.co.nz. (2011, 8 March). Key’s 10,000 house claim queried. New Zealand Herald. Retrieved<br />
from http://www.nzherald.co.nz/business/news/article.cfm?c_id=3&objectid=10710941<br />
Isaac, A. G. (2007). Inheriting inequality: institutional influences on the distribution of wealth. Journal<br />
of Post Keynesian Economics, 30(2), 187-203.<br />
Jackson, G., Thornley, S., Woolston, J., Papa, D., Bernacchi, A., & Moore, T. (2011a). Reduced<br />
acute hospitalisation with the healthy housing programme. Journal of Epidemiology and<br />
Community Health, 65, 588-593.<br />
Jackson, G., Thornley, S., Woolston, J., Papa, D., Bernacchi, A., & Moore, T. (2011b). Reduced acute<br />
hospitalisation with the healthy housing programme. J Epidemiol Community Health.<br />
Jackson, N. (2011). The demographic forces shaping New Zealand’s future. What population ageing<br />
[really] means. Waikato: The University of Waikato: National Institute of Demographic and<br />
Economic Analysis.<br />
224
Jaine, R., Baker, M., & Venugopal, K. (2011). Acute rheumatic fever associated with household<br />
crowding in a developed country. Pediatric Infectious Diseases Journal, 30(4), 315-319.<br />
James, & Saville-Smith. (2010). <strong>Child</strong>ren’s Housing Futures: Centre for Housing Research Aotearoa<br />
New Zealand.<br />
James, O. (2002). They F*** You Up: Bloomsbury.<br />
Jelleyman, T., & Spencer, N. (2008). Residential mobility in childhood and health outcomes: a<br />
systematic review. Journal of Epidemiology and Community Health, 62(7), 584-592.<br />
Jencks, C., & Tach, L. (2006). Would Equal Opportunity Mean More Mobility? In S. Morgan, D.<br />
Grusky & G. Field (Eds.), Mobility and Inequality: Frontiers of Research from Sociology and<br />
Economics. Stanford, CA: Stanford University Press.<br />
Jensen, J., Sathiyandra, S., & Matangi-Want, M. (2007). The 2004 New Zealand Living Standards<br />
Survey: What Does it Signal about the Importance of Multiple Disadvantage? Social Policy<br />
Journal of New Zealand(30), 110-144.<br />
Jeynes, W. H. (2007). The relationship between parental involvement and urban secondary school<br />
student academic achievement. A meta-analysis. Urban Education, 42(1), 82-110.<br />
Joenje, H. (2011). Metabolism: Alcohol, DNA and disease. Nature 465, 45-46.<br />
Johnson, A. (2011a). Stalled. A State of The Nation Report From The Salvation Army. Manukau City:<br />
Salvation Army Social Policy and Parliamentary Unit.<br />
Johnson, A. (2011b). Stalled: A State of the Nation Report from the Salvation Army. Manukau: The<br />
Salvation Army Social Policy and Parliamentary Unit.<br />
Johnston, M. (2011). Tobacco Sales Drop 10pc After Tax Rise. New Zealand Herald. Wednesday July 20,<br />
2011. Available http://www.nzherald.co.nz/nz/news/article.cfm?c_id=1&objectid=10723986.<br />
Joyce, D. (2010a, 3 December). Dad’s return ends family’s misery. Dominion Post. Retrieved from<br />
http://www.stuff.co.nz/national/4418076/Dads-return-ends-familys-misery<br />
Joyce, D. (2010b, 1 October). Kiwi-born children face deportation. Dominion Post. Retrieved from<br />
http://www.stuff.co.nz/national/4186113/Kiwi-born-children-face-deportation<br />
Joyce, S., & Dunne, P. (2011). Budget 2011. Student loans – better value for taxpayers. Wellington:<br />
New Zealand Government.<br />
Joychild, F. (2010). Report to the Minister for Social Services – Review of Department of Work and<br />
Income Implementation of the Court of Appeal decision Ruka v Department of Social Welfare<br />
Auckland: Ministry of Social Development and Employment.<br />
Justice Susan Glazebrook. (2010). Looking Through the Glass: Gender Inequality at the Senior<br />
Levels of New Zealand’s Legal Profession. Paper presented at the Chapman Tripp Women<br />
in Law Event, 16 September 2010.<br />
Kammerman, S. (2000). Early childhood intervention policies: an international perspective. In J.<br />
Shankoff, Meisels, F. (Ed.), Handbook of early childhood intervention (2nd ed.). Cambridge:<br />
Cambridge University Press.<br />
225
Kane, R. G. (2005). Initial teacher education. Policy and practice. Wellington: Ministry of Education.<br />
Karoly, L. A., Kilburn, M. R., & al., e. (2005). Early <strong>Child</strong>hood Interventions: Proven Results, Future<br />
Promise. Santa Monica, CA: Rand.<br />
Kendall-Tackett, K. (2002). The health effects of childhood abuse: four pathways by which abuse can<br />
influence health. [Article]. <strong>Child</strong> Abuse & Neglect, 26(6-7), 715-729.<br />
Knudsen, E. I., Heckman, J. J., & al., e. (2006). Economic, neurobiological and behavioural<br />
perspectives on building America’s future workforce. Proceedings of the National Academy<br />
of Sciences of the United States of America, 103(27), 10155-10162.<br />
Krugman, P. (2011, 6 March 2011). Degrees and Dollars. New York Times. Retrieved from http://<br />
www.nytimes.com/2011/03/07/opinion/07krugman.html?_r=2<br />
Kuh, D., & Wadsworth, M. E. J. (2003). Physical Health Status at 36 Years in a British National Birth<br />
Cohort. Social Science and Medicine, 37, 905-916.<br />
Labaree, D. (2010). Teach for America and teacher ed: heads they win, tails we lose.”. Journal of<br />
Teacher Education, 61, 1-2.<br />
Laugesen, R. (2009). After the giants. Is Phil Goff’s Labour Party strong enough to emerge from<br />
Helen Clark’s long shadow. New Zealand listener, August 8, 2009 (3613 ).<br />
LaVeist, T., Gaskin, D., & Richard, P. (2009). The economic burden of health inequalities in the U.S.<br />
Washington DC: Joint Center for Political and Economic Studies.<br />
Leask, A. (2011, 11 June). Gamblers abandon children in casinos. New Zealand Herald. Retrieved<br />
from http://www.nzherald.co.nz/nz/news/article.cfm?c_id=1&objectid=10731575<br />
Lee, A. (2002). Transient <strong>Child</strong>ren – Perceptions of how often transient children come and go: New<br />
Zealand INstitute of Economic Research (NZIER).<br />
Lee, B., & Goerge. (2009). <strong>Poverty</strong>, early childbearing and child maltreatment: a multinomial analysis.<br />
<strong>Child</strong>ren and Youth Services Review, 21(9-10), 755-780.<br />
Lee, M. (2010). Monitoring Teacher Supply Survey of staffing in New Zealand schools at the beginning<br />
of the 2010 school year. Wellington: Ministry of Education.<br />
Leland, C. H., & Harste, J. C. (2005). Doing what we want to become. Preparing new urban teachers.<br />
Urban Education, 40(1), 60-77.<br />
Levitt, S. (1997). Using Electoral Cycles in Police Hiring to Estimate the Effect of Police on Crime.<br />
American Economic Review, 87(3), 270-290.<br />
Lindsay, G., & Percival, T. (2011). From Typhoid to Tsunamis: Samoan <strong>Child</strong>ren in a Changing World.<br />
International Journal of Public Health, 2(4), 447-458.<br />
Lister, R. (2010). The 2010 Samell Oration. Towards the inclusive society: Brotherhood of St Laurence<br />
Melbourne<br />
Lochner, L., & Moretti, E. (2004). The effect of education on crime: evidence from prison inmates,<br />
arrests, and self-reports. American Economic Review, 94(1), 155-189.<br />
226
Lotu-Iiga, S. (2011). Peseta Sam Lotu-Iiga launches Moneylenders (Licensing and Regulation) Bill<br />
2011. Wellington: National Party, New Zealand Government.<br />
Lubienski, C. (2008). School choice research in the United States and why it doesn’t matter: the<br />
evolving economy of knowledge production in a contested policy domain. In M. Forsey,<br />
G. Walford & S. Davies (Eds.), The Globalization of School Choice? (pp. 27-54). Oxford:<br />
Symposium Books.<br />
Ludbrook, R. (2010). Kids Missing Out – New Zealand’s Slow Progress on UNCROC. Third Edition.<br />
Auckland: <strong>Action</strong> for <strong>Child</strong>ren and Youth Aotearoa Incorporated.<br />
Macfarlane, A., Glynn, T., Cavanagh, T., & Bateman, S. (2007). Creating culturally-safe schools for<br />
Maori students. The Australian Journal of Indigenous Education, 36, 65-76.<br />
Magnuson, K., & Votruba-Drzal, E. (2009). Enduring influences of childhood poverty. Focus, 26(2).<br />
Maori Affairs Select Committee. (2010). Inquiry into the Tobacco Industry in Aotearoa and the<br />
Consequences of Tobacco Use for Māori: Report of the Māori Affairs Committee. Wellington:<br />
New Zealand House of Representatives, Maori Affairs Select COmmittee.<br />
Mason, D. A., & Frick, P. J. (1994). The heritability of antisocial behavior: A meta-analysis of twin and<br />
adoption studies. Journal of Psychopathology and Behavioural Assessment, 16, 301-322.<br />
Mason, N., & Hanna, K. (2009). Undertaking <strong>Child</strong> Impact Assessments in Aotearoa New Zealand<br />
Local Authorities: Evidence, practice, ideas. Auckland: Institute of Public Policy, Auckland<br />
University of Technology.<br />
May, H., & Mitchell, L. (2009). Strengthening community-based early childhood education in Aotearoa.<br />
Report of the quality public early childhood education project. Wellington: NZEI Te Riu Roa.<br />
May, P. A., & Gossage, J. P. (2001). Estimating the Prevalence of Fetal Alcohol Syndrome. Wellington:<br />
National Institute on Alcohol Abuse and Alcoholism.<br />
Mayer, S. (1997). What Money Can’t Buy: Family Income and <strong>Child</strong>ren’s Life Chances. Cambridge<br />
MA: Harvard University Press.<br />
McCloskey, D. N., & Ziliak, S. T. (2008). The Cult of Statistical Significance: How the Standard Error<br />
Costs Us Jobs, Justice, and Lives Chicago: University of Michigan Press.<br />
McClure, M. (1998). A civilised community: a history of Social Security in New Zealand 1898-1998.<br />
Auckland: Auckland University Press.<br />
McCrone, J. (2011). Jobs fault line: the social time bomb. Odds stacked against young jobseekers.<br />
Christchurch Press. Retrieved from http://www.stuff.co.nz/the-press/lifestyle/4649650/Jobsfault-line-the-social-time-bomb<br />
McGregor, J. (2011). Standing on the precipice- how to rekindle new thinking about equality, diversity<br />
and inclusion. Paper presented at the 4th International Equality, Diversity and Inclusion<br />
Conference, Auckland University of Technology Retrieved from http://www.hrc.co.nz/newsand-issues/women/standing-on-the-precipice-how-to-rekindle-new-thinking-about-equalitydiversity-and-inclusion/<br />
227
McGregor, J. A. (2010). What next? The National Conversation about Work. Wellington: Human<br />
Rights Commission.<br />
Meredith, P. (2000). Urban Maori as New Citizens: The Quest for Recognition and Resources Paper<br />
presented at the Revisioning Citizenship in New Zealand.<br />
Miles, D. R., & Carey, G. (1997). Genetic and environmental architecture of human aggression.<br />
Journal of Personality and Social Psychology, 72, 207-217.<br />
Minister of Finance. (2011). Budget Economic and Fiscal Update. Retrieved from http://www.treasury.<br />
govt.nz/budget/forecasts/befu2011.<br />
Ministerial Advisory Committee on a Māori Perspective for the Department of Social Welfare. (1988).<br />
Pūao-te-ata-tū (daybreak). Wellington: Department of Social Welfare.<br />
Ministry of Education. (2002). Pathways to the Future: Ngä Huarahi Arataki. A 10-Year Strategic Plan<br />
for Early <strong>Child</strong>hood Education Wellington: Ministry of Education.<br />
Ministry of Education. (2010). ECE Taskforce. Our <strong>Child</strong>ren are Our Future. Retrieved from http://<br />
www.taskforce.ece.govt.nz/<br />
Ministry of Education. (2011a). Accelerating Learning. NZ Education Gazette(14 February).<br />
Ministry of Education. (2011b). Annual Report 2010. Wellington: Ministry of Education, New Zealand.<br />
Ministry of Education. (2011c). Increasing ECE centre size. Retrieved from http://www.lead.ece.govt.<br />
nz/GeneralInformation/InFocus/IncreasingECECentreSize.aspx<br />
Ministry of Health. (1998). Our children’s health: Key findings on the health of New Zealand children.<br />
Wellington: Ministry of Health.<br />
Ministry of Health. (2000). Changing Smoking in Pregnancy. Wellington: Ministry of Health. Available<br />
http://www.healthed.govt.nz/uploads/docs/HE1231.pdf.<br />
Ministry of Health. (2001a). The Burden of Disease and Injury in New Zealand.<br />
Ministry of Health. (2001b). The Primary Health Care Strategy. Wellington: Ministry of Health.<br />
Ministry of Health. (2002). New Zealand Youth Health Status Report. Wellington: Ministry of Health.<br />
Ministry of Health. (2002 ). Māori Health Strategy He Korowai Oranga. Wellington: Ministry of Health.<br />
Ministry of Health. (2004). The Health of New Zealand Total Population. Wellington: Ministry of Health.<br />
Ministry of Health. (2005a). The Health of Pacific Peoples. Wellington: Ministry of Health.<br />
Ministry of Health. (2005b). Implementing the New Zealand Health Strategy 2005.<br />
Ministry of Health. (2007). After hours service coverage and high fees: Report to the Minister of<br />
Health. Wellington: Ministry of Health.<br />
Ministry of Health. (2008). Pacific <strong>Child</strong> Health: A paper for the Pacific Health and Disability <strong>Action</strong><br />
Plan review. Wellington: Ministry of Health.<br />
Ministry of Health. (2009a). A Focus on Problem Gambling: Results of the 2006/07 New Zealand<br />
Health Survey. Wellington: Ministry of Health.<br />
228
Ministry of Health. (2009b). Oral Health, Data and Statistics. Retrieved from http://www.moh.govt.nz/<br />
moh.nsf/indexmh/oralhealth-statistics<br />
Ministry of Health. (2009c). Tobacco Trends 2008: A Brief Update of Tobacco Use in New Zealand.<br />
Wellington: Ministry of Health. Available http://www.moh.govt.nz/moh.nsf/indexmh/tobaccotrends-2008.<br />
Ministry of Health: Well <strong>Child</strong>. (1997). Food and Nutrition Guidelines for Healthy <strong>Child</strong>ren Aged 2–12<br />
Years: A Background Paper. Wellington: Ministry of Health.<br />
Ministry of Social Development. (2002). New Zealand’s agenda for children. Wellington: Ministry of<br />
Social Development.<br />
Ministry of Social Development. (2004a). Future Directions: Working for Families impacts Wellington:<br />
The Working for Families cabinet papers.<br />
Ministry of Social Development. (2004b). The Social Report: University of Canterbury ‘Progress on<br />
health outcome targets – <strong>Child</strong> Abuse 1996/1998’ Wellington.<br />
Ministry of Social Development. (2006a). <strong>Child</strong>ren at increased risk of death from maltreatment and<br />
strategies for prevention. Wellington.<br />
Ministry of Social Development. (2006b). New Zealand Living Standards, 2004. Wellington: Ministry<br />
of Social Development.<br />
Ministry of Social Development. (2006c). Taskforce For <strong>Action</strong> on Violence Within Families. The First<br />
Report. Wellington: Ministry of Social Development.<br />
Ministry of Social Development. (2007). Household incomes in New Zealand: Trends in indicators of<br />
inequality and hardship 1982-2004 Wellington: Ministry of Social Development.<br />
Ministry of Social Development. (2009a). Report to the Minister for Social Development and<br />
Employment pursuant to S7(2)of the Crimes (Substituted section 59) Amendment Act.<br />
Wellington: Ministry of Social Development.<br />
Ministry of Social Development. (2009b). Review of New Zealand Police and <strong>Child</strong> Youth and Family<br />
Polices and Procedures relating to the Crimes (Substituted Section 59) Amendment Act<br />
2007. Wellington: Ministry of Social Development.<br />
Ministry of Social Development. (2010a). Regulatory Impact Statement: Future Focus Changes to<br />
the Welfare System. Wellington: Ministry of Social Development. Available http://www.msd.<br />
govt.nz/documents/about-msd-and-our-work/publications-resources/regulatory-impactstatements/ris-future-focus-changes-to-welfare.pdf.<br />
Ministry of Social Development. (2010b). The Social Report Te purongo orange tangata. Wellington:<br />
Ministry of Social Development.<br />
Ministry of Social Development. (2010c). Statistical Report 2009. Wellington: Ministry of Social<br />
Development.<br />
Ministry of Social Development. (2010d). Work and Income Strategies for working with Māori, Pacific<br />
Peoples and Youth. Wellington: Ministry of Social Development.<br />
229
Ministry of Social Development. (2011). The Statistical Report 2010. Wellington: Ministry of Social<br />
Development.<br />
Mitchell, L., Wylie, C., & Carr, M. (2008). Outcomes of Early <strong>Child</strong>hood Education: Literature Review.<br />
Wellington: Ministry of Education.<br />
Moloney, M. (2011). From Vision to Practice: <strong>Child</strong>ren at the centre or the periphery of practice in Early<br />
<strong>Child</strong>hood Care and Education settings. Paper presented at the “Future for <strong>Child</strong>ren” Early<br />
<strong>Child</strong>hood Policy National Forum 2011, 31st March. Retrieved from http://www.childforum.<br />
com/national-meeting-reports-proceedings/314-future-for-children-policy-forum-2011.<br />
html#ixzz1IniUa4WV<br />
Morris, P., Duncan, G., & Rodrigues, C. (2006). Does Money Really Matter? Estimating Impacts<br />
of Family Income on Young <strong>Child</strong>ren’s Achievement with Data from Random-Assignment<br />
Experiments. Working Paper. Evanston, IL: Northwestern University.<br />
Morton, S., & al, e. (2010). Growing up in New Zealand: A longitudinal study of New Zealand children<br />
and their families. Report 1: Before we are born. Auckland: University of Auckland.<br />
Mueller, S., Exeter, D., & Turner, N. (2010). Unpublished Data. Immunisation Advisory Centre,<br />
University of Auckland.<br />
Nabi, E., Weiley, V., Regan, S., Dempsey, J., Drehmer, J., Friebely, J., et al. (2011). Parents Smoking<br />
in Their Cars with <strong>Child</strong>ren. Boston, MA: Center for <strong>Child</strong> and Adolescent Health Policy,<br />
Massachusetts General Hospital.<br />
National Health Committee. (1998). The Social, Cultural and Economic Determinants of Health in<br />
New Zealand: <strong>Action</strong> to Improve Health. Wellington: National Advisory Committee on Health<br />
and Disability.<br />
National Society for the Prevention of Cruelty to <strong>Child</strong>ren. (2008). <strong>Poverty</strong> and <strong>Child</strong> Maltreatment.<br />
New Zealand Crime and Safety Survey (NZCASS). (2010). The New Zealand Crime and Safety<br />
Survey: 2009, Main Findings Report. Wellington: Ministry of Justice.<br />
New Zealand <strong>Child</strong> and Youth Epidemiology Service. (2008). The Health Status of <strong>Child</strong>ren and<br />
Young People in Counties Manukau.<br />
New Zealand <strong>Child</strong> and Youth Epidemiology Service. (2009). The <strong>Child</strong>ren’s Social Health Monitor.<br />
Dunedin: Department of Women’s and <strong>Child</strong>ren’s Health, Dunedin School of Medicine.<br />
New Zealand Council of Christian Social Services (NZCCSS). (2011). Vulnerability Report Issue 9,<br />
June 2011. Wellington: New Zealand Council of Christian Social Services<br />
New Zealand Herald. (2010, April 8). Whānau Ora: Turia to head welfare shake-up. New Zealand Herald.<br />
Retrieved from http://www.nzherald.co.nz/nz/news/article.cfm?c_id=1&objectid=10637069<br />
New Zealand Herald. (2011). Loan Sharks Best Tackled by Education. New Zealand Herald, Editorial,<br />
22 June. Retrieved from http://www.nzherald.co.nz/personal-finance/news/article.cfm?c_<br />
id=12&objectid=10733635<br />
New Zealand Medical Association. (2011). Health Equity Position Statement. New Zealand Medical<br />
Journal, 124(1330).<br />
230
New Zealand Police. (2010). Seventh review of Police activity following the enactment of the Crimes<br />
(Substituted Section 59) Amendment Act 2007. Wellington: New Zealand Police.<br />
Nguyen, M. (2009). The hidden addiction: Problem gambling amongst Southeast Asian-American<br />
youth. San Francisco: Alliant International University.<br />
Nicholls, S., & Berliner, D. (2007). Collateral Damage: how high-stakes testing corrupts America’s<br />
schools. Cambridge MA: Harvard Education Press.<br />
Novak, B. (2007). Ethnic Specific Health Needs Assessment for Pacific People in Counties Manukau.<br />
Manukau City: Counties Manukau District Health Board.<br />
NZ Department of Labour. (2008). Parental Leave and Carers Leave: International Provision and<br />
Research. Retrieved from http://www.dol.govt.nz/publications/research/parental-leaveinternational/parental-leave-international_01.asp<br />
NZLC. (2010). Royal Commission Report on Alcohol Reform. Alcohol In Our Lives: Curbing the<br />
Harm. Wellington: Royal Commission on Alcohol Reform, New Zealand Law Commission.<br />
NZPA. (2011a, 23 June). 5100 lose homes, 10,500 in limbo. New Zealand Herald. Retrieved from<br />
http://www.nzherald.co.nz/nz/news/article.cfm?c_id=1&objectid=10734010<br />
NZPA. (2011b, 10 January 2011). Calls for youth wage to be reinstated. New Zealand Herald. Retrieved<br />
from http://www.nzherald.co.nz/youth/news/article.cfm?c_id=107&objectid=10698817<br />
NZPA. (2011c). Text loans spark call for tighter laws. New Zealand Herald. Retrieved from http://<br />
www.nzherald.co.nz/nz/news/article.cfm?c_id=1&objectid=10733425<br />
NZQA. (2011). Annual report on NCEA and New zealand Scholarship Data and Statistics, 2010.<br />
Wellington: New Zealand Qualifications Authority.<br />
O’Brien, M., Bradford, S., Dalziel, P., Stephens, M., Walters, M., & Wicks, W. (2010a). Welfare Justice<br />
for All. Wellington: Caritas Aotearoa New Zealand.<br />
O’Brien, M., Bradford, S., Dalziel, P., Stephens, M., Walters, M., & Wicks, W. (2010b). Welfare Justice<br />
in New Zealand: What We Heard. Wellington: Caritas Aotearoa New Zealand.<br />
O’Sullivan, C. E., Baker, M. G., & Zhang, J. (2010). Increasing hospitalizations for serious skin<br />
infections in New Zealand children, 1990-2007. Epidemiology & Infections, 1-11.<br />
O’Toole. (2009). Ship of fools. London: faber and faber.<br />
O’Hallahan, J., McNicholas, A., Galloway, Y., O’Leary, E., & Roseveare, C. (2009). Delivering a<br />
safe and effective strain specific vaccine to control an epidemic of group B Meningococcal<br />
disease. New Zealand Journal Medical Journal (NZMJ), 122(1291), 48-59.<br />
OECD. (2007a). Babies and Bosses: Reconciling Work and Family Life – A synthesis of findings for<br />
OECD countries. Paris.<br />
OECD. (2007b). Economic Survey of New Zealand (Policy Brief). Paris: OECD.<br />
OECD. (2009a). Doing Better for <strong>Child</strong>ren: Organisation for Economic Co-operation and Development.<br />
OECD. (2009b). OECD Doing Better for <strong>Child</strong>ren. Country highlights: New Zealand.<br />
231
OECD. (2011a). Doing Better for Families. Paris: Organisation for Economic Co-operation and<br />
Development.<br />
OECD. (2011b). Doing better for families. Retrieved from http://www.oecd.org/document/49/0,3746,<br />
en_2649_37419_47654961_1_1_1_37419,00.html<br />
OECD. (2011c). Society at a glance 2011 – OECD social indicators Available from http://www.oecd.<br />
org/document/24/0,3343,en_2649_34637_2671576_1_1_1_1,00.html<br />
Office of the Attorney-General. (2010). Report of the Attorney-General on the Social Assistance<br />
(Future Focus) Bill. Wellington: New Zealand House of Representatives. Available http://<br />
www.parliament.nz/NR/rdonlyres/6B68F10A-4F92-4321-AB92-7DB9BFAFB034/131875/<br />
DBHOH_PAP_19574_AttorneyGeneralReportoftheunderthe.pdf.<br />
Office of the <strong>Child</strong>ren’s Commissioner. (2011). Submission on Alcohol Reform to Justice and Electoral<br />
Select Committee. Wellington: Office of the <strong>Child</strong>ren’s Commissioner.<br />
Office of the U.S. Sugeon General. (2005). U.S. Surgeon General Releases Advisory on Alcohol Use<br />
in Pregnancy. Retrieved from http://www.come-over.to/FAS/SurGenAdvisory.htm<br />
Organisation for Economic Cooperation and Development. (2011). Doing Better for Families. Paris:<br />
OECD.<br />
Parackal, S., Parackal, M., Harraway, J., & Ferguson, E. (2009). Opinions of Non-Pregnant New<br />
Zealand Women Aged 16-40 years about the safety of alcohol consumption during pregnancy.<br />
Dunedin: Department of Human Nutrition, University of Otago.<br />
Pearson, M., & Immervoll, H. (2008). Statement of evidence: CPAG v The Attorney General.<br />
Wellington: Crown Law.<br />
Perese, L. (2009). You Bet Your Life... and Mine! Contemporary Samoan Gambling in New Zealand.<br />
PhD Thesis, The University of Auckland. Available https://researchspace.auckland.ac.nz/<br />
handle/2292/4958, Auckland.<br />
Perry, B. (2009a). Household incomes in New Zealand: trends in indicators of inequality and hardship<br />
1982 to 2008. Wellington: Ministry of Social Development.<br />
Perry, B. (2009a). Household incomes in New Zealand: trends in indicators of inequality and hardship<br />
1982 to 2008. . Wellington: Ministry of Social Development.<br />
Perry, B. (2009b). Non-income measures of material wellbeing and hardship: first results from the<br />
2008 New Zealand Living Standards Survey, with international comparisons. Wellington:<br />
Ministry of Social Development.<br />
Perry, B. (2009b). Non-income measures of material wellbeing and hardship:first results from the<br />
2008 New Zealand Living Standards Survey, with international comparisons. Wellington:<br />
Ministry of Social Development.<br />
Perry, B. (2010). Household incomes in New Zealand: trends in indicators of inequality and hardship<br />
1982-2009 Wellington: Ministry of Social Development<br />
Perry, B. (2010). Household incomes in New Zealand: trends in indicators of inequality and hardship<br />
1982 to 2009. Wellington: Ministry of Social Development.<br />
232
Perry, B. (2011). Household Incomes in New Zealand: Trends in Indicators of Inequality and Hardship<br />
1982 to 2010. Wellington: Ministry of Social Development.<br />
PISA. (2009). Overcoming Social Background, Equity in Learning Opportunities and Outcomes.<br />
Volume 1 Programme for International Student Assessment, OECD.<br />
Poulton, R., Caspi, A., Milne, B. J., Thomson, W. M., Taylor, A., Sears, M. R., et al. (2002). Association<br />
between children’s experience of socioeconomic disadvantage and adult health: a life-course<br />
study. Lancet, 360(9346), 1640-1645.<br />
Power, C., Li, L., & Manor, O. (2000). A prospective study of limiting longstanding illness in early<br />
adulthood. International Journal of Epidemology, 29, 131-139.<br />
Power, S. (2011). Sir John Anderson to chair Financial Summit. Wellington: Ministry of Social<br />
Development.<br />
Price Waterhouse Coopers. (2009). Weathertightness – estimating the cost. Retrieved from http://<br />
www.dbh.govt.nz/UserFiles/File/News/WHRS/pdf/PWC-weathertightness-estimating-costfull-report.pdf.<br />
Public Health Advisory Committee. (2010a). The Best Start in Life: Achieving effective action on child<br />
health and wellbeing. Wellington: Ministry of Health.<br />
Public Health Advisory Committee. (2010b). The Best Start in Life: Achieving effective action on child<br />
health and wellbeing. A report to the Minister of Health. Wellington: Ministry of Health.<br />
Pulotu-Endemann, F. K. (2009). Fonofale Model of Health. Paper presented at the Health Promotion<br />
Forum: Pacific Health Models, 7 September. Retrieved from http://www.hpforum.org.<br />
nz.resources/Fonofalemodel.pdf<br />
Quilgars, D. (2001). <strong>Child</strong> Abuse. In J. Bradshaw (Ed.), <strong>Poverty</strong>: the outcomes for children. London:<br />
Family Policy Studies Centre.<br />
Reay, D., & William, D. (1999). ‘i’ll be a nothing’: Structure and agency and the construction of identity<br />
through assessment. British Educational Research Journal, 25(3), 343-354.<br />
Reilly, A. (2011). The right to work and rights at work. In M. Bedggood & K. Gledhill (Eds.), Law into<br />
<strong>Action</strong>. Economic, Social and Cultural Rights in Aotearoa New Zealand: The Law Foundation<br />
and the Human Rights Foundation.<br />
Retail Institute NZ. (2010). Literacy, Language, and Numeracy Awareness – How It Can Help<br />
Business: Retail Institute NZ.<br />
Retirement Policy and Research Centre. (2009). If I won $5 million: structuring investments to<br />
maximise after-tax income (Briefing Paper No. 2009-4). Auckland: University of Auckland.<br />
Rhee, S. H., & Waldman, I. (2002). Genetic and environmental influences on antisocial behavior: a<br />
meta-analysis of twin and adoption studies. Psychological Bulletin, 128, 490-529.<br />
Ridge, T., & Wright, S. (Eds.). (2008). Understanding Inequality, <strong>Poverty</strong> and Wealth: Policies and<br />
Prospects. Bristol: Policy Press.<br />
233
Ridgeway, C. L. (1997). Interaction and the Conservation of Gender Inequality. American Sociological<br />
Review, 62(2).<br />
Roper, T., & Thompson, A. (2006). Estimating the costs of crime in New Zealand in 2003/04.<br />
Rossen, F. (2008). Adolescent Gambling in New Zealand: An Exploration of Protective and Risk<br />
Factors. PhD Thesis, The University of Auckland, Auckland.<br />
Royal College of Physicians. (2010). RCP policy statement 2010. How doctors can close the gap:<br />
Tackling the social determinants of health through culture change, advocacy and education.<br />
London: Royal College of Physicians.<br />
Royal Commission on Social Security. (1972a). Report of the Commission to Inquire into Social<br />
Security in New Zealand. Wellington: Government Printer.<br />
Royal Commission on Social Security. (1972b). Report on Social Security in New Zealand. Wellington:<br />
Government Printer.<br />
Royal Commission to Inquire into and Report Upon Workers’ Compensation. (1967). Compensation<br />
for Personal Injury in New Zealand. Report of the Royal Commission of Inquiry. Wellington:<br />
Government Printer.<br />
Rudd, A. (2010, 9 June 2010). Varsity places to be limited. Otago Daily Times. Retrieved from http://<br />
www.odt.co.nz/campus/university-otago/109841/varsity-places-be-limited<br />
Rush, E., McLennan, S., Latimer, K., Graham, D., Gilmore, J., & Obolonkin, V. (2011). Project<br />
Energize: Moving in the right direction 2011.<br />
Russell, M., Harris, B., & A., G. (2008). Parenting in poverty: perspectives of high risk parents. Journal<br />
of <strong>Child</strong>ren and <strong>Poverty</strong>, 14(1), 83-98.<br />
Russell, M., Harris, B., & Gockel, A. (2008). Parenting in poverty: perspectives of high risk parents.<br />
Journal of <strong>Child</strong>ren and <strong>Poverty</strong>, 14(1), 83-98.<br />
Salmond, C., Crampton, P., & Atkinson, J. (2007). NZDEP2006 Index of Deprivation. Wellington:<br />
Department of Public Health, University of Otago.<br />
Salmond, C., Crampton, P., & Atkinson, J. (2007). NZDep2006 Index of Deprivation (August 2007).<br />
Wellington: Department of Public Health, University of Otago.<br />
Sampson, P., Streissguth, S., Bookstein, F., Clarren, S., Dehaene, P., Little, R., et al. (1997). Incidence<br />
of Fetal Alcohol Syndrome and Prevalence of Alcohol Related Neurodevelopmental Disorder.<br />
Teratology 56(5), 317-326.<br />
Schulenberg, J. e., Sameroff, A. J., & Cicchetti, D. (2004). The transition to adulthood as a<br />
critical juncture in the course of psychopathology and mental health. Development and<br />
Psychopathology, 16(04), 799-806.<br />
Schweinhart, L. J. (2006). Outcomes of the High/Scope Perry Preschool Study and Michigan School<br />
Readiness Program: World Bank Organisation.<br />
Sellman, D. (2011). 22 June 2011. Open letter to the Prime Minister John Key: National alcohol crisis<br />
exemplified by recent events at King’s College. Christchurch: Alcohol <strong>Action</strong> NZ.<br />
234
Senate Community Affairs Reference Committee. (2004). A hand-up not a hand-out: Renewing the<br />
fight against poverty: Report on poverty and financial hardship. Canberra: Commonwealth<br />
of Australia.<br />
Sharpe, N. (2011). Health equity: a prerequisite for social and economic progress. The New Zealand<br />
Medical Journal, 124(1330), 1-3.<br />
Sharples, H. D. P. (2010). Speech to Te Pourewa Arotahi at the Treaty Settlement Symnposium.<br />
Retrieved from http://www.scoop.co.nz/stories/PA1011/S00554/speech-sharples-treatysettlement-symposium.htm.<br />
Shonkoff, J. P., & Phillips, D. A. (Eds.). (2000). From Neurons to Neighborhoods: The Science of<br />
Early <strong>Child</strong>hood Development. Washington DC: National Academy Press.<br />
Smith, A. B. (2005). Effects of physical punishment. In A.B. Smith, M.M. Gollop, N.J. Taylor & K. A.<br />
Marshall (Eds.), The Discipline and Guidance of <strong>Child</strong>ren: Messages from Research (pp.<br />
7-16). Wellington: Office of the Commissioner for <strong>Child</strong>ren and <strong>Child</strong>ren’s Issues Centre,<br />
University of Otago.<br />
Smith, A. B., Grima, G., Gaffney, M., Powell, K., Masses, L., & Barnett, S. (2000). Strategic Research<br />
Initiative Literature Review Early <strong>Child</strong>hood Education. Report to the Ministry of Education.<br />
Retrieved from http://www.taskforce.ece.govt.nz/wp-content/uploads/2010/11/ECE-<br />
Literature-Review.pdf<br />
Smyth, P., & Henman. (2010). The distributional and financial impacts of the new Australian <strong>Child</strong><br />
Support scheme: a ‘before and day-after reform’ comparison of assessed liability Journal of<br />
Family Studies<br />
Snook, I., & O’Neill, J. (2010). Social class and educational achievement: beyond ideology. New<br />
Zealand Journal of Educational Studies, 45(2), 3-18.<br />
Spier, P. (2001). Recidivism patterns for people convicted in 1995.<br />
Spies-Butcher, B. (2010). Growing apart or coming together? Australia and New Zealand since<br />
the crisis. Retrieved from http://www.business.auckland.ac.nz/Schoolhome/Research/<br />
Researchcentres/RetirementPolicyandResearchCentre/<br />
St John, S. (2007). KiwiSaver and the Tax Treatment of Retirement Saving in New Zealand. NZ<br />
Economics Papers 41(2), 143-160.<br />
St John, S. (2009). Universal New Zealand Superannuation and tax: implications for sustainability.<br />
PensionBriefing 2009-5. Auckland: Retirement Policy and Research Centre, Department of<br />
Economics, University of Auckland.<br />
St John, S., & Craig, D. (2004). Cut price kids: Does the 2004 ‘Working for Families’ budget work for<br />
children? . Auckland: <strong>Child</strong> <strong>Poverty</strong> <strong>Action</strong> <strong>Group</strong>.<br />
St John, S., & Dale, M. (2010a). Evidence based valuation of social policy. Paper presented at the<br />
NZ Association of Economists Annual Conference<br />
St John, S., & Dale, M. (2010b). The New Zealand Experience of <strong>Child</strong>-based Work Incentives.<br />
European Journal of Social Security 12(3), 216-241.<br />
235
St John, S., & Rankin, K. (2009). Escaping the welfare mess, Working Paper 267. Auckland:<br />
Department of Economics, The University of Auckland.<br />
St John, S., & Wynd, D. (Eds.). (2008). <strong>Left</strong> behind. How social and income inequalities damage New<br />
Zealand children Auckland: <strong>Child</strong> <strong>Poverty</strong> <strong>Action</strong> <strong>Group</strong> NZ.<br />
Stacey, T., Thomson, J. M. D., Mitchell, E. A., Ekeroma, A. J., Zuccollo, J. M., & McCowan, L. M. E.<br />
(2011). Relationship between obesity ethnicity and risk of late stillbirth: A case control study.<br />
BMC Pregnancy childbirth, 11.<br />
Staff, J., Schulenberg, J. E., Maslowsky, J., Bachman, J. G., O’Malley, P. M., Maggs, J. L., et al.<br />
(2010). Substance use changes and social role transitions: Proximal developmental effects<br />
on ongoing trajectories from late adolescence through early adulthood. Development and<br />
Psychopathology, 22(Special Issue 04), 917-932.<br />
Statistics New Zealand. (2010a). Household Labour Force Survey: December 2010 quarter.<br />
Wellington.<br />
Statistics New Zealand. (2010b). National ethnic population projections 2006 (base)- 2026, Media<br />
release. Wellington: Statistics New Zealand.<br />
Statistics New Zealand. (2011). Consumer Price Index.<br />
Statistics New Zealand and Ministry of Pacific Island Affairs. (2010a). Demographics of New Zealand’s<br />
Pacific Population. Wellington: Statistics New Zealand & Ministry of Pacific Island Affairs.<br />
Statistics New Zealand and Ministry of Pacific Island Affairs. (2010b). Education and Pacific Peoples<br />
in New Zealand. Wellington: Statistics New Zealand.<br />
Stephens, M. (2011). The Right to Social Security in New Zealand. In H. R. Foundation (Ed.), Law<br />
into <strong>Action</strong>: Implementing Economic Social and Cultural rights in Aotearoa New Zealand.<br />
Wellington: Human Rights Foundation.<br />
Stevenson, O. (1998). Neglected <strong>Child</strong>ren and Their Families. Oxford: Blackwell.<br />
Stobart, G. (2008). Testing times: The uses and abuses of assessment. London: Routledge.<br />
Studholme, R. (2011, 7 January 2011). Youth joblessness ‘takes toll on families’. The Timaru Herald.<br />
Retrieved from http://www.stuff.co.nz/national/4518363/Youth-joblessness-takes-toll-onfamilies<br />
Tax Working <strong>Group</strong>. (2010). A Tax System for New Zealand’s Future: Report of the Victoria University<br />
of Wellington Tax Working <strong>Group</strong>. Wellington: Victoria University, The Treasury, and Inland<br />
Revenue.<br />
Taxation Review Committee. (1967). Taxation in New Zealand Wellington: Government Printer.<br />
Te Puni Kōkiri/Ministry of Māori Development. (1998). Making Education Work for Māori. Report on<br />
Consultation. Wellington: Te Puni Kōkiri/Ministry of Māori Development.<br />
Television New Zealand. (2011). Capping an Option for Loan Sharks, Power Says. TV One News.<br />
Retrieved from http://tvnz.co.nz/business-news/capping-option-loan-sharks-powersays-4261329<br />
236
Telford, M., & May, S. (2010). PISA 2009: Our 21st century learners at age 15. Wellington: Ministry<br />
of Education.<br />
Tertiary Education Union. (2011). NorthTec responds to skills shortage by looking to fire trades<br />
teachers. Tertiary Update, 14(10). Retrieved from http://teu.ac.nz/2011/03/northtecresponds-to-skills-shortage-by-looking-to-fire-trades-teachers/<br />
TFNZ. (2011). Teach First New Zealand. Auckland: Teach First New Zealand.<br />
The <strong>Child</strong>ren’s Social Health Monitor. (2009). Economic Indicators. Dunedin: The New Zealand <strong>Child</strong><br />
and Youth Epidemiology Service.<br />
The Inland Revenue Department. (2010). Working for Families: Parental tax credit. Retrieved from<br />
http://www.ird.govt.nz/wff-tax-credits/entitlement/what-is-wfftc/ptc<br />
The Mental Health Commission. (2006). Report on Progress 2004/05: Towards implementing the<br />
Blueprint for Mental Health Services in New Zealand: The Mental Health Commission.<br />
The New Zealand <strong>Child</strong>rens Social Health Monitor. (2011). Infant Mortality. Dunedin: New Zealand<br />
<strong>Child</strong> & Youth Epidemiology Service.<br />
The New Zealand Treasury. (2009). Challenges and Choices, New Zealand’s Long-term Fiscal<br />
Statement. Retrieved from http://www.purl.org/nzt/o-1243<br />
The New Zealand Treasury, & Inland Revenue Department. (2009). Changing the rate of GST: Fiscal,<br />
Efficiency, and Equity Considerations. Wellington: Victoria University: Tax Working <strong>Group</strong>.<br />
The Paediatric Society of New Zealand. (2010). Advice for the Ministry of Health for Best Practice<br />
for Rheumatic Fever Control: Summary of International Workshop on Rheumatic Fever/<br />
Rheumatic Heart Disease Control in New Zealand.<br />
The Smokefree Coalition. (undated). Tobacco Free New Zealand by 2020, Tupeka Kore Aotearoa<br />
by 2020: The Vision. The Smokefree Coalition. Available: http://www.sfc.org.nz/pdfs/<br />
TheVision2020.pdf.<br />
The Treasury. (2001). Final report tax review 2001. Wellington: The Treasury.<br />
The Treasury. (2011). Monthly Economic Indicators: February 2011. Wellington: The New Zealand<br />
Treasury.<br />
Thomson, G., Wilson, N., & Edwards, R. (2009). At the Frontier of Tobacco Control: A Brief Review<br />
of Public Attitudes Toward Smoke-Free Outdoor Places. Nicotine and Tobacco Research,<br />
11(6), 584-590.<br />
Thomson, G., Wilson, N., Weerasekera, D., & Edwards, R. (2008). Ninety-Six Percent of New<br />
Zealand Smokers Support Smokefree Cars Containing Preschool <strong>Child</strong>ren. New Zealand<br />
Medical Journal, 121(1285), 139-140.<br />
Thrupp, M. (2009). Teachers, social contexts and the politics of blame. Queensland: Teacher’s Union<br />
Professional Magazine. .<br />
Thrupp, M., & Irwin, R. (2010). National’s first year in education. Hamilton: University of Waikato.<br />
237
Tobias, M., Blakely, T., Matheson, D., Kumanan Rasanathan, K., & Atkinson, J., 1718. (2009).<br />
Changing trends in indigenous inequalities in mortality: lessons from New Zealand”.<br />
International Journal of Epidemology, Changing trends in indigenous inequalities in mortality:<br />
lessons from New Zealand”(38), 1711-1722.<br />
Tolmie, J., Elizabeth, V., & Gavey, N. (2010a). Is 50:50 shared care a desirable norm following<br />
family separation? Raising questions about current family law practices in New Zealand.<br />
New Zealand Universities Law Review, 24 1(1), 136-166.<br />
Tolmie, J., Elizabeth, V., & Gavey, N. (2010b). Submission in response to the Inland Revenue<br />
Department’s Discussion Document: ‘Supporting <strong>Child</strong>ren: A Government discussion<br />
document on updating the <strong>Child</strong> Support scheme’. .<br />
Torrie, B. (2011, 24 May 2011). Effectiveness of boot camps ‘under wraps’. Dominion Post. Retrieved<br />
from http://www.stuff.co.nz/national/politics/5044520/Effectiveness-of-boot-camps-underwraps<br />
Tu’itahi, S. (2010). Fanau Ola: A Pacific Perspective on Whānau Ora. Hauora, 81(12).<br />
Tumama Cowley, E., Paterson, J., & Williams, M. (2004). Traditional gift giving among Pacific families<br />
in New Zealand. Journal of Family and Economic Issues, 25(3), 431-444.<br />
Tuohy, R. (2008). A Literature Review of Effective Approaches That Support Smoking Cessation for<br />
Pregnant Women Who Call a Quitline Service. Wellington: The Quit group. Available http://<br />
www.quit.org.nz/file/research/FINAL%20Pregnant%20Women%20and%20Quitline%20<br />
Lit%20Review%2020080428.pdf.<br />
Twiss, J., Metcalfe, R., Edwards, E., & Byrnes, C. (2005). New Zealand national incidence of<br />
bronchiectasis “too high” for a developed country. Arch Dis <strong>Child</strong>, 90(7), 737-740.<br />
Twiss, J., Stewart, A. W., & Byrnes, C. A. (2006). Longitudinal pulmonary function of childhood<br />
bronchiectasis and comparison with cystic fibrosis. Thorax, 61(5), 414-418.<br />
UK <strong>Child</strong> Support Agency. (2011). What is child maintenance and how does it affect me? Information<br />
and guidance. Retrieved from http://www.csa.gov.uk/en/PDF/leaflets/new/CSL301.pdf<br />
UNICEF. (2003a). A league table of child maltreatment deaths in rich nations. Florence: Unicef<br />
Innocenti Research Centre.<br />
UNICEF. (2003b). A league table of child maltreatment deaths in rich nations. Florence: Unicef<br />
Innocenti Research Centre.<br />
UNICEF. (2007). <strong>Child</strong> poverty in perspective: An overview of child well-being in rich countries,<br />
Innocenti Report Card 7. Florence: UNICEF Innocenti Research Centre.<br />
UNICEF. (2011). The State of the World’s <strong>Child</strong>ren: Adolescence, an age of opportunity. Executive<br />
Summary. New York: United Nations <strong>Child</strong>ren’s Fund.<br />
United Nations. (1989). United Nations Convention on the Rights of the <strong>Child</strong> (UNCROC). Retrieved<br />
from http://www.un.org/documents/ga/res/44/a44r025.htm.<br />
238
United Nations Committee on the Rights of the <strong>Child</strong>. (2011). Fifty-sixth session, Consideration<br />
of Reports submitted by States parties under article 44 of the convention – Concluding<br />
observations – New Zealand.<br />
Victoria University Student Union. (2010, 17 April 2010). 94% increase in student levies at Victoria,<br />
to $514 Salient.<br />
Wade, A. (2011, 21 June). Loans by text appal budgeting advisers. New Zealand Herald. Retrieved<br />
from http://www.nzherald.co.nz/nz/news/article.cfm?c_id=1&objectid=10733481<br />
Waldegrave, C., & Waldegrave, K. (2009). Healthy families, young minds and developing brains:<br />
enabling all children to reach their potential. Wellington: Families Commission.<br />
Walden, C. (2011). Monopoly Games in the Nursery. Community inequalities and early childhood<br />
education. Auckland: The Salvation Army Social Policy and Parliamentary Unit.<br />
Walters, G. D. (1992). A meta-analysis of the gene-crime relationship. Criminology, 20, 595-613.<br />
Walton, J., Barondess, J. A., & Lock, S. (Eds.). (1994). The Oxford Medical Companion. Oxford:<br />
Oxford University Press.<br />
Watkins, T. (2011, 8 March). 10,000 earthquake damaged Christchurch homes may be lost. Dominion<br />
Post. Retrieved from http://www.stuff.co.nz/national/christchurch-earthquake/4741778/10-<br />
000-earthquake-damaged-Christchurch-homes-may-be-lost<br />
Welfare Working <strong>Group</strong>. (2010a). Long-Term Benefit Dependency: Options Paper. Wellington:<br />
Welfare Working <strong>Group</strong>.<br />
Welfare Working <strong>Group</strong>. (2010b). Long-Term Benefit Dependency: The Issues. Wellington: Welfare<br />
Working <strong>Group</strong>.<br />
Welfare Working <strong>Group</strong>. (2010c). Long-term benefit dependency: the issues. Summary Paper<br />
Wellington.<br />
Welfare Working <strong>Group</strong>. (2010d). Reducing Long-Term Benefit Dependency: The Options. Wellington:<br />
Welfare Working <strong>Group</strong>.<br />
Welfare Working <strong>Group</strong>. (2011). Reducing Long-Term Benefit Dependency. Recommendations.<br />
Wellington: Victoria University.<br />
Wellington Women’s Refuge. (2011). Wellington Women’s Refuge Respond To Welfare Changes<br />
Wellington: Wellington Women’s Refuge.<br />
Wells, C. (2010). Funding cuts take effect. Retrieved from http://www.nzkindergarten.org.nz/<br />
AnnouncementRetrieve.aspx?ID=44953<br />
Whānau Ora Taskforce. (2010). Whānau Ora: report of the taskforce on Whānau-centred Initiatives.<br />
Wellington.<br />
Whitaker, R. C., Wright, J. A., Pepe, M. S., Seidel, K. D., & Dietz, W. H. (1997). Predicting obesity<br />
in young adulthood from childhood and parental obesity. N Engl J Med, 337(13), 869-873.<br />
White, D. (2009). A tax System for New Zealand’s Future: Morning Session 2 GST. Wellington:<br />
Victoria University, The Centre for Accounting, Governance and Taxation Research.<br />
239
Whitehead, J. (2010). Speech: Lifting New Zealand’s Economic Growth. Retrieved from http://www.<br />
treasury.govt.nz/publications/media-speeches/speeches/pdfs/sp-liftingecogrowth-24nov10.<br />
pdf<br />
Wilkinson, R., & Pickett, K. (2010). The Spirit Level. Why Equality is Better for Everyone. London:<br />
Penguin.<br />
Wilson, J. (2010). The Origin of the Māori Seats. In M. Bargh (Ed.), Māori and Parliament – Diverse<br />
Strategies and Compromises (pp. 37-71): Huia Publishers.<br />
Wood, B., Hassall, I., Hook, G., & Ludbrook, R. (2008). Unreasonable Force: New Zealand’s journey<br />
towards banning the physical punishment of children. Wellington: Save the <strong>Child</strong>ren New<br />
Zealand.<br />
Wouldes, T., Merry, S., & Guy, D. (2011). Improving the Transition: Reducing Social and Psychological<br />
Morbidity During Adolescence. A report from the Prime Minister’s Chief Science Advisor.<br />
Auckland.<br />
Wright, R. (2011). Budget 2011. Govt hopes boot camp will sort youth unemployment. 3news.<br />
co.nz. Retrieved from http://www.3news.co.nz/Govt-hopes-boot-camp-will-sort-youthunemployment/tabid/419/articleID/209796/Default.aspx<br />
Wynd, D. (2011). Hunger for Learning. Nutritional barriers to children’s education. Auckland: <strong>Child</strong><br />
<strong>Poverty</strong> <strong>Action</strong> <strong>Group</strong> Inc. Aotearoa.<br />
Yahoo!Xtra News. (2010, Feb 1). National advised ECCs to introduce fees – Moroney. Yahoo!Xtra<br />
News. Retrieved from http://nz.news.yahoo.com/a/-/top-stories/8754591/national-advisedeccs-to-introduce-fees-moroney/<br />
240
241
242
243
244