A Beginner’s Guide to Force Curves
At least here in the United States where I am currently at, Autumn is most certainly in the air. The trees are starting to turn beautiful shades of red and orange and the weather is finally starting to cool down to that comfortable range where I can comfortably wear anything (or nothing) at all points in the day comfortably. I think the season is even starting to show in the keyboard community a bit as well. Gone are the dog days of Summer with just constant drama from Glorious Pandas keeping everyone sweating out the future of Holy Pandas on weeks on end, and instead we’ve moved into more subtle and relaxing drama. Banana Splits giving TKC a brain freeze, InfinityKey continuing to dodge customers pointing out how they are practically a scam front, and blatant recolors marketed as such on Geekhack are getting brushed away like fallen leaves on a sidewalk. Hopefully Trick or Treating in a couple of weeks will bring something sweet for me to get to enjoy a little bit more than these fleeting tastes of drama surrounding switches.

Figure 1: In this analogy, these are almost certainly the ‘Pumpkin Spice Latte’ of MK Autumn.
Poetic musings of seasonal changes aside, this has been one of the few documents that I’ve been meaning to write for some time. In the same vein as my ‘Beginner’s Guide to Switches”, force curves were something I didn’t quite understand all too well when I entered the hobby, and it didn’t get fixed until I sat down and read a lot of articles about them. A couple of which, in fact, I couldn’t possibly launch into my take on force curves about without mentioning first:
HaaTa’s ‘How to Read a Force Curve’
The Problem with Mechanical Switch Reviews
For those of you unaware of these articles, HaaTa is an extremely famous mechanical keyboard enthusiast who has faded a fair bit from the limelight over the years since I’ve been in this hobby but is still highly important. In fact, I would go so far as to say that these two articles are honestly among some of the most cornerstone documents to read when learning about mechanical keyboards at a deeper level, and many of the older members of the community would agree as well. While I don’t think I could ever replace these documents given how highly I regard them as well as the dedication that HaaTa brought toward switches and progressing the objective study and reporting of them, I will give it my best attempt anyhow.
What are Force Curves
Launching immediately into the idea of discussing force curves and their nuances honestly does a bit of a disservice as to how exactly these graphs come about and why we may not see them nearly as much or in as high of a quality as one would expect. In order to combat this, much like with the Beginner’s Guide to Switches, we are going to go all the way back to the start of this all.

Figure 2: Approximately 13.7 billion years ago…
Starting entirely at the beginning, mechanical keyboard switches all have springs in them, which act to give the switch the ability to be pressed inward to complete a circuit and to return back to their resting stationary position. Much to our delight, though, not all of these springs are created equally. Even with little documentation exists detailing how all of these things affect switch feel and performance, the material which springs are made out of, the material the springs are coated in, the spacing between their coils, and even their number of end coils all have an effect on how the springs themselves act within a switch. However, while you all can open any switch and inspect these differences for yourself by simply looking at the springs inside, there is an inherent and unique quality to all (simple helical) springs such as these that you can’t see nor taste nor smell, and it is known as the Hooke’s Law Constant of the spring.

Figure 3: Hooke’s Law for simple helical springs.
Taking you back to your introductory Physics lessons, which I almost certainly hated more than you given my chemistry-heavy background, the Hooke’s Law Constant is represented as ‘k’ in the above formula known as Hooke’s Law. This mathematical formula relates the displacement or distance a spring compresses/stretches to the force applied in pushing or pulling on it via this constant, k. Thus, in the simplest of terms, all springs have some sort of inherent constant to them that can be used to relate how they move as a result of a force applied to them. In fact, this inherent k value can be graphically determined by compressing a spring and recording how much it compresses for the weight given, which gives you a line with a slope equivalent to k. This line would be graphed on what is known as a ‘Force vs. Displacement’ graph.
Interestingly enough, while Hooke’s Law may only work easily for this document to explain how springs can be graphed on a Force vs. Displacement graph, these types of graphs can be constructed for nearly any elastic material. And this is where I will launch into a discussion of the ‘General Tensor Form’. All jokes and physics-induced-PTSD episodes aside, over time scientists have developed a lot of highly technical and precise instruments to measure things such as elasticity and Force vs. Displacement graphs. While I have had my share of a fun time messing with some of these instruments in the rheology lab in which I worked for a brief time at an internship, force versus displacement graphs are relatively easy to make for something like a mechanical keyboard switch and can be completed with two instruments – one to measure force and another to measure displacement.
With respect to this application and the general study of other objects undergoing deformation, the force in a force versus displacement graph is often measured using what is known as a force gauge. While there are a ton of different brands, prices, and resolutions with respect to force gauges, among the most famous models are that of ‘Imada’, which even HaaTa chose to use in his final force curve tester that he put together. Typically, Imadas can run anywhere from $300 to $1,000 USD per gauge depending on the resolution and scale on which they can operate. As can be seen in the image of an Imada force gauge, below, these often have one or two attachments to them which can either be hooked to an object for pulling or pressed into an object for pushing and measure the force being applied to the object.

Figure 4: Imada DS2-44 Digital Force Gauge.
The displacement, on the other hand, is often measured through the use of a testing stand, either manual or motor driven, that can measure how far the force gauge has moved from its initial starting position as it is taking its readings. As can be seen in the picture of one of these testing stands, below, the force gauge is often strapped directly onto the moving portion of the stand in order to provide a displacement value for each of the forces read by the testing stand. Unlike the force gauges, which many would assume to be the more expensive item in this combination, motorized testing stands can see costs upwards of $2,000 to $3,000 depending on how finely tuned the motor and speed control is for the stand.

Figure 5: Imada MX2-550 Vertical High-Performance Motorized Test Stand.
Given that I just explained that while there is really only two pieces of equipment necessary for someone to be able to carry out the measurements required to make a switch force curve, and yet it would still cost at least a custom Keycult commission to make, I can understand the question that has come to your mind by now: Can’t this be done any cheaper? And to that end, I would say that you can most certainly find a way to measure force and displacement and generate your own force curve through that means, though what you will lose is a strong amount of accuracy and resolution. See, while you can get an extremely accurate force gauge by itself, or Da Vinci an incredibly fine-tuned testing stand that can measure to the nearest micrometer of displacement, there is an extremely strong correlation that needs to occur between these two measured values. Especially working on the aforementioned scale of grams and millimeters that are required for switches, even having the slightest disconnect between the force and displacement measurements in a switch force curve could lead to wildly inaccurate force curve bump sizes, changes in actuation or bottoming out distance, and completely misrepresent a switch altogether. As well, something that professional setups as these provide are an extremely high sampling rate on the order of thousands of data points per tenth of a millimeter travel distance, which can detect much more subtle changes in force curves and represent them more accurately than a homemade setup that would require infinitely longer time to record as many data points. The strive for upmost accuracy and resolution in testing is not only why I downplay the ‘magical properties’ that the community seems to claim about burn tests for switches, but why I am hesitant to believe the force curves generated from contrived setups that are less suited than professional lab equipment as such.
As to my previous points about pricing, though, professional grade setups such as the one HaaTa put together in his famous article can still be accomplished for less than $2,000, but it takes a hell of a lot of work as we could see from his build log. That being said, once you have a high resolution force curve tester setup with a relatively high sampling rate, you can get to making high quality switch force curves in a fraction of the time that it would take to make a similar graph from a lesser quality setup. Now that all of the ‘complicated’ background and equipment is out of the way, we can focus on what these force curves look like and how to interpret their results.
How to Read a Force Curve

Figure 6: Hako Violet Force Curve. (Courtesy of HaaTa)
If this is the first time you’re looking at a switch force curve, or rather really sitting down to analyze them closely, you’re probably already cursing me out for “lying” to you in the above section about the straight line graph generated from the Hooke’s Law equation. While that is a good starting point to jump into force curve graphs and how they are made, this simply isn’t representative of the force curve for a complicated mechanism like a mechanical keyboard switch. The line that you would generate on a force versus displacement graph would be straight if and only if you were testing the spring inside of a keyboard free from influence from other forces. As you can see in the image below, though, there are extra forces acting on the spring such as interactions between the stem and leaf as well as if lubricant is applied to your springs. All of these features and especially the interactions between stems and leaves are what cause the nuanced, complex, and nonlinear force graphs we see in switches.

Figure 7: Force diagram of additional forces acting on springs as a result of stem/leaf interactions.
While I am not a particularly savvy graphics maker, nor have I ever been, the above and abbreviated free-body diagram simply picks two different points within a switch’s press cycle and demonstrates the force that the leaf (which always wants to swing inwards back towards the central axis) has on the stem that rests on top of the spring. Referring again to that linear graph that I discussed, that would be generated purely from motion of the spring on along the orange vertical axis. As you can see from the yellow force directionally applied from the leaf to the stem, though, there is a varying force added to the spring both horizontally and vertically depending on where in the keystroke you are, and this helps add to the complexity of the stroke. These differences in horizontal and vertically added forces can be seen in the green constituent lines that make up the component forces of the identically long yellow force lines in both instances.
So now that we’ve covered some of the complexities underlying these force curve graphs, and don’t worry there will certainly be a bit more, we can go ahead and break down the example force curve from the start of this section down into several components.
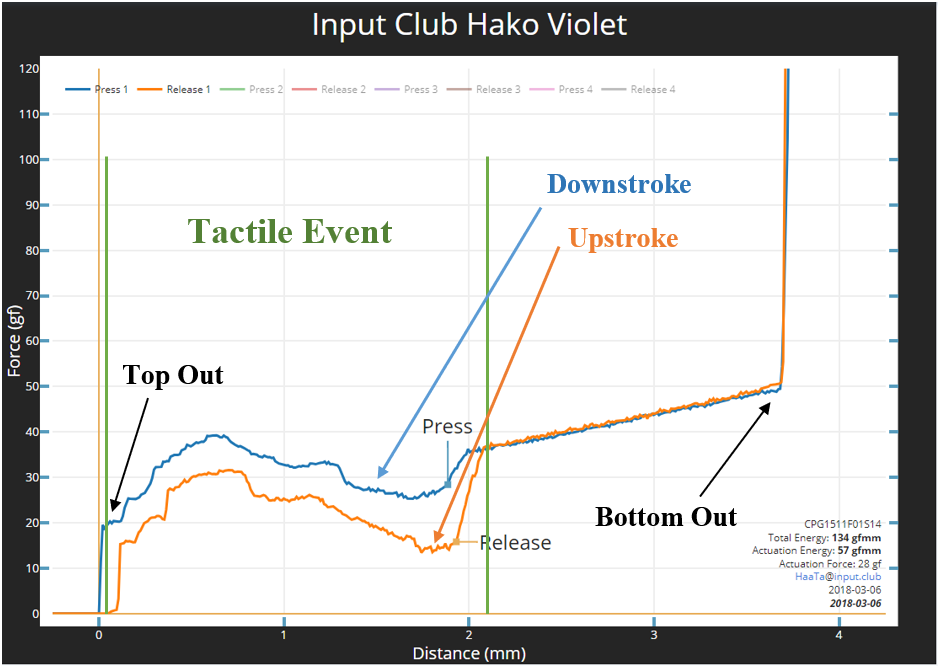
Figure 8: Hako Violet Force Curve broken down into points of note.
Force curve graphs are typically laid out with two different curves to them, one on the top and one on the bottom, here respectively highlighted in blue and orange. The top line in blue is the downstroke and is read from left to right, where a switch in resting position starts at 0 mm and is fully pressed in as it travels towards 4 mm. The bottom line in orange is the upstroke and is read in the opposite fashion going right to left. This orange line represents a switch traveling from bottom out back up to its normal resting position. At the far ends of the graph where the blue and orange lines meet, you will see top and bottom outs of the switch labeled. With respect to the bottom out part of these force curve graphs, note that the reason they spike vertically towards an infinite force is because the stem is firmly in the bottom out position and can continue to have force applied to it without it further moving. On the opposite end of the curve, notice how the beginning of the stroke does not start until there is some initial force that is overcome. At the bare minimum, this beginning buffer is in place to make sure that the spring doesn’t immediately begin to compress under the weight of the stem itself, and explains why in part there is a bottom limit to the weight of springs that can be used in keyboard switches.
Now moving onto the bigger features of these graphs, you’ll notice that there is a region bounded by green lines and labeled the ‘Tactile Event’ and a fairly linear region outside of this that is unlabeled. With all tactile and clicky switches, the force curve graphs will have this bumpy region inside of the green lines which is known as the ‘Tactile Event’ and gives the switch its distinctive characteristic. The unlabeled linear region after that, aptly enough, is referred to as ‘linear post travel’. If you’ve read some of my reviews prior to this document, you’ll know that this region doesn’t necessarily have to follow the tactile event in a downstroke, but can also come before the tactile bump, and is referred to as ‘linear pre travel.’ While switches such as Holy Pandas and “T1s” tend to have tactile events that occur right at the beginning of the downstroke, like the example graph here, tactile switches like Aliaz or Cherry MX Browns tend to have ones that occur in the middle with both linear pre and post-travel regions. Unlike clicky and tactile switches, linear switch force curves will in fact look entirely like this region and are much more reminiscent of the Hooke’s Law graph that I had discussed earlier. (Hint: It’s because linear switches have smooth legs that don’t change the additional horizontal and vertical forces on the spring and stem no matter where they are in the stroke.)

Figure 9: Gateron Yellow Force Curve. (Courtesy of HaaTa)
Moving back to the tactile/clicky style force curves, I want to drill specifically down further into the nitty gritty details about the Tactile Event region. As I have bitched about countless times before in nearly every server that I am in, people are extremely bad at objectively describing switch feels and what exactly it is that they like in a tactile switch. Already, you’ve been introduced to the idea of tactile event location with respect to where it is within the stroke and whether or not it has linear pre-travel or post-travel, which should help you out some bit in describing your experience. The more important things people like to discuss though are how ‘big’ and how ‘strong’ tactile bumps feel. “Big” and “Small” are often used by people to describe how long a tactile event occurs in a switch. As can be seen in the example graph, the tactile event stretches from pretty much the beginning of the stroke to just shy of 2 mm in length. Being that this is over half of the length of the stroke itself, many people would objectively refer to this as a ‘big’ bump. Another great example of a ‘Big’ tactile bump would be that of Novelkeys’ Blueberry switches, which have a notoriously long tactile event region as can be seen below in their manufacturer force curve.

Figure 10: Novelkeys Blueberry Force Curve. (Courtesy of Kailh)
On the flip side of ‘Big’ bumps, you can also get ‘Small’ bumps which have a tactile even that occur over a much shorter scale. A great example of these, in fact, are Clicky switches such as Box Jades or Box Navies. Now before you pause your reading to DM me and tell me that I just called Box Jades tactile switches, I want you to take a second and consider what exactly a tactile bump is. With respect to looking purely at force curves, a tactile bump occurs whenever there is an inflection point or change in the curvature of the force graph causing there to be either an increase or decrease in the force that was being applied to the switch. It’s not so hard to wrap your head around this when you consider that tactile bumps both literally feel like a bump and register on a force curve as a bump-like shape – they require more force to ‘get up over’ than a linear switch. In much the same way, click jackets and click bars in clicky switches also require more force to push past than a linear switch, and thus will cause inflection points in their force curves that make them appear like a tactile switch on paper. Though, due to the fact that changes in force on the stem from a clickbar and/or click jacket are much quicker and less drawn out than that of a bumpy tactile stem leg, these often produce ‘Small’ tactile bumps to switches. Hell, stretching your brain just a bit further, they’re only even called clicky switches instead of tactiles because they produce noise. To a deaf person, clicky switches are just tactile switches with really small tactile bumps.

Figure 11: Currently everyone taking a break to pause after that last sentence.
The other quality people often refer to when discussing tactile switches is the ‘strength’ of the tactile event. Thankfully for you, this is a bit easier to discuss and has less potentially paradigm-breaking points to be made. The ‘strength’ of a tactile bump can easily be quantified by how much of a change in force there is from the initial stroke to the peak of the bump within the tactile event region. Looking back to our labeled example force curve, you’ll see that the tactile bump peaks at about 40 grams of force while the beginning of the stroke starts at about 20 grams of force. Being that this is a differential of only 20g. in force, many people would describe this as a relatively ‘weak’ tactile bump, whereas something like a Box Royal, which can be seen below, has a differential from peak to start of about 45g. of force. While this quantity alone isn’t necessarily the sole factor that contributes to a strong versus weak tactile bump, this is really one of the most easily recognizable features of a force curve that you can read to generate an understanding on whether or not you will like the tactile switch before you buy it.
An additional few points to consider when looking at the force curve example here, provided by HaaTa and his amazing setup, are the points labeled ‘Press’, ‘Release’, and the Bottom Out point. While most force do not feature the ‘Press’ and ‘Release’ markers, what these points are referring to is what is known as the activation point of a switch. These are the points within the keystroke that the switch completes a circuit and registers a keystroke with your computer. Thus, considering both of these points together, anything to the right end of the graph is the displacement you will need to register a stroke with this particular switch and anything to the left is not. Now, aftermarket springs from many sellers are listed in terms of actuation force rather than bottom out force. Given that you now understand where the activation point is for this switch, you can find the force in which it activates by simply drawing a line over to the ‘Force’ axis. However, if you take this spring out and put it into a switch from a different brand, its likely going to have different forces interacting on it from a different shaped stem and leaf, and will likely cause there to be a different point of activation relative to the initial switch in which that spring came out of. Thus, for that very reason, activation forces that are marketed by spring sellers make literally no sense at all as the force at the activation point could widely change depending on what switch you put them into. The one feature about aftermarket springs that is consistent between different switches, though, is the bottom out force. Located at the far right end of the graph, at the point where the graph spikes vertically, the bottoming out force is often times the maximum force that you will get from that spring at any point throughout its compression or expansion. Realistically, since many people shop for springs based upon a weight that they want in their keyboard, it’s always wiser to pay attention to the bottoming out force as an absolute ceiling to what you may get out of those springs. While only really tangentially related to force curves, in general, you can still see the locations of the activation points on some force curves out there and its beneficial to understand why these may come across as misleading given the prevalence of modification and frankenswitches in this community currently.
Now, the final feature of a force curve that I want to discuss comes down to a small detail that is often overlooked by nearly everybody, myself included. It’s not necessarily something that you need to know in order to get the best idea about whether you will like a switch or not, but it is an interesting feature, nonetheless. Brought to my attention by the one and only Glarses (yes the guy that types sort of fast), I had to take a deep dive as to figure out why there is a clear difference in force between the downstroke (blue) and upstroke (orange) lines in nearly all tactile force curves. Initially, I had hypothesized that this was an added effect of the force induced onto the stem and spring via the leaf as I showed above in the free body diagrams of a switch. After all, the leaf in an upstroke would help produce an ever so slightly upwards force due to the angle that it would be contacting the leg with. And while I won’t discredit that this plays some role in the complex motion that is a mechanical keyboard switch, the majority of this difference is largely due to an effect known as ‘Elastic Hysteresis’. Since the downwards force of you pushing onto a mechanical switch occurs at a different rate than it returns back to its starting position on its own, there is some temporary deformation that is imparted into the spring every time you press on it that causes it to not experience the same force at the same level of compression in the downstroke and upstroke. In fact, this is due largely in part to the fact that your spring doesn’t follow Hooke’s Law perfectly and instead is subject to forces like internal friction that can help explain some of the energy dissipated as it returns from elastic deformation during the upstroke, resulting in a seeming “lesser” force on return than when you pressed into it initially. Ultimately, though, this is more a neat consequence of physics that manifests itself in an ignored place rather than it is something you need to know in order to determine how much you’ll like a switch.
The State of Force Curves Today
Armed with the knowledge of how to read and interpret force curves now, I’m almost certain that you’ll be looking hard for them in the next upcoming switch interest check or groupbuy. Unfortunately, though, for the vast majority of switches, you’re not likely to find one that is trustworthy, if at all. Since HaaTa’s push to make his force curve device, he’s effectively fallen off of the map when it came to recording switch force curves and nobody has quite taken his place as prominently as one would hope. While there have been a few people who purportedly have high resolution, high sample rate force curve devices in their own possession, they don’t seem to be driven to produce as many force curves as possible in order to properly catalog and document force curves for all of those switches out there. And doubly unfortunate is that the few pockets of force curves that exist out there all come from different devices with different testing metrics, different resolutions, and different operators, thus making comparisons between them dubious at best. Past this, the only force curves you may see are the occasional questionable ones from a manufacturer themselves, though none to the best of my knowledge have shared their testing methodologies for generating these force curves for their switches.
Obviously as a person who is heavily interested in documenting and collecting as much information as I can about switches, the idea of a singular person dedicating time and effort to produce as many force curves of as many switches as possible is highly enticing to me. Not only would this give us all a standardized set of force curves to reference as a community, but this would also give us the ability to more finely parse hairs as to whether or not switches are in fact just ‘recolors’ or ‘clones’ of other switches. And that is at the most baseline level of testing. People who truly dedicate their time and energy could verify the effects of things like lubing, retooling, and even repeatedly opening and closing housings and whether or not they have an effect on the actual push feel of switches. At the end of the day, all of these things could help make us more informed consumers and help us better tune our tastes in this ever-growing field of switches.
Some day in the future, I personally would like to own a setup like the one I discussed above in the ‘What are Force Curves’ section, though unfortunately it is quite a costly avenue to go down purely for “the love of the game.” While I could surely setup a cheaper model like the ones that have been attempted here and there by the community, I honestly wouldn’t feel that the quality nor accuracy of these results would be good enough to justify sharing them and/or putting my name on them. Even though many of you would shout that any data is better than no data, I haven’t taken that approach to my content thus far and I wouldn’t want to start with something that I could objectively recognize could be better.
Final Thoughts
So here we are. That is everything that you need to know in order to have an above average idea of what force curves are and how to read one to maximize your understanding of what a switch will feel and operate like before getting one into your hands. Obviously, another big part of drawing these conclusions is rooted in experience trying a wide variety of switches, so I will always recommend trying more things than not instead of just looking at force curves and taking a guess. That being said, as I kind of briefly touched on, force curves are becoming a relatively rarer sight among a lot of the modern switch interest checks and groupbuys these days. While a large part of this is due to the fact that more and more switches are not seeing physical performance samples prior to running, this doesn’t excuse the lack of these curves from a lot of factory direct switches that have had more than enough time and chances to be tested. Hopefully as time progresses into the future, I or somebody else will get a chance to start documenting force curves more thoroughly, consistently, and accurately, but for the time being I rest assured knowing that anyone who has made it through this document will be able to confidently navigate the force curves that are out there.
Further Reading
HaaTa’s How To Read a Force Curve
The Problem with Mechanical Switch Reviews