Effective data visualization is an asset in today’s fast-paced business environment. Turning complex information into concise, actionable insights is crucial for decision-makers and it has tangible business results across industries.
For instance, a recent McKinsey & Company study shows that businesses using data presentations are 30% more likely to engage their audience and drive decision-making. This led them to use Four-Quadrant Chart templates as part of their strategy, project management, self-assessment and review, marketing, and finance strategies.
When crafting persuasive and impactful four-Quadrant Charts, SlideTeam Templates marry aesthetics with functionality for market analysis and product positioning.
Each of the templates is 100% editable and customizable. You get structure, a starting point and the capability to tailor the presentation to unique audience profile.
Let’s explore!
Template 1: Four Quadrant Supply and Demand Matrix
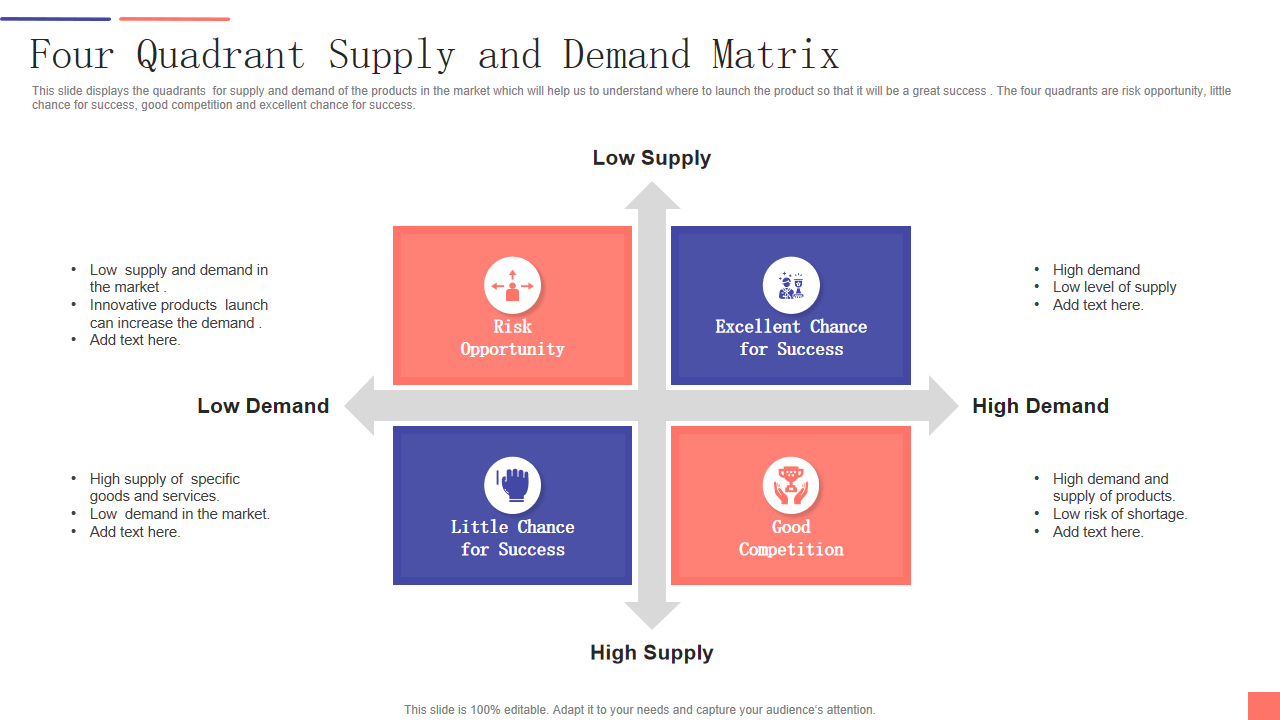
This PPT Slide gives you a deeper insight into product supply and demand dynamics. The ‘Risk Opportunity’ quadrant highlights areas with higher risks, but significant potential rewards - ideal for pinpointing untapped markets with growth potential. The Limited Chance for Success quadrant depicts segments where demand and competition are low. The Good Competition quadrant shows high demand and minimal competition and an Excellent Chance for Success quadrant - launch locations like these provide greater chances for maximum success.
Template 2: Four Quadrant Fiaccabrino Selection Process with icons
This PPT Slide covers four key stages: Seeking Intelligence, Honesty, and Integrity; Communicating Leadership Skills; and Team Orientation and Energy. These stages allow HR managers, recruiters, department heads, and business owners to evaluate candidates on critical attributes - making this tool invaluable in their role as HR professionals, recruiters, department heads, or business owners. This slide allows you to streamline your selection process and make informed hiring decisions that align with your organization's values.
Template 3: Monitoring controls showing four circular quadrants
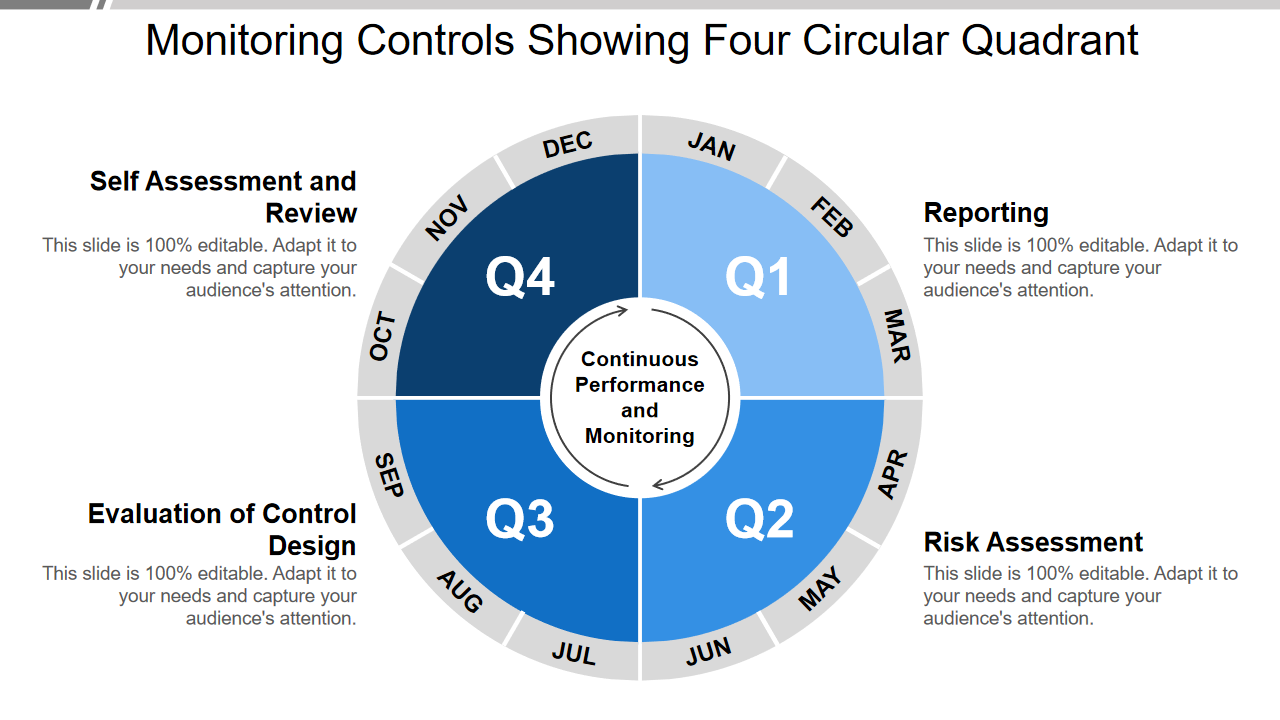
This PPT Template features four distinctive circular quadrants. Reporting serves as the initial phase in which data and information are gathered. Next comes ‘evaluation and control’, where collected information is reviewed against standards and objectives. The risk assessment section emphasizes identifying potential vulnerabilities. Finally, self-assessment encourages organizations to assess their performance and compliance and develop an environment of continuous improvement. This presentation template is a comprehensive tool to enhance industry control, assessment, and risk management processes.
Template 4: Four-quadrant map depicting corona impact on global profitability
This PPT Slide provides an insightful assessment of how the COVID-19 pandemic impacted industries worldwide. From pharmaceuticals, automotive, logistics, airlines, oil, and gas to engineering, it covers information on the impact on every sort of industry. This slide can be a valuable resource for business leaders and industry analysts to study the impact and how industries coped with strategic planning decisions, investment decisions, and market evaluation.
Template 5: Brand planning process in four-step quadrant diagram
This PPT Slide significantly simplifies the brand development and management journey of businesses. Beginning with "Identifying," branding efforts establish a strong identity for the brand. Next comes "Brand Marketing Planning," to assist with strategizing marketing efforts and growing and sustaining efforts over time. Finally, ‘Measuring Brand Performance’ measures the impact of branding efforts. This presentation template is suitable for professionals across industries.
Template 6: Quadrant diagram showing market research process in four steps
This PPT Slide represents the research process divided into four critical steps for easy identification. Problem Identification, Develop Research Plan, Collect Information, Analyze & Interpret. Use this presentation template for market research presentations, team training, or investment pitches.
It makes communicating your research methodology easy, providing clarity and structure to your approach. No matter what level of experience or training you bring to market research efforts, this template provides for everyone - experienced professionals or newcomers alike.
Template 7: Four quadrant time management matrix to determine important task
This PPT Slide is a helpful guide in boosting productivity as it helps businesses identify which tasks should take priority regarding time management and organizational issues. Within the first quadrant, urgent tasks of high importance require immediate action. Quadrant II includes activities that contribute to long-term success by cultivating relationships and supporting growth. Quadrant III guides the eliminating or delegating of tasks. The final quadrant encourages you to delegate tasks that seem urgent but are ultimately unimportant. It suits professionals, students, and entrepreneurs to improve their time management skills.
Template 8: Quadrant model for significant data analytics enablement
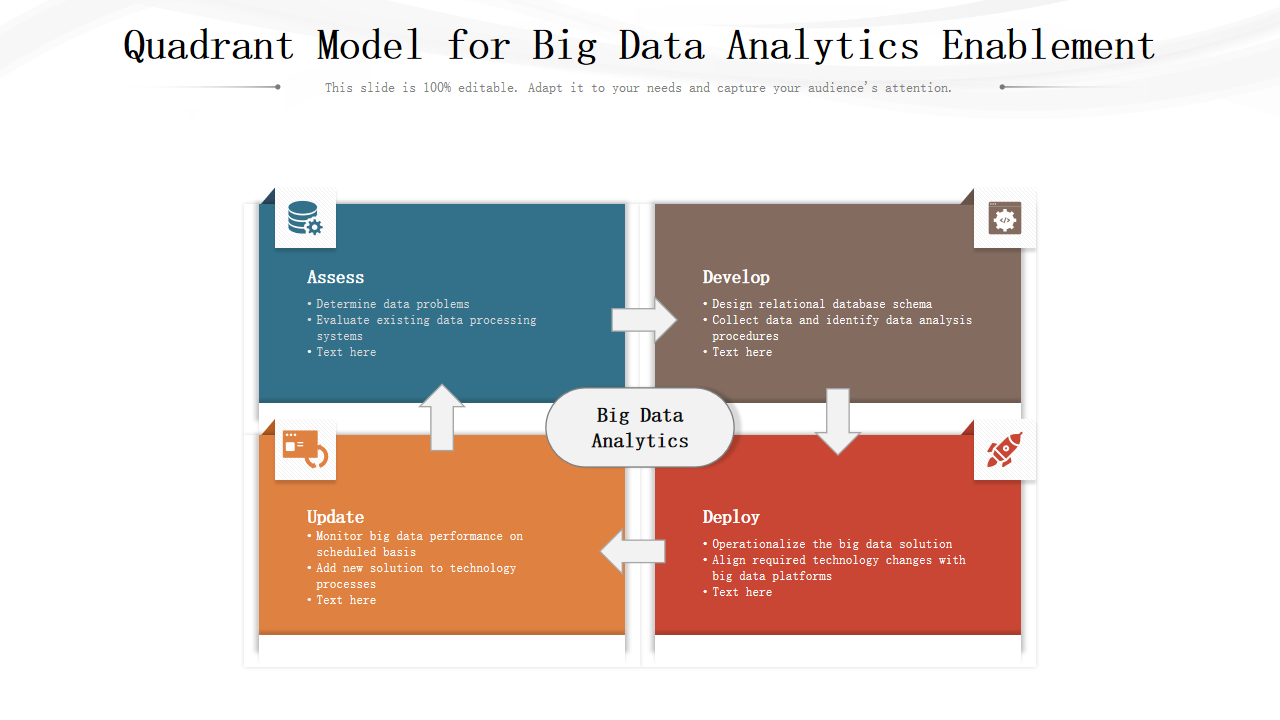
This PPT Slide breaks the process of data analytics into four key stages: Assess, Develop, Update, and Deploy. Assess is where you assess existing data infrastructure. Develop involves developing an effective strategy with appropriate tools; Update refers to keeping processes current; while in Deploy, analytics solutions go live to help make data-driven decisions. It meets the needs of data professionals, business leaders, and anyone in analytics. It helps communicate your strategy effectively regardless of your level of expertise.
Template 9: Four quadrant importance versus performance matrix
This PPT Slide offers an organized framework to assess and optimize projects, strategies, or activities. Users can identify and prioritize key elements using the Importance Quadrant, while the Performance Quadrant allows a critical assessment of effectiveness. It features large content boxes that accommodate data types, including facts, figures, and relevant content. Project managers, strategists, business analysts, and decision-makers can use this slide to align strategies with objectives.
Template 10: Four steps of supply planning in quadrant diagram
This PPT Slide depicts four essential stages in the supply planning process: Categorize your inventory, conduct inventory count, and inventory method. Supply chain professionals, inventory managers, and business leaders find this tool indispensable in simplifying supply planning complexities and communicating strategies. Whether for stakeholders, team training sessions, or refining supply planning approaches, this slide ensures your message is communicated and comprehended.
Connect with us for best outcomes!
Data visualization requires trustworthiness; these "Top 10 4 Quadrant Chart Templates" from SlideTeam serve as reliable guides through the maze of information. When embarking on your data-driven journey, remember that it's not simply about charts; rather it is about changing how you perceive and interpret your world. Explore, create, and elevate presentations using these templates!
FAQs on 4-Quadrant Charts
What is a 4-quadrant chart?
A 4-quadrant chart is a visual representation that organizes data into four separate quadrants or categories, typically on two axes. These charts can help analysts and visualizers analyze and visualize information based on two criteria or dimensions to spot patterns, relationships, or trends within their data set. For instance, in a business context, a four-quadrant chart could represent market growth vs. market share with quadrants labeled as variants of growth versus share (high and low).
What is the purpose of a quadrant chart?
Quadrant charts serve as visual frameworks for categorizing and analyzing information based on two distinct criteria or dimensions. With their breakdown of a chart into four quadrants with intersecting axes, quadrant charts provide an easy and precise representation of relationships, patterns, and trends within data. Quadrant charts can simplify complex concepts by making recognizing correlations and outliers easier, prioritizing tasks or items, and making informed decisions. Quadrant charts offer a systematic way of classifying data into four categories, each having its interpretation or significance. Quadrant charts can be valuable tools in market analysis, project prioritization, or any other data analysis need.
What are the 4 quadrants called?
- Quadrant I: This quadrant, often known as "High-High" or "Top Right," represents data points or items that score high on both criteria or measured dimensions, including profit opportunities or high-priority tasks in business.
- Quadrant II: Also referred to as "Low-High" or "Bottom Right," this quadrant refers to data points that score low on one criterion but high on another, often representing improvement opportunities or areas for potential growth.
- Quadrant III (the "Low-Low" or "Bottom Left") represents data points that fall low on both criteria, providing insight into areas of concern or low priorities within an organization.
- Quadrant IV: This quadrant, known as "High-Low" or "Top Left," displays data points that score high on one criterion but low on another - indicating potential areas of strength that need to be leveraged or monitored.
What is the use of Quadrant Chart Templates?
Quadrant chart templates offer a structured visual framework for categorizing and analyzing data based on two specific dimensions or criteria. Their primary function is making complex information more straightforward to comprehend, creating more apparent perspectives, and making them tools in decision-making, planning, and analysis. Quadrant charts provide organizations with an effective market analysis tool, helping them quickly identify high-potential opportunities, prioritize tasks, and allocate resources efficiently. Project managers use quadrant charts to assess task urgency and importance, streamlining project workflow.


 Customer Reviews


