The State of British Columbia’s Forests: A Global Comparison


Department of Forest Resources Management, University of British Columbia, 2424 Main Mall, Vancouver, BC V6T 1Z4, Canada
*
Author to whom correspondence should be addressed.
Forests 2020, 11(3), 316; https://doi.org/10.3390/f11030316
Submission received: 8 February 2020
/
Revised: 4 March 2020
/
Accepted: 10 March 2020
/
Published: 13 March 2020
(This article belongs to the Section Forest Ecology and Management)
Abstract
:The Forest Resources Assessment 2015 is a comprehensive dataset from the Food and Agriculture Organization of the United Nations (FAO), which provides the opportunity to explore some of the emerging topics related to sustainable forest management. This paper assesses how forests in British Columbia, Canada, compare globally on several key sustainable forest management parameters in four domains—biophysical indicators and legal framework, management plans, data management, and stakeholder involvement. The comparison was done against eight jurisdictions, namely Australia, China, Japan, the European Union, New Zealand, the Russian Federation and the USA. To accomplish our objectives, country-specific data on sustainable forest management parameters were extracted from the 2015 FAO’s Global Forest Resources Assessment (FRA). Data specific to B.C. were sourced from Canada’s National Forest Inventory, and National Forest Database. Our results showed that British Columbia (B.C.) has one of the highest proportions of land covered with forests (57%) among all jurisdictions. The total forest area in B.C. has remained stable at around 55 million ha. The current rate of deforestation (6200 ha per year) is among the lowest in all jurisdictions. Data on the extent of primary forests in B.C. is unavailable. However, 22.6 million ha (41% of B.C.′s forests) have been classified as old growth forests (using a definition unique to B.C.). B.C. is the leading provincial forest producer by volume, and produced 67.97 million m3 of roundwood in 2015. With approximately 11 billion m3 of standing timber, roundwood production volume has held steady since 1990. In British Columbia, the National Forest Inventory—British Columbia Program (NFI-B.C.) is used to track and monitor the current status of the forests. It involves both ground plots and remote sensing. The most recent B.C. State of the Forests is one of the most comprehensive reports among all jurisdictions, using 24 topic areas, with each topic comprising several indicators of sustainable forest management. We conclude that British Columbia ranks high among other jurisdictions on several key sustainable forest management parameters with legislation and forest management regimes aiming to meet the environmental, social and economic needs of current and future generations.
1. Introduction
Forests play a critical role in biodiversity conservation and provide ecosystem goods and services, including water, food, timber, shelter, and nutrient cycling, among others. According to the Forest Resources Assessment report, forests cover nearly 30 percent of the Earth’s land area [1]. The concept of sustainable forest management (SFM) has evolved over the past two decades. As a result, it has become increasingly difficult to evaluate whether forest management is indeed sustainable [2]. Forest management encompasses a range of aspects related to sustainability and requires the use of a range of indicators, bundled into a framework [3]. The criteria and indicators (C and I) framework is by far the most widely used approach of evaluating forest management at national, regional or forest management unit (FMU) scales [4]. In many jurisdictions, a number of SFM frameworks are being implemented that are based on key criteria and indicators in order to monitor and assess the status of, or progress towards, SFM objectives. These frameworks have allowed jurisdictions to improve their monitoring and information reporting frameworks, most commonly demonstrated through regular ‘State of the Forest’ reporting [5].
British Columbia is Canada’s western-most province. British Columbia is a unique forest jurisdiction, in that it contains vast and diverse forests and rangelands and 95% of its land base comprises public land [6]. Much of this ecological diversity is a result of its northwest-southeast mountain topography, that has a significant influence on climate and vegetation. Most of B.C.′s forests (83%) are dominated by conifers: lodgepole pine, spruce, fir, hemlock, redcedar, and Douglas-fir are the most common trees [7]. Forestry is one of the major economic engines of B.C.’s economy and supports many B.C. communities. The B.C. forest industry consists of over 7000 businesses and employed 59,942 people in 2016 [8]. In 2016/17, the B.C. forest sector generated a revenue of $860 million, that supported public services in other sectors such as health, education, infrastructure and transportation. Over 90% of B.C.’s forestry output is exported. In 2017, the B.C. forest industry exported $9.7 billion in wood products and $4.4 billion in pulp and paper products [9].
Sustainable forest management is a priority for the government of British Columbia, and to achieve this, B.C.’s forests are managed to sustain the multiple economic, social and environmental benefits they provide to society and to minimize the environmental impacts of forest operations [10]. British Columbia’s Forest and Range Practices Act is the main legislative framework that provides results-based regulations to ensure crown lands provide a mix of economic, social and environmental benefits. B.C. has adopted criteria and indicators for sustainable forest management, to monitor and assess the provincial performance in achieving its sustainable forest management objectives. These set out a range of environmental, economic and social indicators. Sustainable forest management criteria and indicators provide a framework for describing and measuring the state of B.C.’s forests, forest management practices and progress in sustainability. Criteria and indicators provide guidelines to track changes and serve as a valuable tool for targeting research and developing sustainable forest management policies. The B.C. State of the Forests reporting process makes a significant contribution to the knowledge required for informed management and ensuring the right decisions are made about how these important natural assets are sustainably managed. However, there is a significant gap in reporting, as the most recent report for B.C. was published in 2010.
While State of the Forests reports provide critical information to monitor the progress towards sustainable forest management, the reporting system varies from country to country due to a lack of harmonization and differences in approach [11]. In most cases, reporting frameworks are based on the Montreal Process Criteria and Indicators, a set of seven criteria and 54 indicators. As the reporting of criteria and indicators is inconsistent among countries, it is difficult to assess how countries compare on key sustainable forest management parameters using State of the Forests reports. Extensive country-level forest data are available through the Food and Agriculture Organization’s (FAO) Global Forest Resources Assessment 2015. However, comparative studies among various jurisdictions are critically lacking. This research fills this gap by comparing B.C. with seven jurisdictions using key forest variables. The study analyzes and compares trends in key sustainable forest management parameters that are important globally. Such evidence-based information on the status and trends in forests and forest management could provide vital input to further discussions on the management of B.C.’s forest resources, covering a broad array of topics, including forest policy, wood supply, biodiversity conservation, climate change and forest products. By presenting a sub-set of data relevant to sustainable forest management derived from the Global Forest Resources Assessment 2015 and B.C. data from various sources, the relevant stakeholders, including governments, academia, industry and international organizations are provided with information that can help determine how B.C. compares globally for key sustainable forest management parameters.
2. Methods
Following MacDicken et al., we adopted a broad approach by performing a comparative analysis on four key domains, which included sustainable forest management parameters that are also included in the Montréal Process Criteria and Indicators [12]. The four domains were: biophysical indicators and legal framework, management plans, data collection and management, and stakeholder involvement. The rationale for selecting these four key domains was to examine the information that is needed to provide support for long-term sustainable forest management. These four domains provide analyses of key parameters for the enabling environment to gain a global insight into progress in implementing enabling and implementing SFM at national and operational levels. Comparison across these four domains therefore provides critical information that can help determine where and how much progress is being made towards establishing and maintaining the enabling conditions for sustainable forest management.
Biophysical indicators and legal framework-related data were collected on a number of key forest parameters, such as the area of forest and other woodlands, changes in forest area, deforestation trends, primary forests, and policies and legislation supporting sustainable forest management. At the operational level, our analysis was based on forest area under forest management plans (FMP), including forests designated for multiple-use, forests available for wood supply, and trends in wood removals. Data collection and management were measured by the types of forest resource monitoring information and progress reporting available. To assess progress in reporting, we examined the latest country reports from six jurisdictions participating in the Montréal Process initiative, to analyze if the reports are based on the agreed Montréal Process Criteria and Indicators. The main source for the State of Forest Country Reports was the Montréal Process website. Some reports are directly accessible from the website, but for others, site links provide access to reports stored on national websites. The B.C. report is accessible through a link to the B.C. government website, where the latest version (2010) of State of British Columbia’s Forest is available. As the European Union is not a signatory to the Montréal Process, we used the State of Europe’s Forests 2015 report, which was launched at the seventh FOREST EUROPE Ministerial Conference, held in Madrid, Spain, in October 2015 [13]. Finally, stakeholder involvement was measured by the presence of a national stakeholder platform in selected jurisdictions.
The selected jurisdictions represent a subset of countries from amongst the Montréal Process signatory countries. B.C. was compared against Australia, China, Japan, New Zealand, Russia and the United States. The European Union was included to enhance regional representation. This sample was based on factors such as global and regional significance in terms of forest extent and forest trade and availability of information. The rationale for selected jurisdictions was based on forest area comparable to BC, as well as relatively similar socio-economic conditions. Although our sample mostly included jurisdictions that are developed economies with social conditions similar to B.C, for broad representation, we also included one jurisdiction from economies in transition, i.e. Russia, as well as a developing economy, China [14].
Data specific to B.C. were sourced primarily from Canada’s National Forest Inventory and the National Forestry Database. However, where data for some parameters were unavailable from these sources, other sources were consulted, including the State of British Columbia’s Forests report and previous research reports published by the Government of British Columbia.
Country specific data were extracted from the FAO’s Global Forest Resources Assessment 2015 (FRAs), which offers opportunities to collate and analyze data on these parameters across a long time period at a global scale. FRAs contain information on the global state of forests that drive policy and resource flows at global, regional and national levels. Hence, over the past decades, FRA data have supported decision making by various international bodies including FAO itself, the UN Framework Convention on Climate Change (UNFCCC), the Convention on Biological Diversity, the UN Convention to Combat Desertification, and the UN Forum on Forests [15].
3. Results
3.1. Biophysical Indicators and Legal Framework
3.1.1. Forest Area and Trends
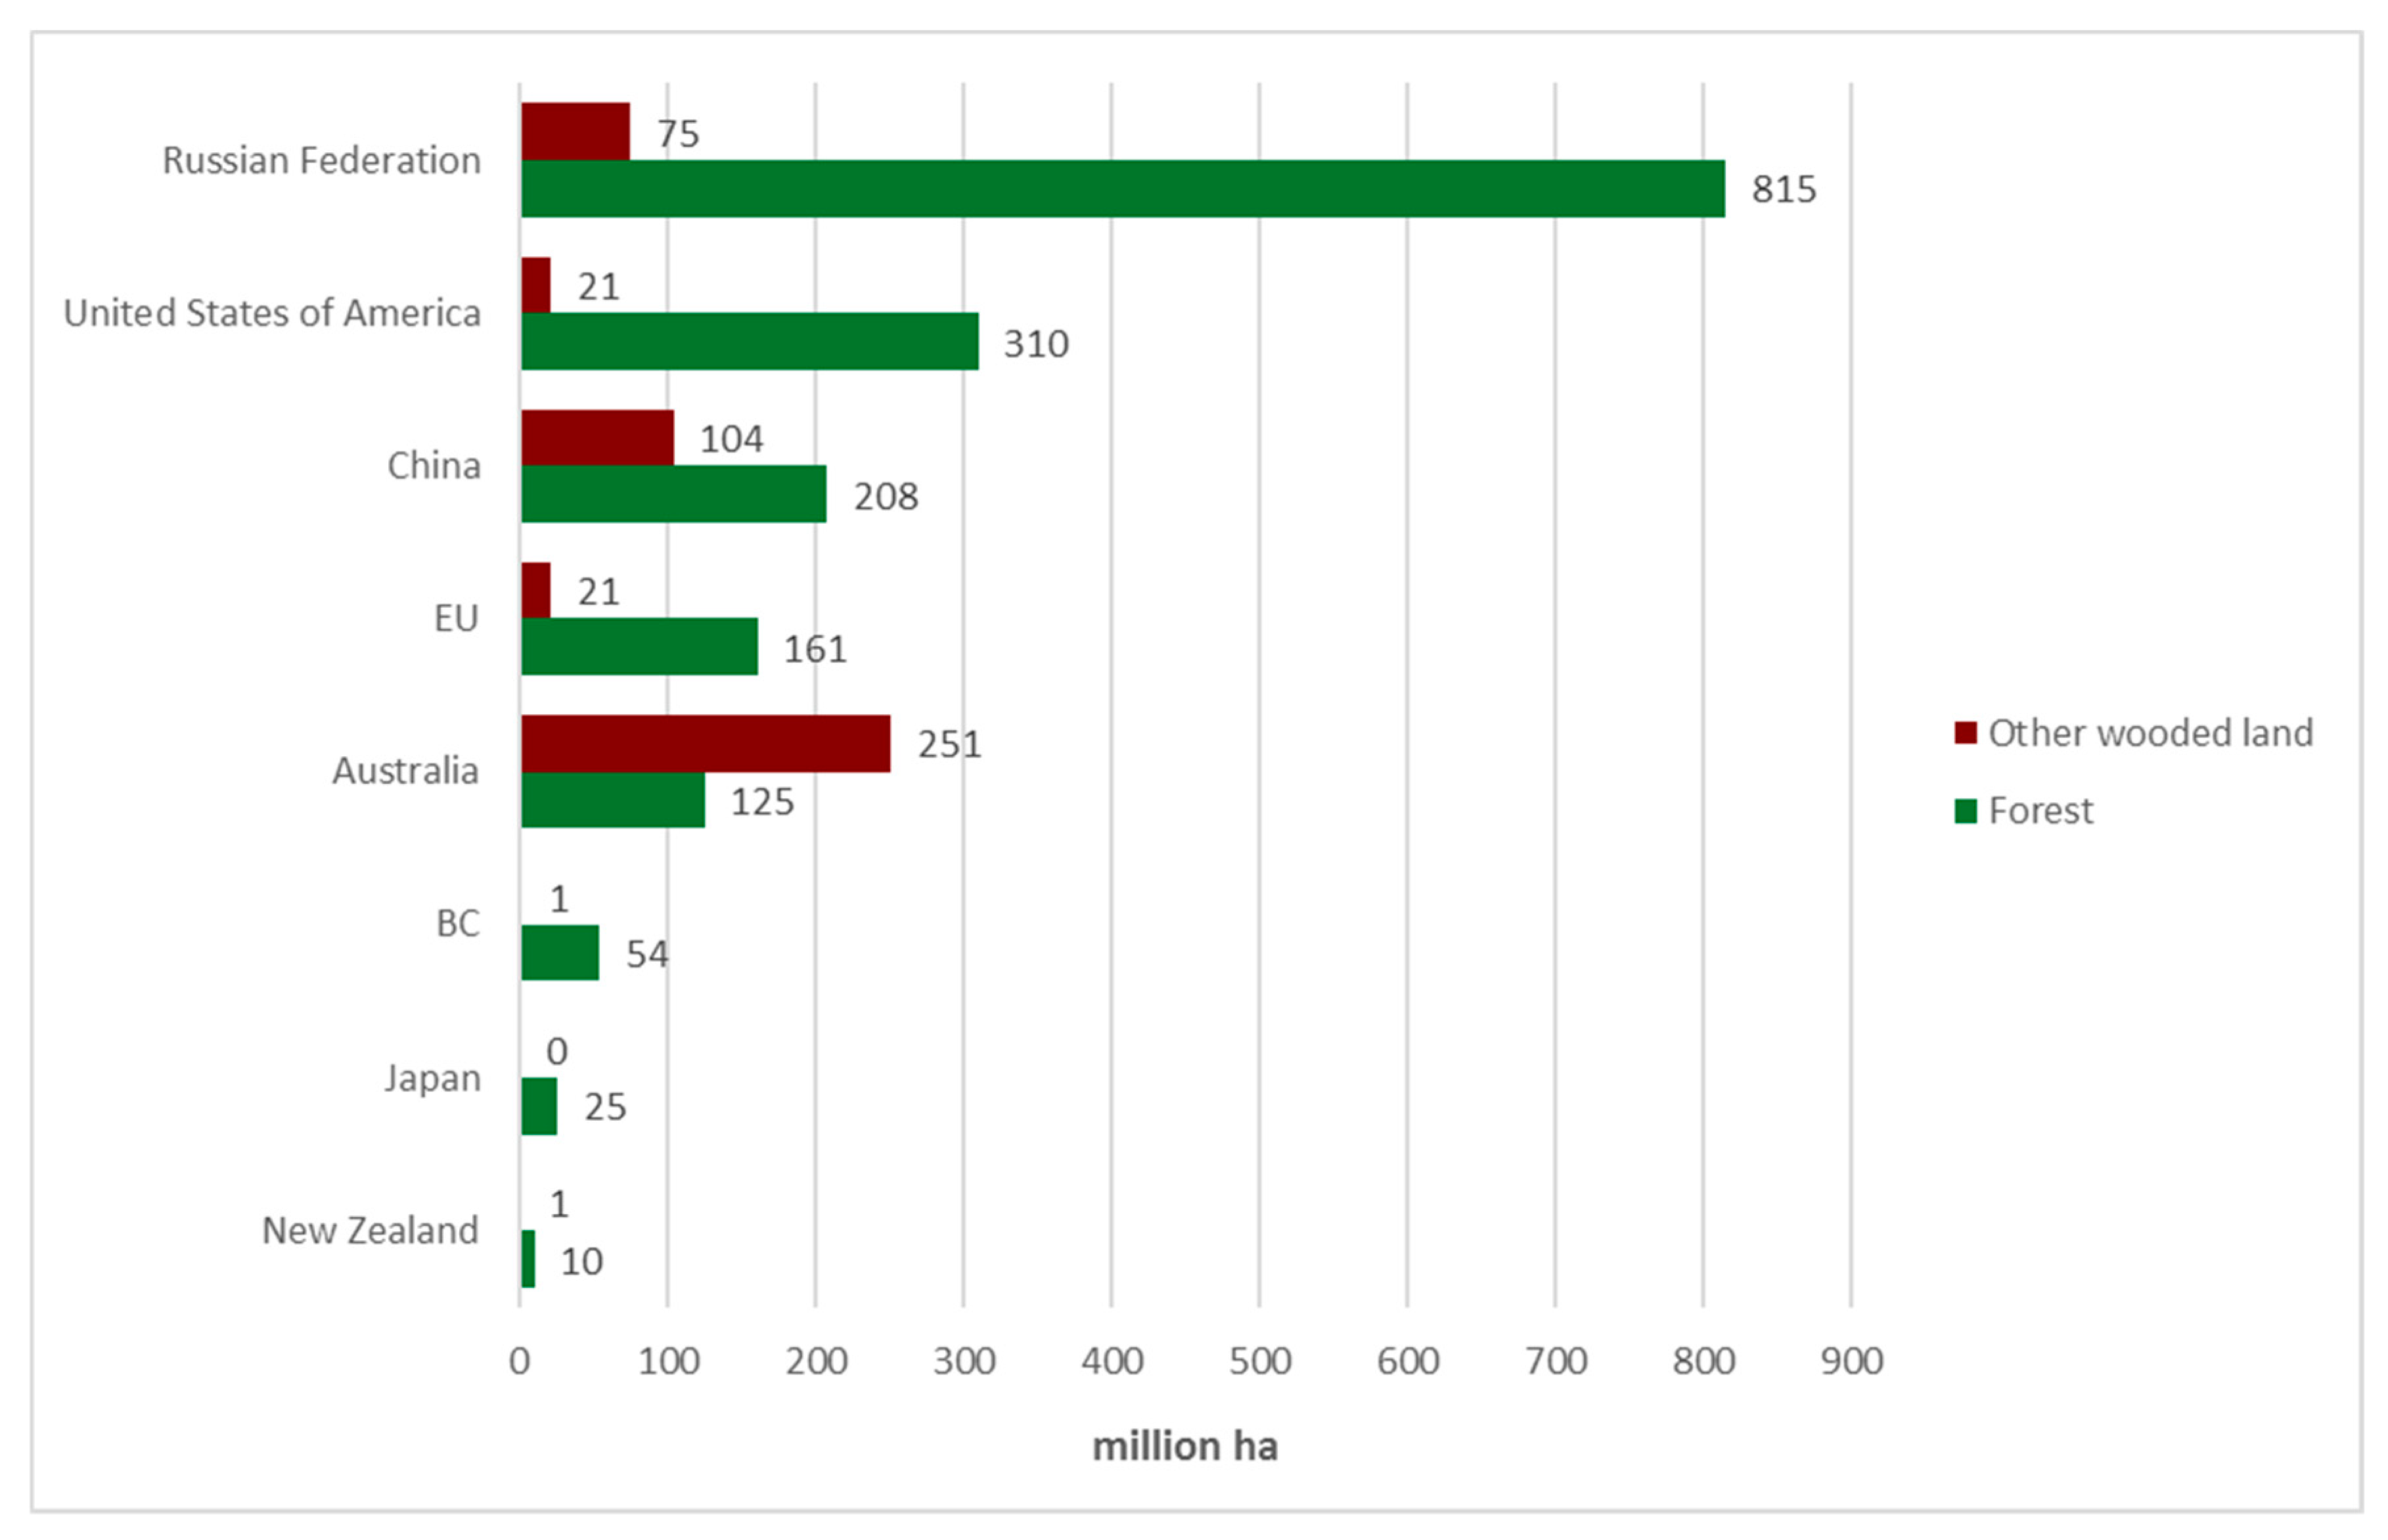
Figure 1 shows the total forest area and other wooded land in eight selected jurisdictions, as reported by the FAO in 2015. Russia dominates over all other countries in terms of the total forest area, with a reported forest area of 815 million ha in 2015. As of 2015, the United States had 310 million ha of forest area and has the fourth biggest forest area in the world. China reported a total forest area of 208 million ha in 2015. The European Union reported 161 million ha of forest area. British Columbia has 54.4 million ha of forests. In addition, approximately one million ha of B.C. have a sparse tree cover, which is not considered forest.
Australia has about 125 million ha of forest, of which 123 million consists of natural forest, and two million ha are softwood and hardwood plantations. Japan and New Zealand reported 25 million ha and 10 million ha of forest area, respectively.
The distribution of forest and other wooded land by country and region is quite different from that of the population. China is the most populated country in this study, with roughly 50% of the total population in the jurisdictions considered here (2.4 billion people), but has only 10% of the area of forest and other wooded land amongst the countries being assessed. The European Union has more than a quarter of the population and 8% of the forest and other wooded land. B.C. has a population of 4.7 million, with most people living in the greater Vancouver and Victoria areas in the extreme southwest of the province. It has more land area than any European country except Russia, and is larger than any U.S. state except Alaska. It contains 3% of the forest and other wooded land amongst the countries being assessed.
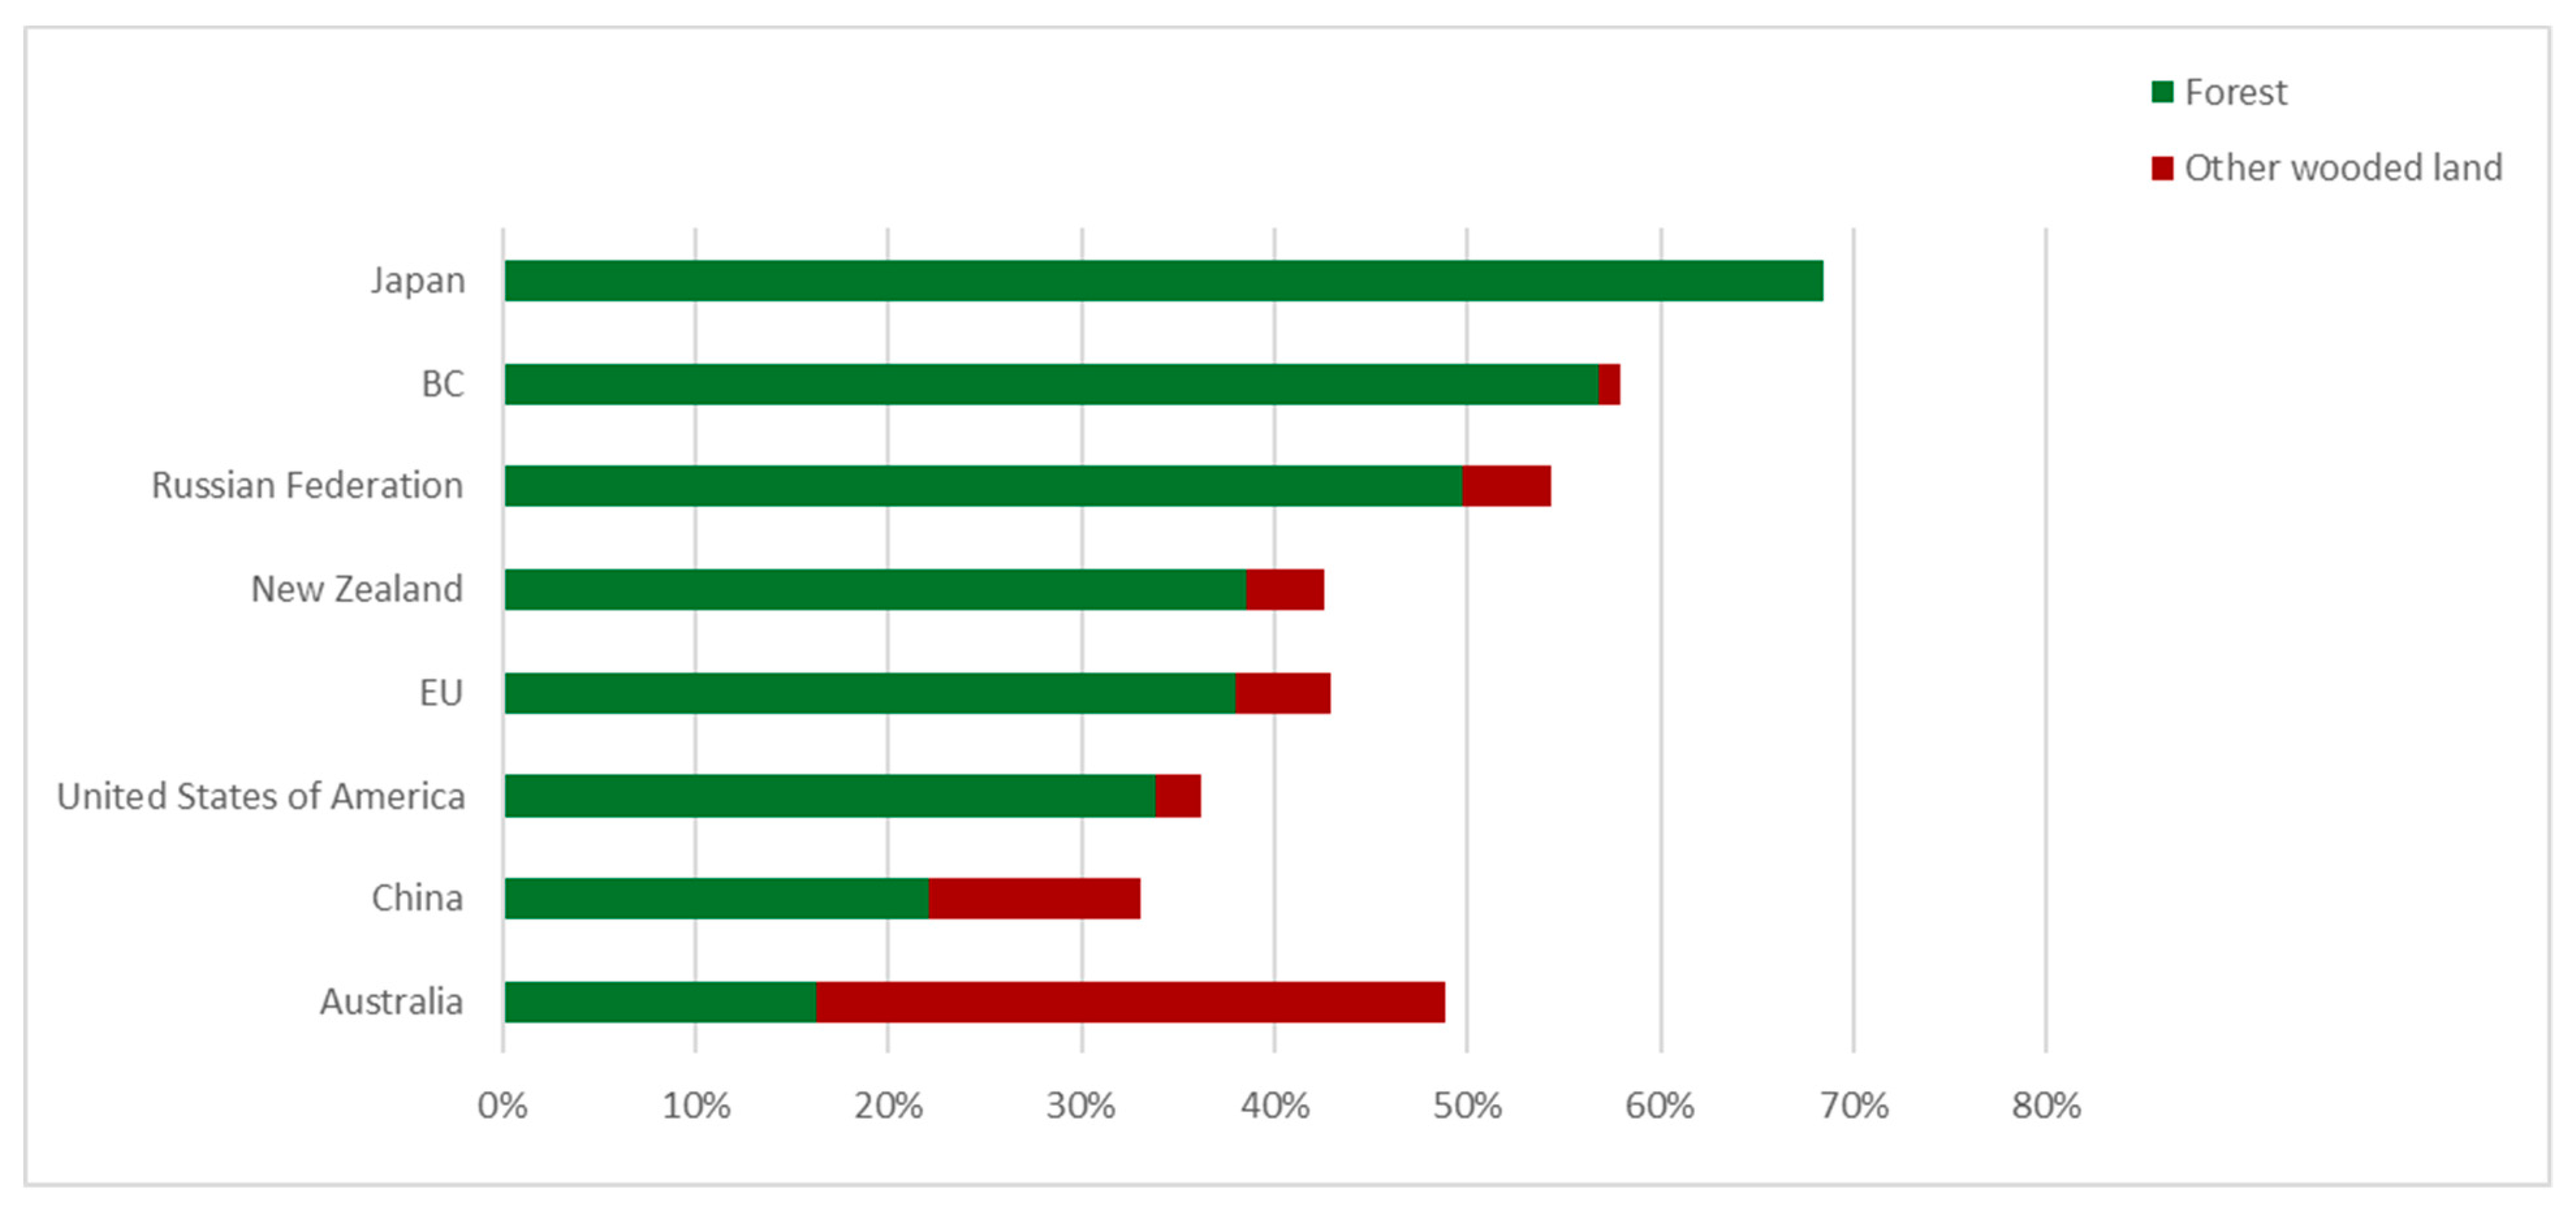
Over 68% of Japan is covered with forest and other wooded land, which is as high as Sweden, and is exceeded only by Finland with 73%. B.C. ranks second in terms of forest as a percentage of land area, with 57% of the land covered with forests and other wooded land. New Zealand has 42% of its land covered with forests and other wooded land. Slightly over one-third of land in the United States is covered with forests and other wooded land. The percentage of land covered by forest and other wooded land in the EU is less than 40% (Figure 2). Within the European Union, there is a contrast between the relatively high cover of forest and other wooded land in the Nordic countries, compared with the low cover in North-Western Europe. More than half of Russia’s land area is covered with forest and other wooded land (54%). In China, 22% of land is forested, with an additional 11% comprising other wooded land. Although natural forest makes up only 16% of Australia’s land cover, other wooded land makes up an additional 32% of the land cover. In most jurisdictions, other wooded land accounts for a relatively small part of the total forest and wooded land. However, in Australia, the area of other wooded land is remarkably high, both in absolute terms, 250 million ha, and relative to its total land area.
Information regarding trends in forest area in B.C. is fragmented. Forest cover data in B.C. have been collected and maintained since the 1950s and the forest area recorded in forest inventories increased from 1957 to 2000. However, much of this change was due to changes in inventory methods and it is not clear how much actual change in the forest area occurred during this period. According to the first edition of The State of British Columbia’s Forests, the forest area in 2000 was estimated at 59 million ha. A further 4 million ha were designated as other wooded land with woody shrubs, stunted trees or scattered trees. In the third edition of The State of British Columbia’s Forests, forest cover was estimated at 55 million ha, with a further 3.7 million ha classified as other wooded land with woody shrubs, stunted trees, or scattered tree cover. The apparent decline in forest area was primarily due to the adoption of a new definition of forests.
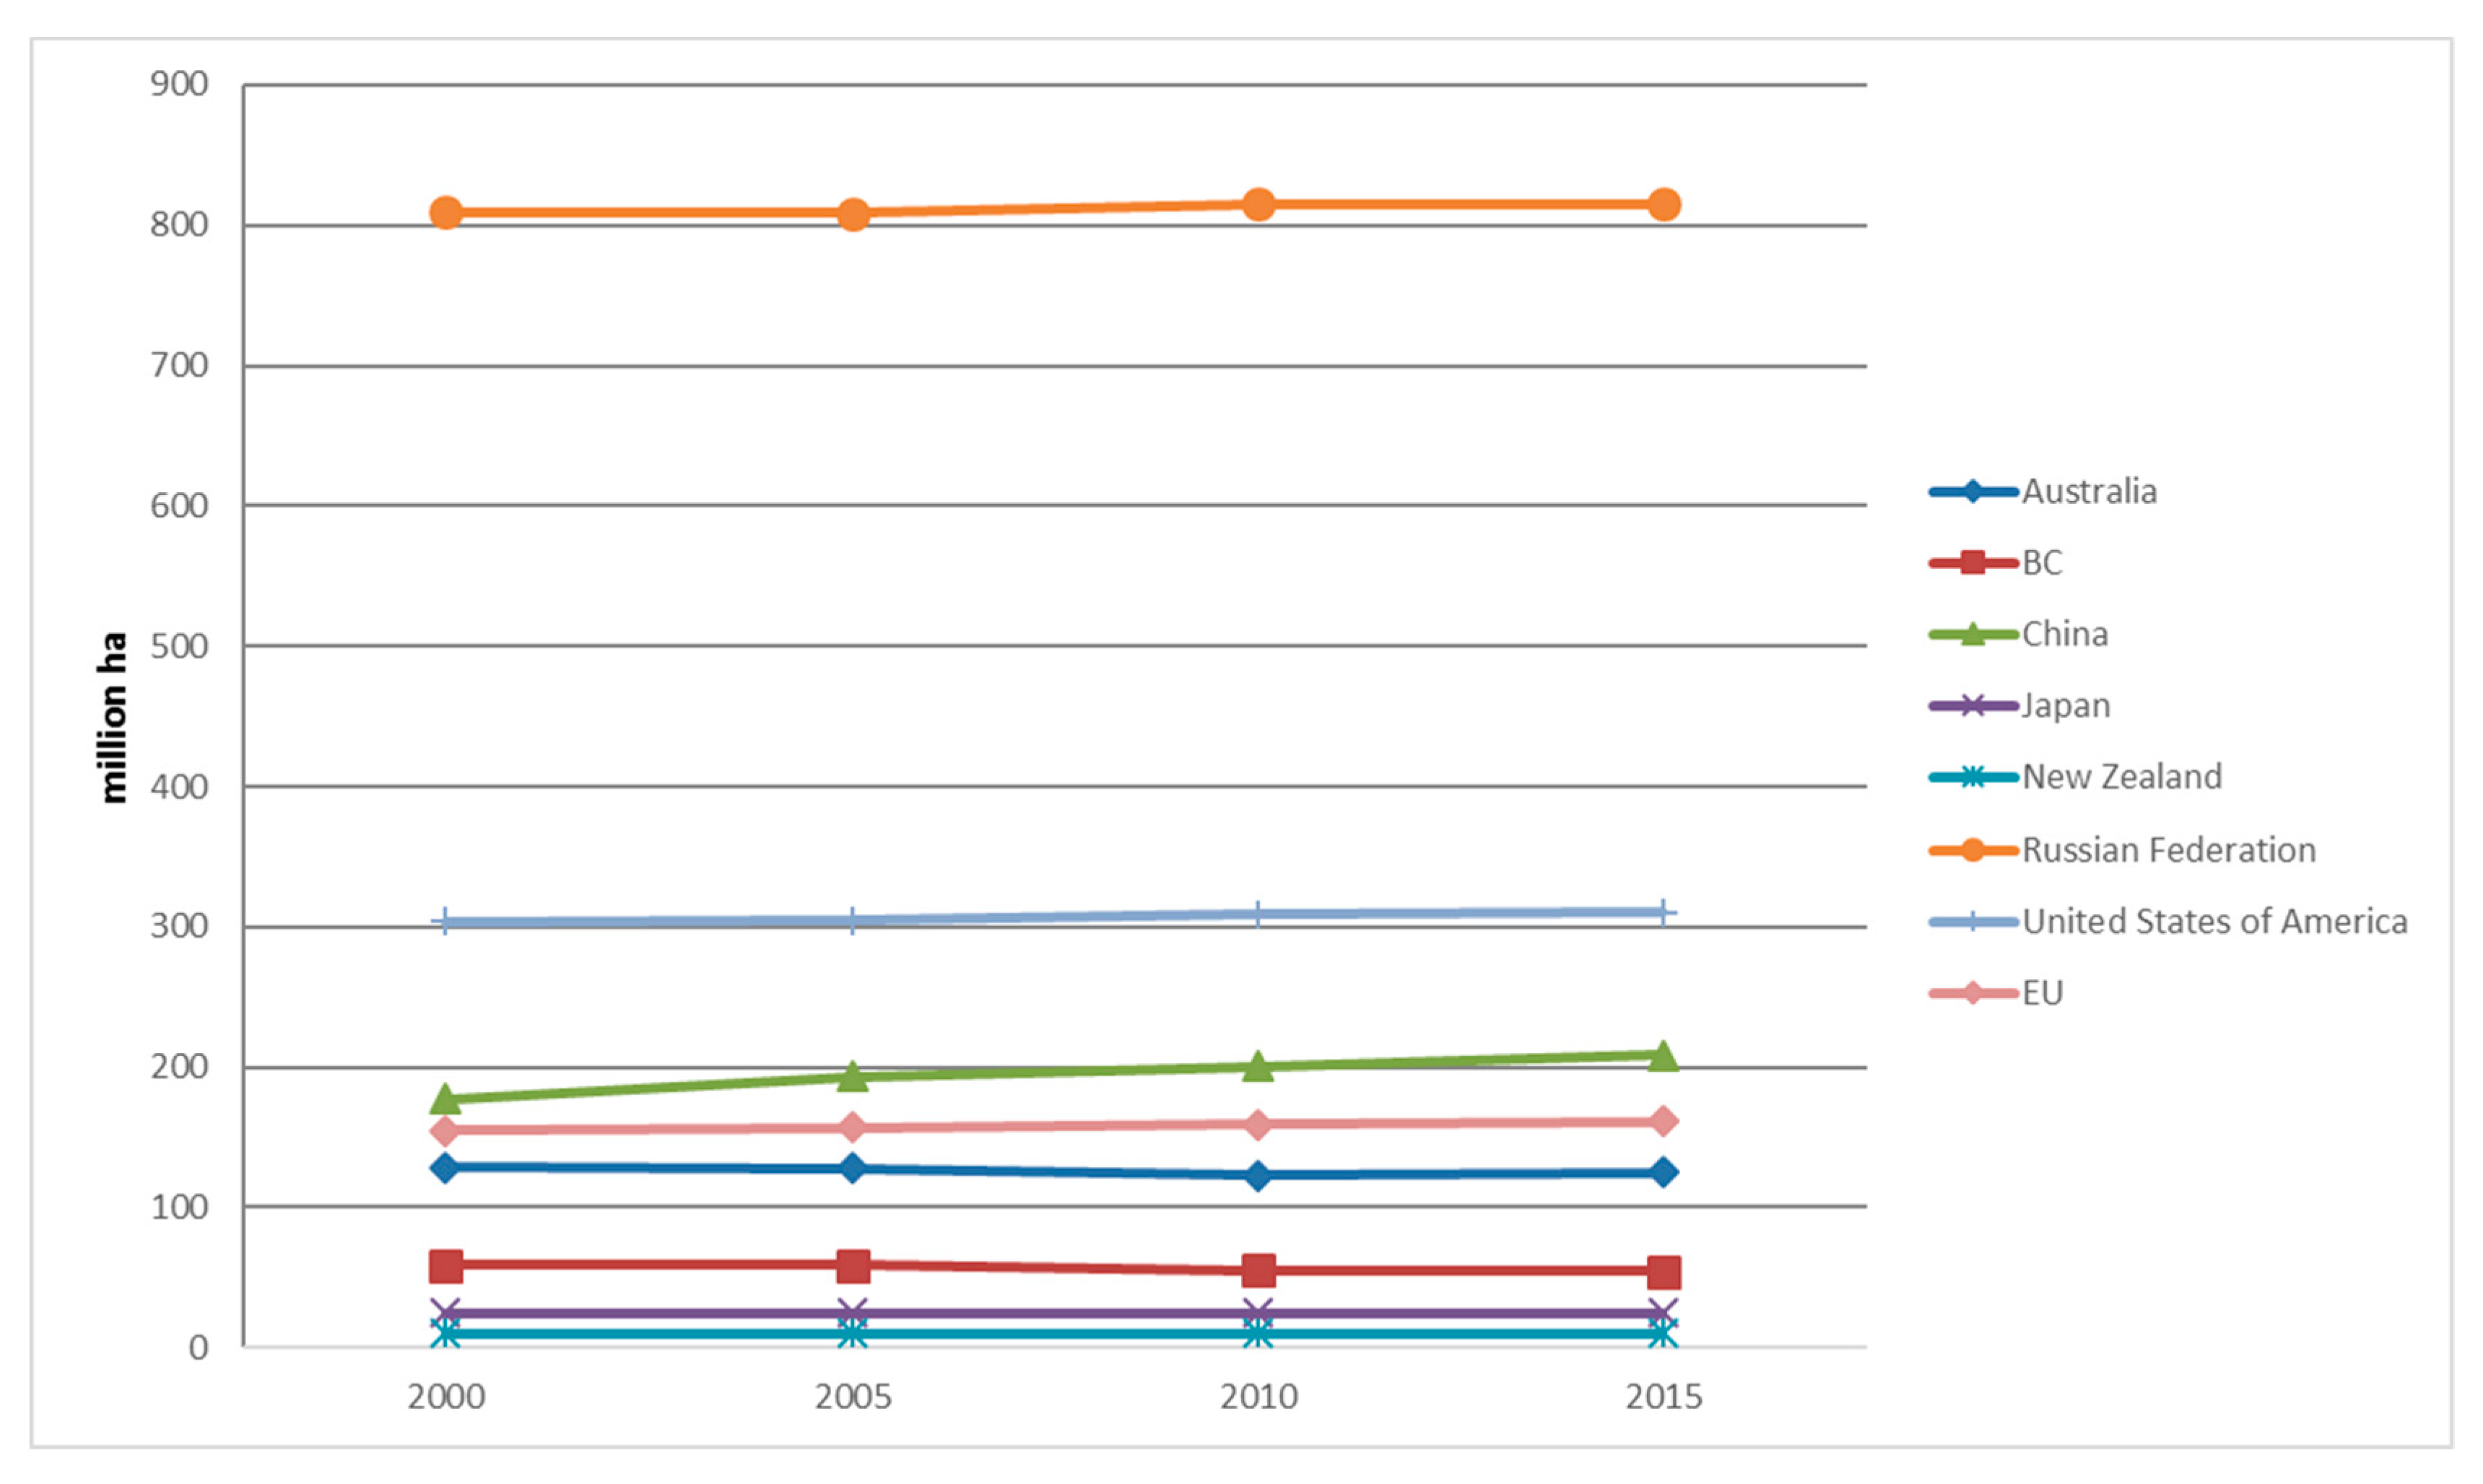
Japan, New Zealand, and Russia also reported no annual change in their forests from 1990 to 2015. China had the highest rate of forest expansion, with 1.5 million ha (0.8%) being added annually from 2010 to 2015. Both the United States and the EU reported a slight annual increase in their forests. The United States had an annual increase of 518,000 ha per year (0.2%) from 2000 to 2010, and 275,000 ha per year (0.1%) from 2010 to 2015. The EU had an annual increase of 449,000 ha per year (0.3%) from 2000 to 2010, with a slight decline in the rate of expansion from 2010 to 2015, which was reported at 369,000 ha per year (0.2%). There was a net increase in forest area in Australia between 2010 and 2015, at a rate of 308,000 ha (0.2%) annually (Figure 3). Due to the discrepancy in reporting forest expansion/contraction among countries, a much better measure is the growing stock, presented in Table 1, as this presents what is actually on the ground at a given point in time.
3.1.2. Deforestation
The FAO defines deforestation as “the conversion of forest to other land use or the permanent reduction of the tree canopy cover below the minimum 10 percent threshold [1].” In British Columbia, the deforestation rate over the last 30 years has decreased, from over 15,000 ha per year to just over 6,200 ha per year. The extent of deforestation is small (0.01%) relative to the total area of forest in the province (54.4 million ha). An estimated 60% of deforestation in British Columbia occurs on crown land and 40% on private land.
Some countries, including the U.S.A. and Japan, did not report any data on deforestation. China lost 62,000 ha of forest per year between 2005 and 2010. In the European Union, the rate of deforestation has slightly increased, from 70,000 ha per year in 1990 to 103,000 ha per year in 2010. Russia has reported zero forest loss since 1990 (Figure 4). The figures for China and the European Union represent the absolute amounts of forests lost, rather than the net change in forest area, and in both, the net area of forest has been increasing (Section 3.1.1).
3.1.3. Primary Forests
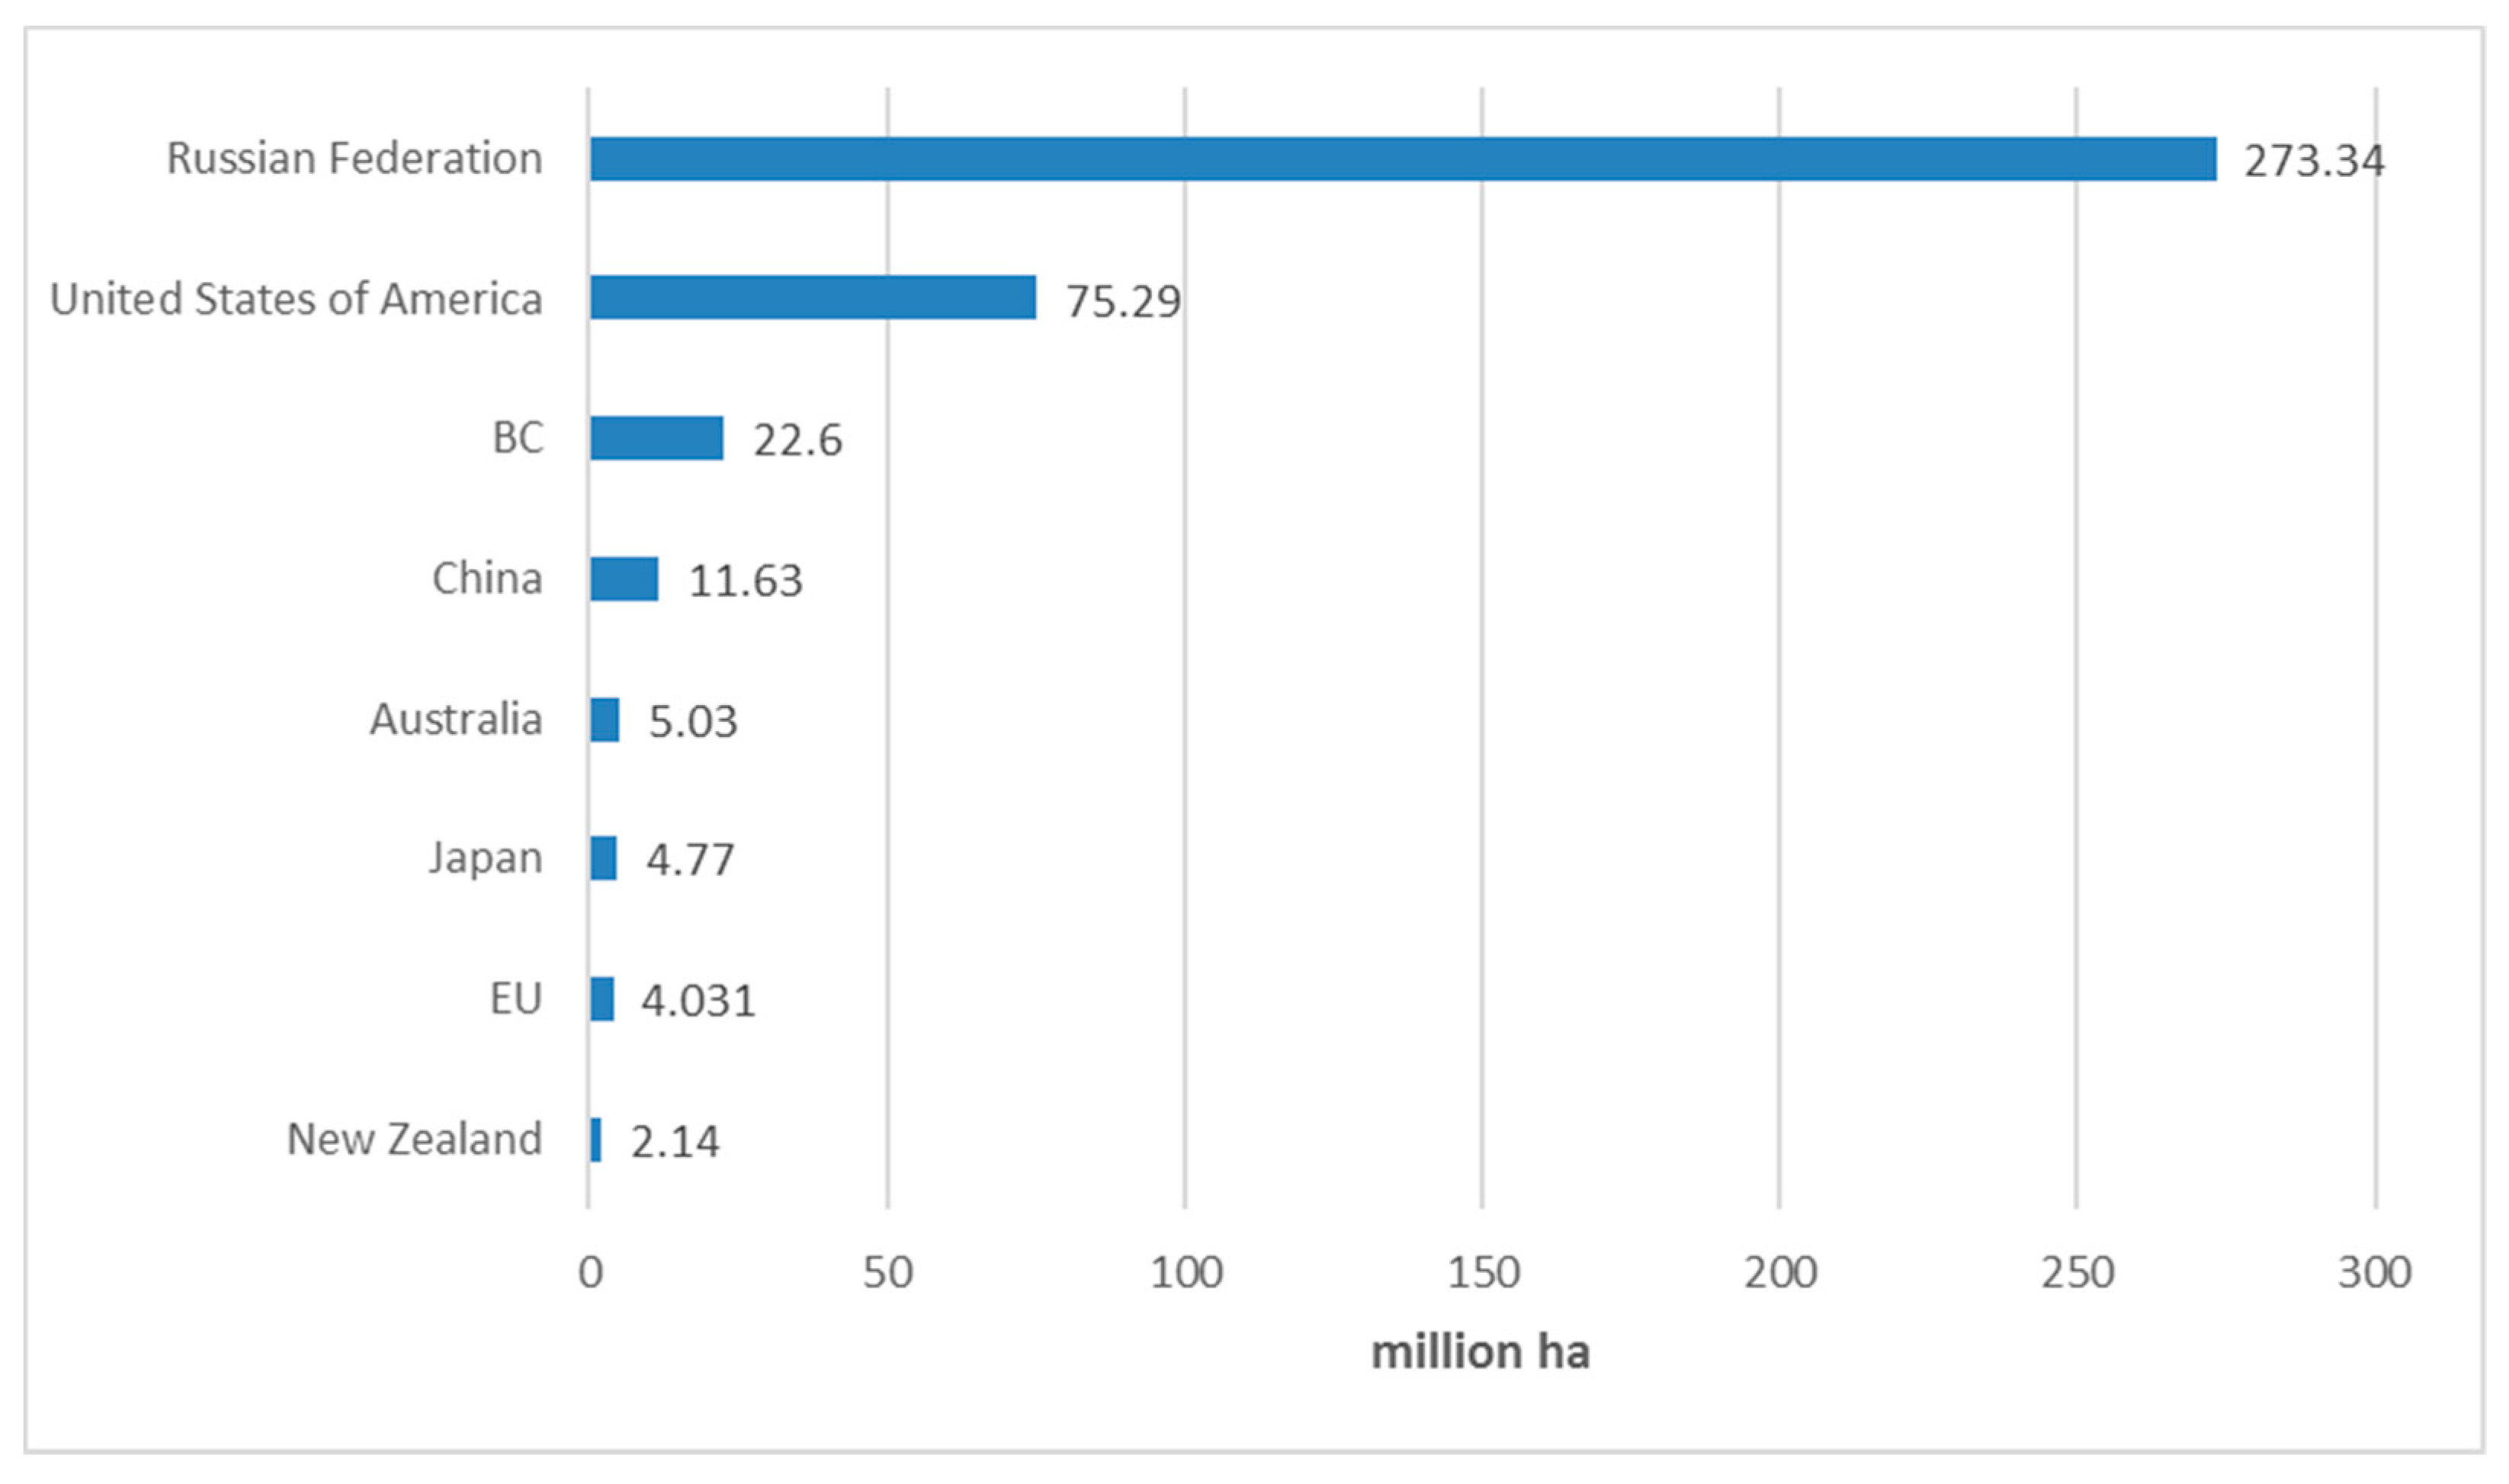
Russia has 273 million ha of primary forest, more than any other jurisdiction, with a reported increase of 31 million ha since 1990. The United States had 70 million ha of primary forest in 1990, which increased to 75.3 million ha in 2015. Japan reported that its primary forests have increased in area by 1.2 million ha since 1990 (Figure 5). A key point here is that, according to the reporting done by individual countries, the area of primary forest in a country can increase, despite the definition of primary forest provided by FRA 2015, i.e., “naturally regenerated forest of native species, where there are no clearly visible indications of human activities and the ecological processes are not significantly disturbed.” [1]
Information on the state of primary forests was unavailable for British Columbia. We therefore relied on proxies, such as the extent of old growth forests and forests within national parks and conservation areas, to estimate the extent of primary forests. We stress that old growth forest, as defined in B.C., or the area of forests contained in parks and other areas in B.C., cannot be equated with the area of primary forests, as defined by FRA 2015. In B.C., forests over 140 years old exist in all 16 biogeoclimatic zones and cover 22.6 million ha (41% of B.C.′s forests). Of this area, 7.1 million ha (13% of B.C.′s forests) are forests over 250 years old (“B.C.’s coastal forests are considered old growth if trees are more than 250 years old. In the Interior, where trees have a shorter life span and wildfires are more common, old growth is defined as more than 120 years of age for forests dominated by lodgepole pine or broadleaf species, and more than 140 years for all other forests such as Englemann spruce, white spruce and Interior Douglas-fir.” https://www.for.gov.bc.ca/hfd/pubs/docs/mr/mr112/page14.htm).
3.1.4. Policies and Legislation Supporting Sustainable Forest Management
Most of the jurisdictions covered in this study reported the existence of national level policies and legislation to support sustainable forest management. In the case of Russia, there were no policies or legislation covering private forests, reflecting the ownership status in Russia, where all forest land is owned by the State. Australia reported policies and legislation at all levels for both public and private forests. British Columbia has a comprehensive framework of forest law, that enables and supports sustainable forest management at regional, provincial and local levels.
Japan reported no regional level policies or legislation. In the U.S.A., policies to support sustainable forest management at the regional level were present, but no legislation of such at the regional level was reported (Table 2). Many of these differences are likely the result of the governance structures of the countries, and the levels of governance jurisdiction have over forests. In addition, there are likely to be differing interpretations of what constitutes a region.
3.2. Management Plans
3.2.1. Forest Area Designated for Multiple Use
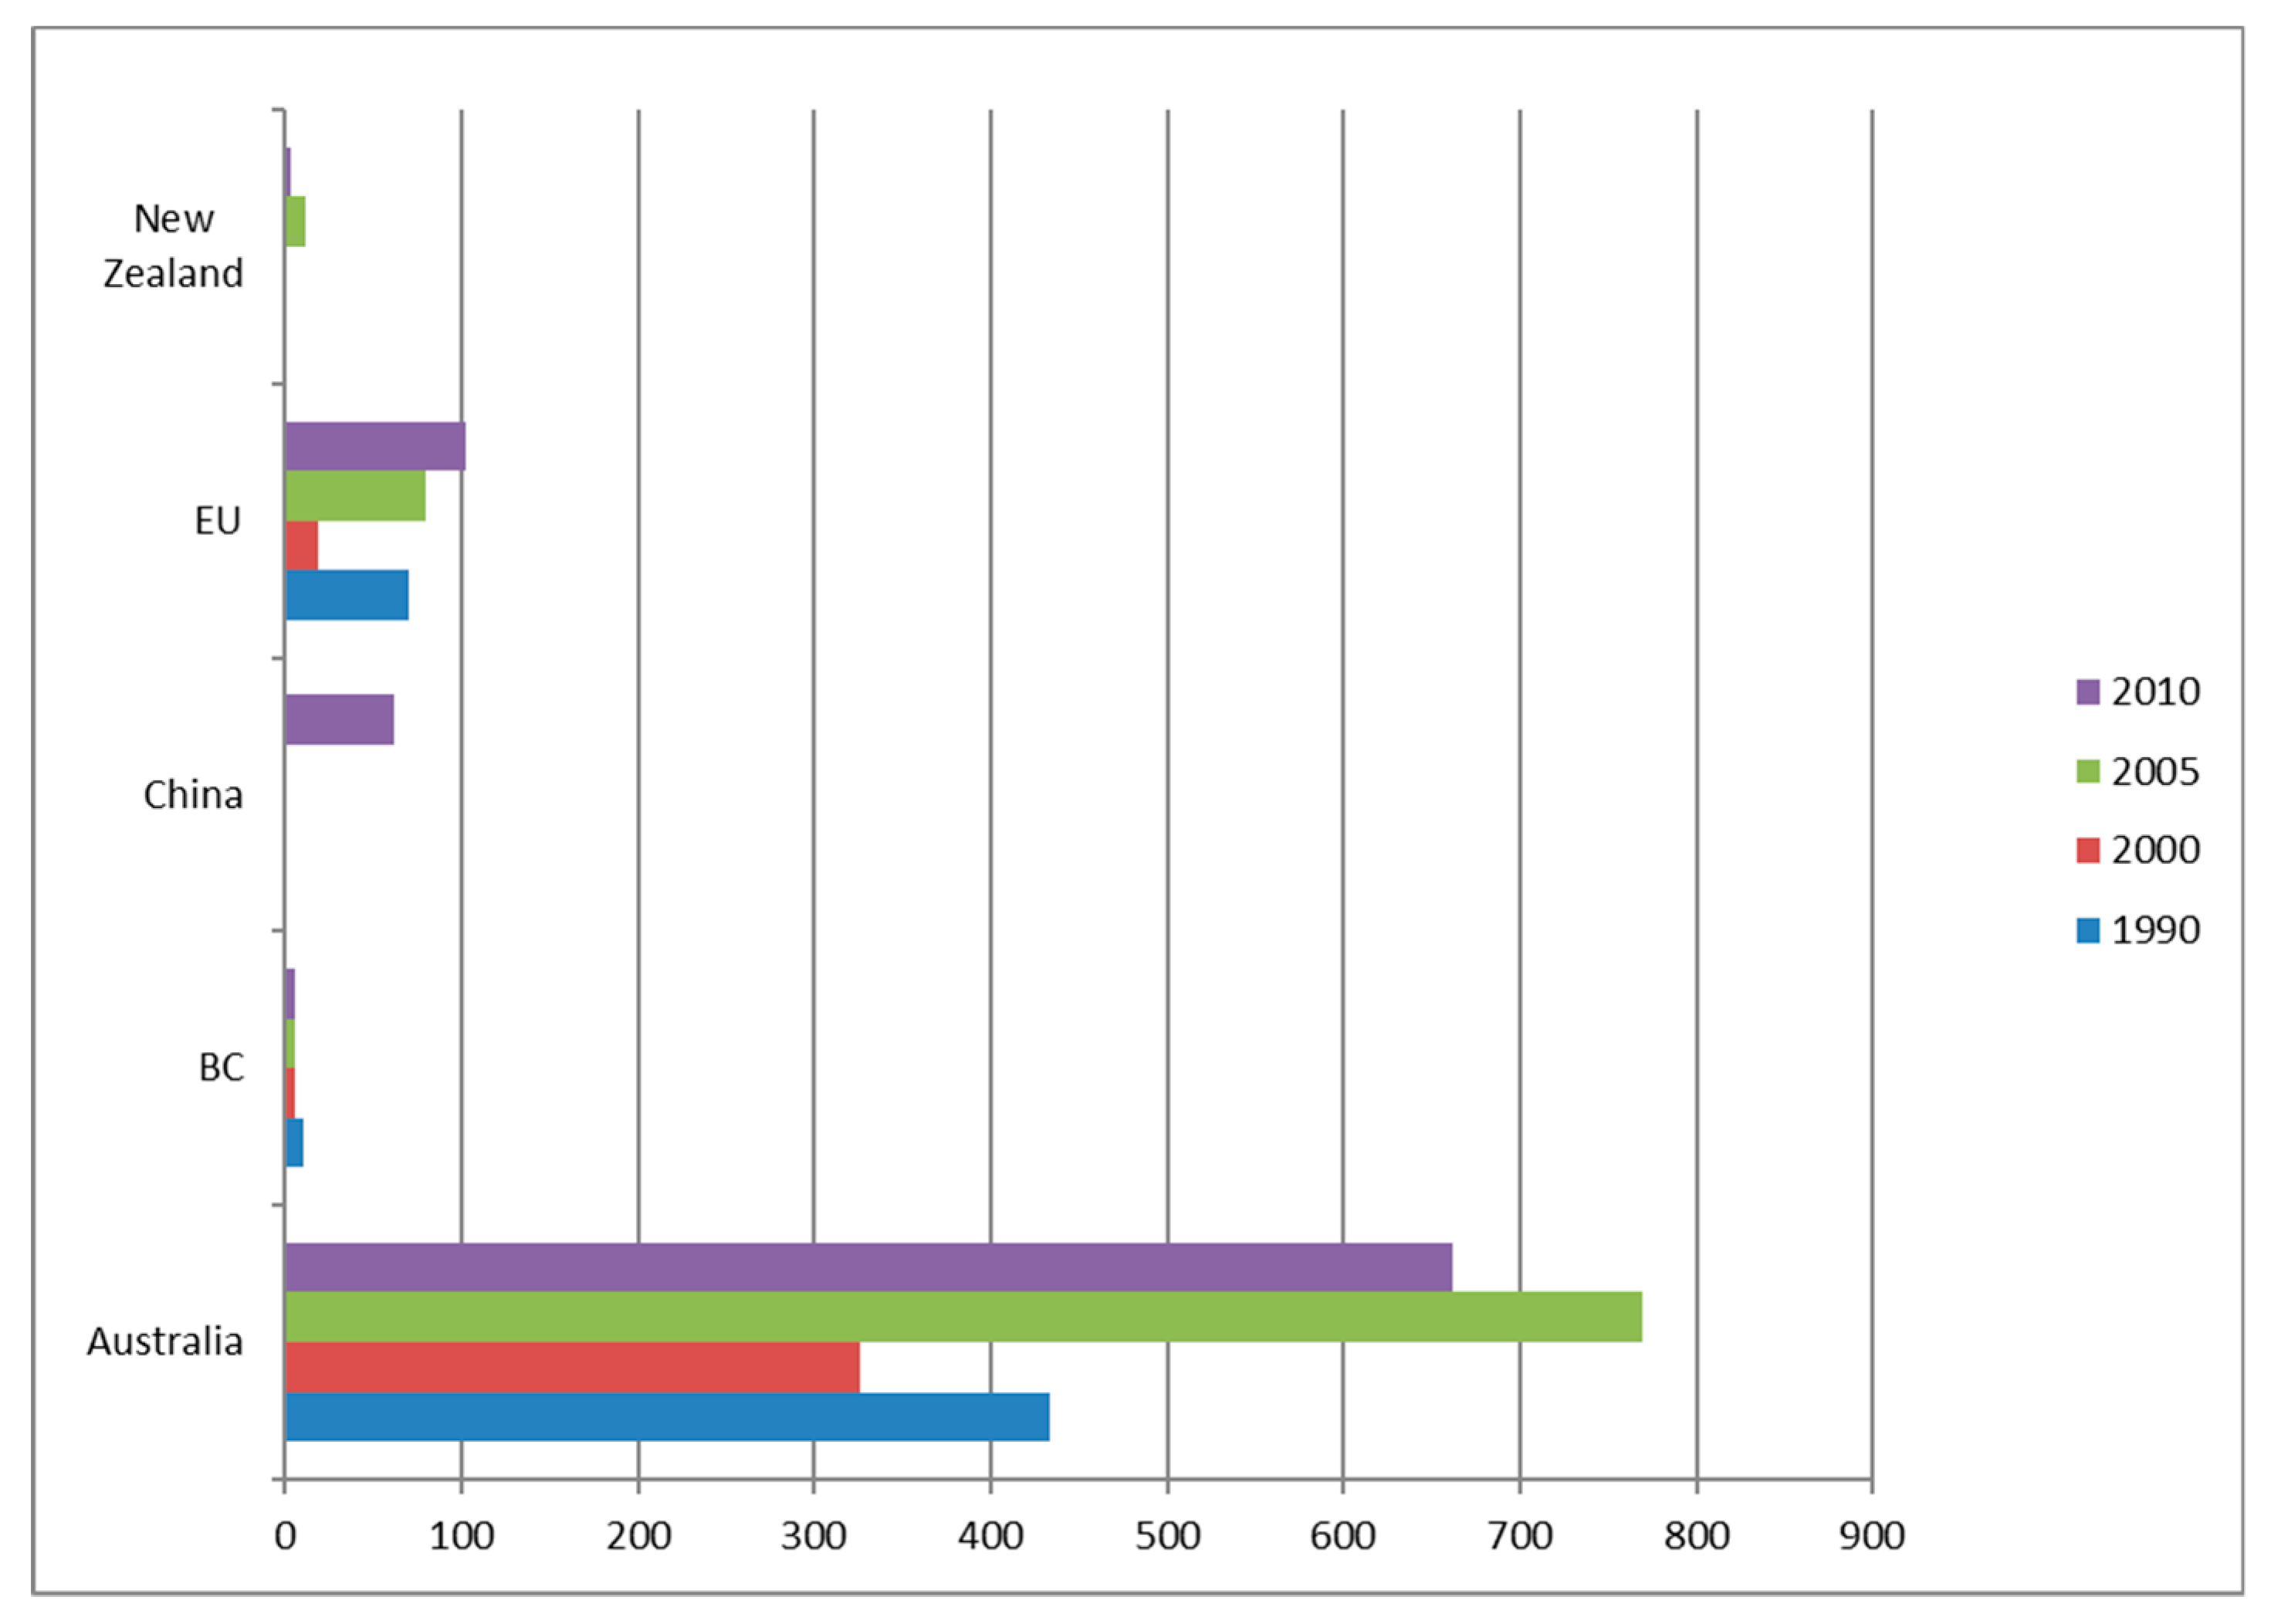
B.C. designated 85% of its forest for multiple use in 1990. Current data on the area of forest designated for multiple use in B.C. are unavailable. This proportion is not assumed to have changed significantly in recent years, as no significant changes in forest cover have occurred since the 1990s, and also because the overall proportion of forest area designated for multiple use in Canada is 85%, a figure that has remained unchanged since the 1990s. Multiple-use forests registered the greatest gains in China, and registered the greatest declines in Russia and the U.S.A. China has more than doubled the forest area designated for multiple use since 1990. Forest area designated for multiple use in China has increased from 20 million ha in 1990 to 41 million ha in 2015, which constitutes 19% of the total forest area in China. The equivalent figure in Japan in 2015 was 24 million ha. New Zealand designated only a fraction of its total forest for multiple use: 0.1 million ha in 2015, up from 0.06 million ha in 1990. The U.S.A. has also reported a decline in the forest area designated for multiple use, from 107 million ha in 1990 to 88 million ha in 2015. The European Union has maintained a consistent forest area for multiple use from 1990 to 2015, at around 50 million ha (Figure 6).
Australia reported a decline of 8 million ha in its forest area designated for multiple use in 2015, with 50 million ha in 2015, compared to 58 million ha in 1990. Russia has the greatest forest area designated for multiple use, despite a significant decline in 2015, when it was reported at 178 million ha (21% of the total forest area), compared to the baseline of 208 million ha in 1990.
3.2.2. Production/Managed Forests
The provincial forests of British Columbia are divided into 74 management units, comprising 38 timber supply areas (TSAs) and 36 tree farm licences (TFLs). About 22 million ha of the forest in British Columbia is known as the timber harvesting land base (THLB); the area where the government has expressed the intent to have the trees harvested. About three million ha of B.C.’s forests (5%) are privately owned, with an estimated 20,000 private forest owners. Of these three million ha, over 908,000 ha are classified as managed forests. Other classifications include forested residential and forested farmland.
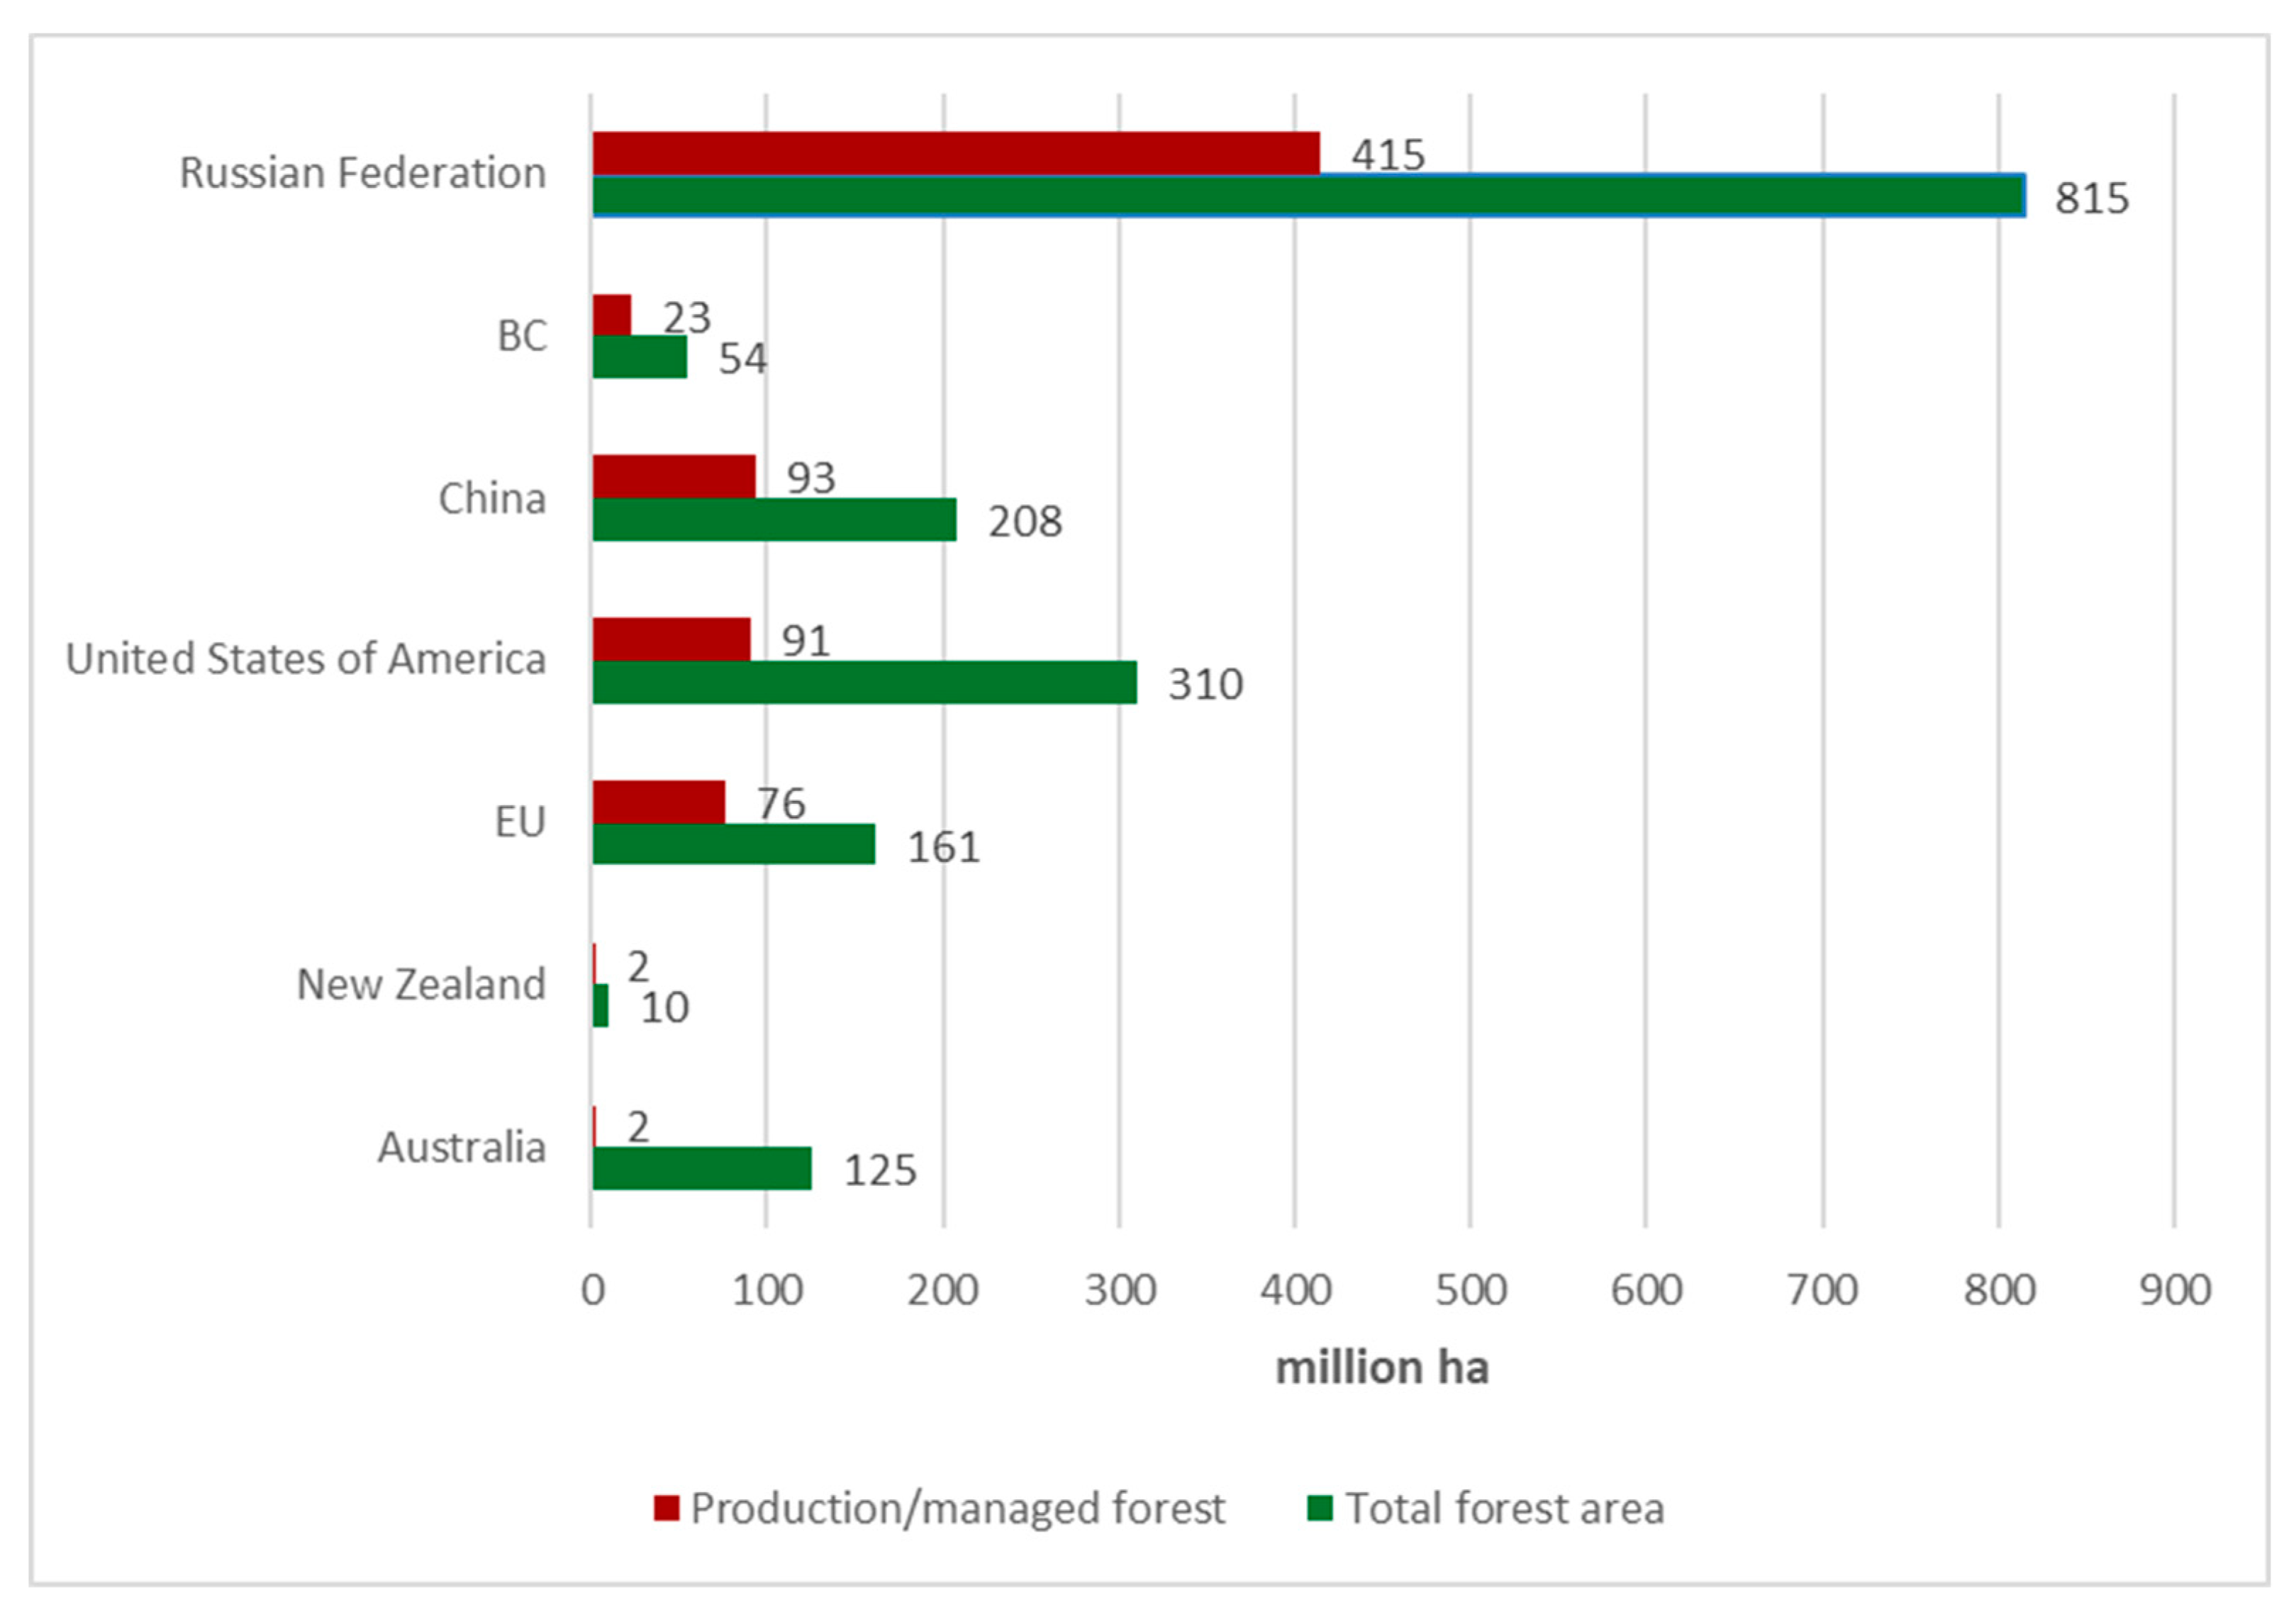
Australia has increased its forest area designated for production, from one million ha in 1990 to two million in 2015; this has largely occurred through plantation establishment. China has reduced its forest area designated for production from 114 million ha in 1990 to 93 million ha in 2015; this represents a deliberate policy to take natural forests out of production. New Zealand has maintained its forest area designated for production from 1990 to 2015 at two million ha; this consists exclusively of plantations (Figure 7)
Russia has designated almost half of its total forest area as production forest, with a decline over the reporting period, from 446 million ha in 2009 to 415 million ha in 2015. The U.S.A. has increased its forest area designated for production from 71 million ha in 1990 to 91 million ha in 2015. Forest area designated for production in the European Union has dropped slightly from 79 million ha in 1990 to 76 million ha in 2015, although there was an increase of three million ha in 2010.
3.2.3. Wood Removals
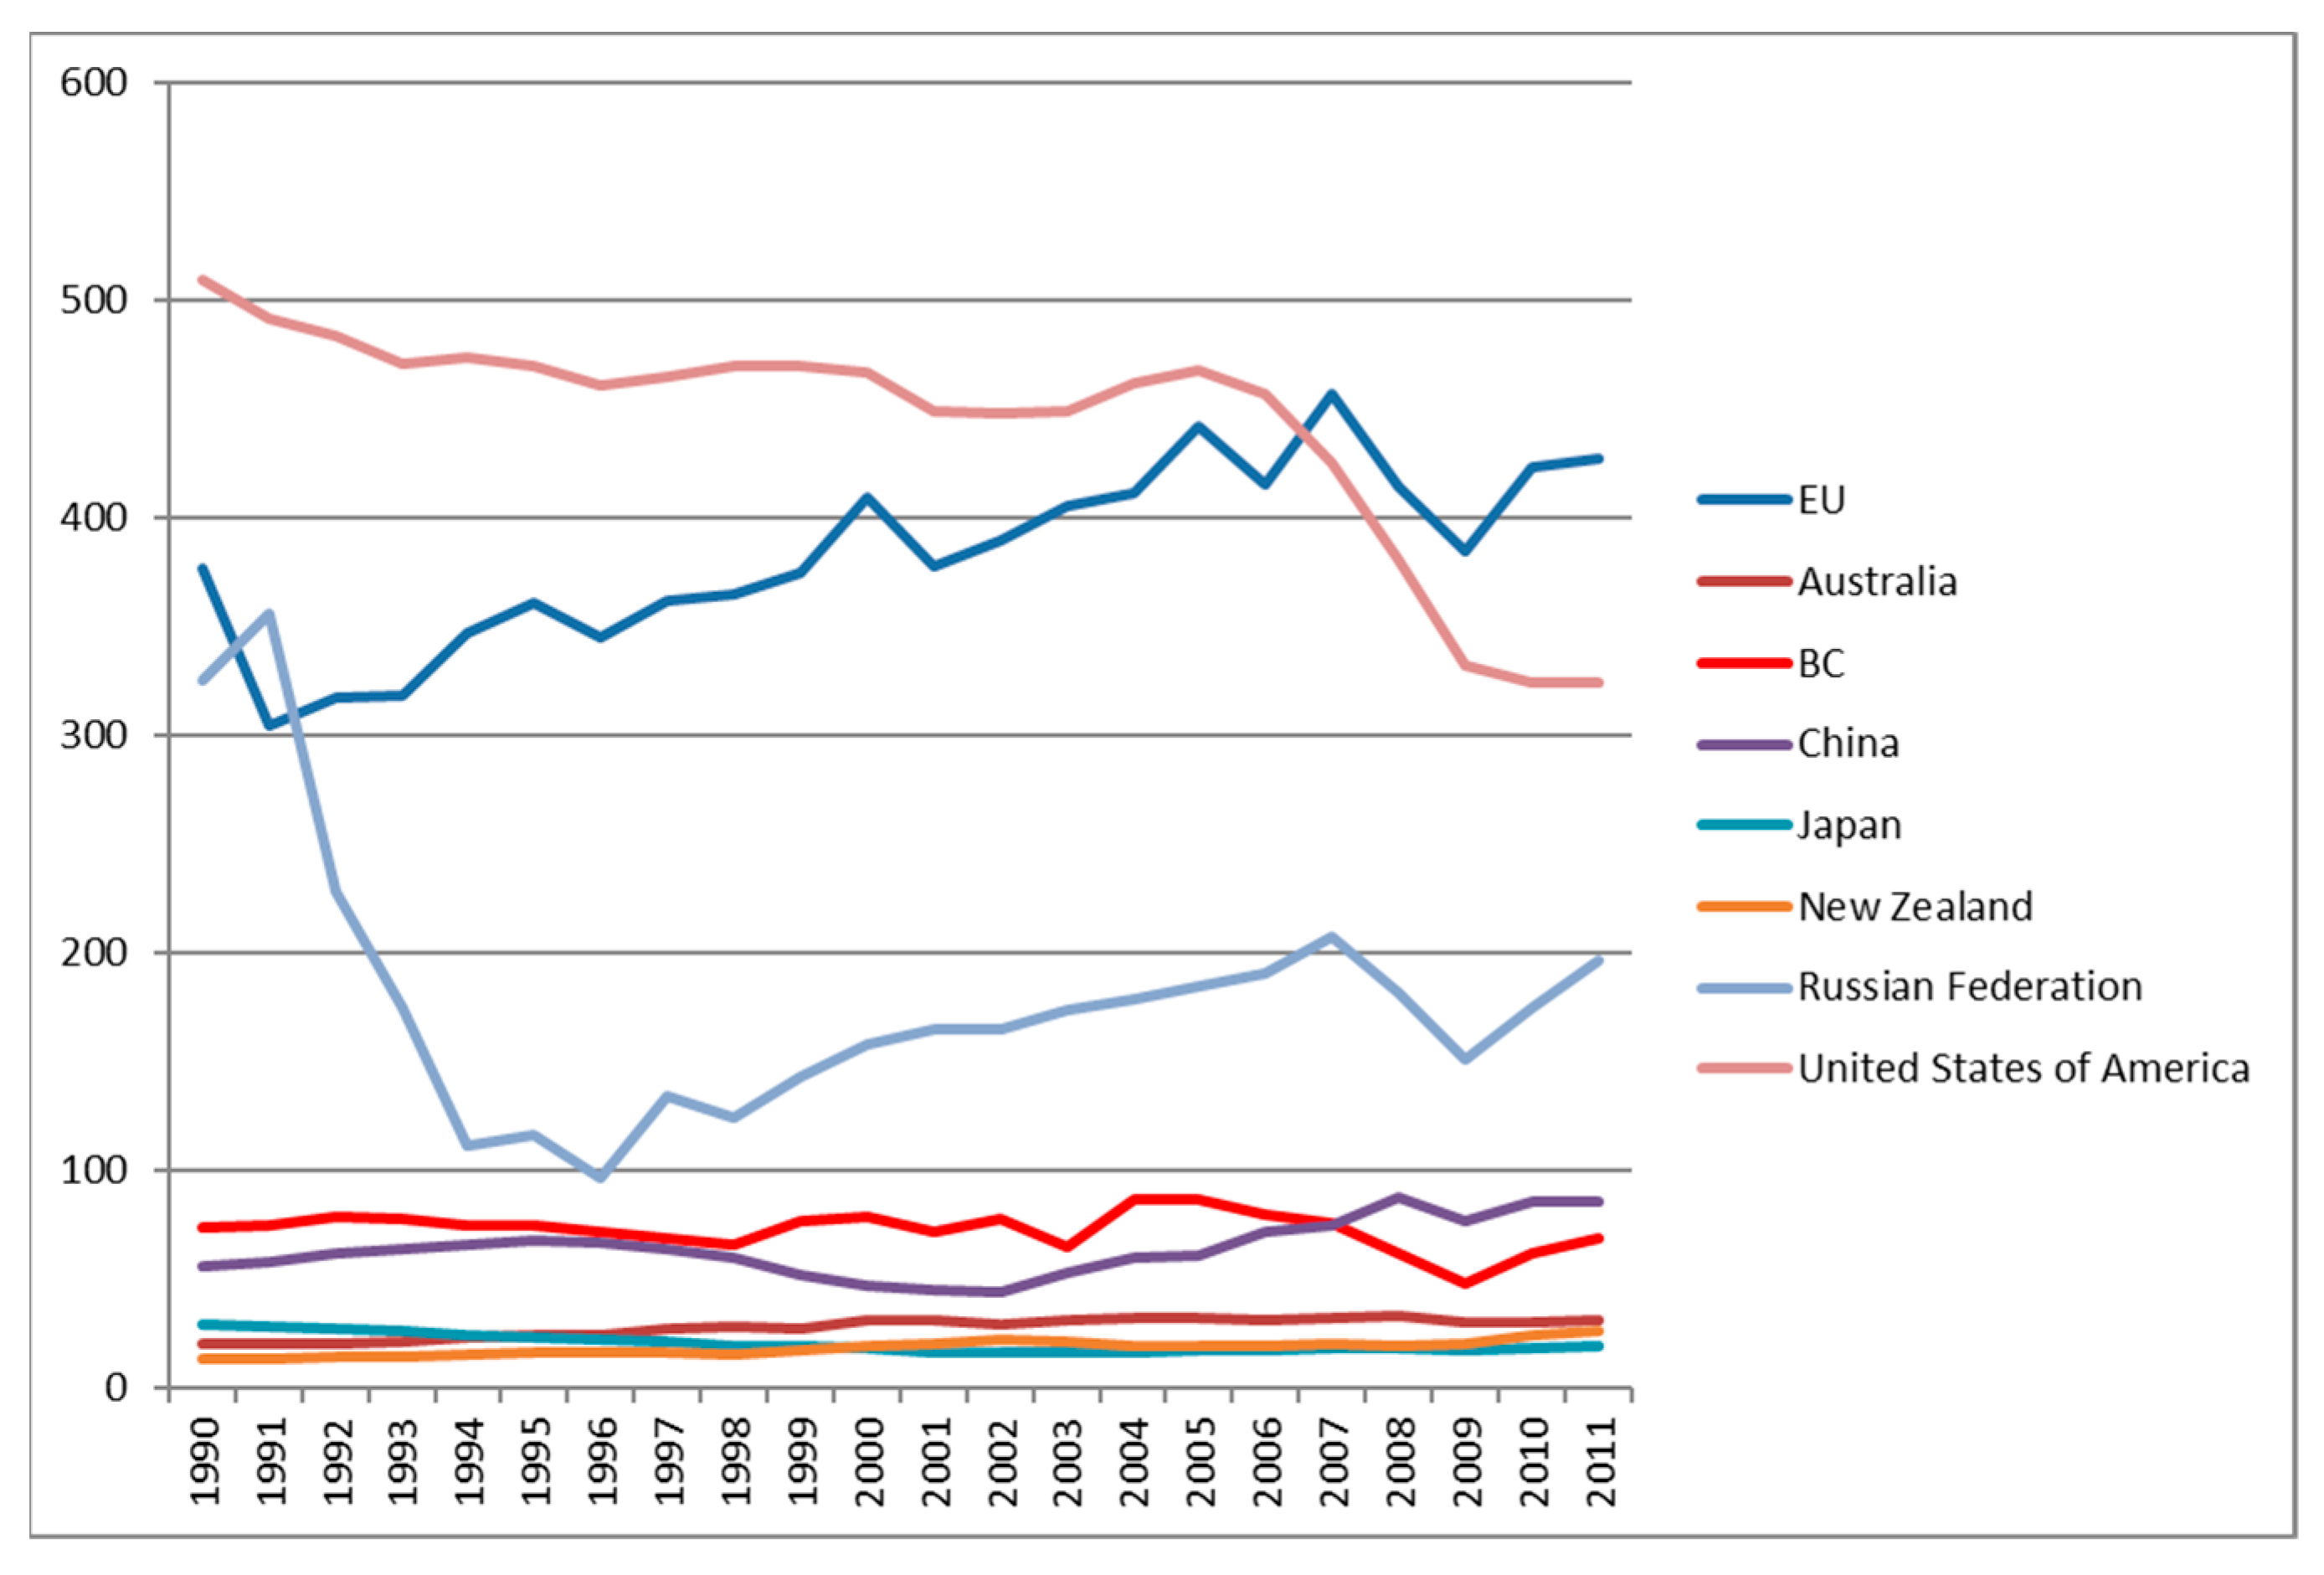
From 1990 to 2007, the U.S.A. harvested more trees than any other jurisdiction in the world, averaging 468 million m3 of total wood removals. This figure fell substantially in 2008 when total wood removals dropped to 380 million m3. The European Union steadily increased wood production, overtaking the U.S.A. in 2007 (Figure 8). Total wood removals in the European Union increased from 376 million m3 in 1990 to 427 million m3 in 2011. However, this masks considerable regional variation, with removals increasing in some countries and decreasing in others. The Russian Federation saw a sharp decline in total wood removals from 325 million m3 in 1990 to 96 million m3 in 1996. A steady increase in total wood removals has been observed since the dissolution of the Soviet Union, and in 2011, the total wood removals in Russia accounted for 197 million m3.
China increased its total wood removals from 55 million m3 in 1990 to 85 million m3 in 2011. Japan, New Zealand and Australia have had no significant change for over two decades and reported 19 million m3, 26 million m3 and 31 million m3, of total wood removals, respectively.
3.3. Data Management
3.3.1. National Forest Inventory and Reporting
All eight jurisdictions reported 100% of their forest areas as being covered under NFIs. These eight countries represent half of the global forest area covered by national forest inventories. All countries, except Australia, used ground plots with repeated inventories. In British Columbia, the National Forest Inventory—British Columbia Program (NFI-B.C.) tracks and monitors the current status of the forests. NFI-B.C. involves two separate types of permanent plots—ground plots and photo plots. Ground plots allow for the repeated measurement of forest attributes at defined locations, whereas the expanded photo-based program helps improve the tracking of changes in tree growth. China and Japan relied only on ground plots, whereas other jurisdictions used aerial/remote sensing, with either full coverage or a sample-based design. Australia, New Zealand and the U.S.A. used full coverage for their national forest inventory (Table 3).
The European Union and Russia used sample-based remote sensing coverage. In the European Union, however, there was variability among countries, as high-income countries reported national forest inventory coverage using remote sensing data, compared to middle income countries that relied on ground plots.
While information regarding forest resources and the characteristics of the forest resource is critical to understanding the dynamics surrounding sustainable forest management, this information is of little value unless it is made available through the proper reporting mechanisms. FRA (2015) reports the following three methods countries use to report national forest data: (i) criteria and indicator reporting, (ii) periodic state of the forest reports and (iii) “other” reports that describe some aspect(s) of the forest at the national level. The least helpful in determining progress to sustainable forest management are reports in the “other” category. National or state-level State of the Forest reports provide information needed to determine progress towards sustainable forest management as they provide consistent data and trends of forest resources over time. Criteria and indicator reports are the most useful tools in terms of measuring a country’s progress towards sustainable forest management, as they are purposefully designed to provide comprehensive information on social, economic and environmental aspects of a nation’s forest. Some countries, such as Australia and the U.S.A., produce periodic state of the forest reports using the criteria and indicator format. In the next section we compare the State of the Forest reports for the selected jurisdictions in the study.
3.3.2. State of the Forest Reports
Australia: Australia has made great efforts to align its state of the forest reports with the Montréal Process Criteria and Indicators. While its 2008 State of the Forests report departed significantly from the internationally agreed criteria and indicators of the Montréal Process, the State of the Forests report produced in 2018 by the Montréal Process Implementation Group (MIG) for Australia and the NFI Steering Committee used 44 of the 54 indicators of the Montréal Process. Some of Australia’s original set of indicators proved difficult to measure, and some overlapped. In 2006, the MIG reviewed the indicators and reduced the list used in Australia to 44. The report also provides information regarding the alignment of Australia’s 44 national indicators with the 54 international indicators of the Montréal Process. The Australian report provides a detailed methodology on collecting information. In addition to the State of the Forest report at a national level, the state of Victoria publishes its own State of the Forest report. The 2013 report is the third Victorian State of the Forests report (SFR). Victoria has adopted 45 indicators for sustainable forest management to monitor and assess the State’s performance in achieving its sustainable forest management objectives. These indicators are closely aligned with Australia’s Sustainable Forest Management Framework of Criteria and indicators and the international reporting standards developed under the Montréal Process Working Group. Tasmania also produces a State of the Forest report, with the most recent being published in 2017, using 42 indicators.
British Columbia: British Columbia published three State of British Columbia’s Forests reports between 2004 and 2010. The purpose of these reports was to provide information on the condition of British Columbia′s forest and range resources, and the environmental, social, and economic values associated with these resources and to provide an assessment of that information. The most recent report in 2010 covers 24 broad topic areas, and for each topic, the report contains several indicators.
China: The most recent Chinese National Report on Sustainable Forest Management was published in 2013 by the State Forestry Administration, using all criteria and indicators of the Montréal Process, and based on the outcome of national forest inventories and specific inventories, national forest statistics and management data. The report describes major progress in sustainable forest management in the previous 20 years and provides a comprehensive review of the national status of forests. The report also provides a reference to the source of data for each of the indicators assessed. The 9th National Forest Inventory is close to completion, and will reveal the latest trends in China’s forests. China also produces very detailed annual statistical reports about its forests (The China Forestry Yearbook). These are mainly focussed on economics, but cover a variety of other indicators.
Europe: The State of Europe’s Forests was published by the Ministerial Conference on the Protection of Forests in Europe in 2015. The report includes information from 34 signatory countries and is organized into two parts. The first part covers five qualitative indicators, providing general information about the way forests are governed in a country, through policies, institutions and instruments for sustainable forest management. The second part is based on 35 quantitative indicators, which provide information on the current status and changes in European forests and progress on sustainable forest management, and 12 qualitative indicators, which shed light on the policies, institutions and instruments used to address specific policy areas related to the quantitative indicators. This second part is structured according to the six criteria for sustainable forest management adopted in Europe, and include the respective quantitative indicators and qualitative indicators directly related to them.
Japan: The most recent State of Japan’s Forests and Forest Management report was published by the Forestry Agency in July 2019. This is the third country report that was issued after a period of 10 years. This report is currently not available in English. The previous report in 2009 used a list of 64 indicators; some indicators received less exhaustive treatment, due to a lack of relevant data, and the report clearly states this. The report provides few details on the methods used to collect the information, compared to the Australian report.
New Zealand: The most recent report on the Sustainable Management of New Zealand’s Forests was published in 2009 using all 64 indicators of the Montréal Process at the time. Although data were missing for some of the indicators, the report includes a commentary on each of the 64 indicators. For missing data, the report describes any information that is available. Some of the comments are comprehensive, both qualitatively and quantitatively; others are more descriptive (Ministry of Agriculture and Forestry 2009). The report presents indicators for both commercial plantation forests and native forests. Due to the nature of the forest estate in New Zealand, the report provides more detailed information on plantation forests than on native forests.
Russian Federation: The most recent report, the Russian Federation National Report: Criteria and Indicators for the Conservation and Sustainable Management of Temperate and Boreal Forests Montréal Processes, was published in 2009 by the Ministry of Agriculture of the Russian Federation. The report used 50 of the 54 indicators of the Montréal Process, but missed a number of indicators: 5.b Total Forest product carbon pools and fluxes; 6.1i Recovery or recycling of forest products as a percent of total forest products consumption; 6.3c Resilience of forest-dependent communities; and 7.2a Taxation and other economic strategies that affect sustainable management of forests.
U.S.A.: The U.S.A. has produced two versions of its National Report on Sustainable Forests. The most recent one is the 2010 edition, which includes comprehensive information organized by each of the 64 indicators. The report completely relies on the Montréal Process Criteria and Indicators to organize and present data relevant to U.S. forests, and their sustainability across ecological, social, and economic dimensions. Each criterion is introduced with a brief description and tabular display of the criterion and its indicators, including their history of revision since 2003, when the first edition of the report was published. The U.S.A. also produced a separate report in 2017, to assess forest conditions in U.S. tropical islands in the Caribbean and Pacific across ecological, social, and economic dimensions of forest sustainability, using the current 54 indicators of the Montréal Process.
3.4. Stakeholder Involvement
Table 4 shows that stakeholders have the opportunity to provide inputs into management decisions in most jurisdictions, as forest management plans include requirements for stakeholder inputs. All selected jurisdictions, except New Zealand, have national platforms for stakeholder involvement in forestry. New Zealand is also the only country of those assessed that does not produce State of the Forest reports. All jurisdictions perform criteria and indicator reporting, though there is a lack of consistency among reporting criteria and indicators. In the European Union, there is some variability among the member countries in terms of stakeholder involvement and sustainable forest management reporting. All but four countries in the European Union have platforms for stakeholder consultation. Belgium, Malta, the Netherlands, Spain and the U.K. indicated no presence of a stakeholder platform.
4. Discussions
In this paper, we provided a comparison of British Columbia’s forest against seven other jurisdictions of the world, using key sustainable forest management parameters. The trend in forest area over time is one of the most basic measures of forest health [16]. Governments, non-governmental organizations, international agencies and the industry could use reliable information on global trends in forest area to make sound decisions on policies and investments. The academic community could also greatly benefit from this information [15]. B.C. has one of the highest proportions of land covered with forests (57%) among all jurisdictions. The total forest area in B.C. has remained stable, at around 55 million ha. FRA reports the change in natural forest area between any two time periods, which is the net effect of forest clearance and conversion to another land use (or deforestation) in some areas, as well as natural forest losses, through processes such as fire or drought and natural forest expansion elsewhere. However, this may vary between jurisdictions; for instance, in 2017 and 2018, more than 2.5 million ha of forest in B.C. was burnt, but B.C. does not report a forest loss unless the land use has changed. This contrasts with Australia, where forest killed by drought was reported as a loss of forest. Disturbance regimes in forests due to climate change are a major challenge for sustainable forest management. Seidl et al. (2018) conducted a global synthesis of climate change effects on important abiotic (fire, drought, wind, snow and ice) and biotic (insects and pathogens) disturbance agents [17]. The synthesis found that disturbances from fire, insects and pathogens may increase in a warming world (regardless of changes in water availability) and these agents and their interactions currently dominate disturbance regimes in many jurisdictions. In B.C.’s old growth forests, for instance, the adoption of forest harvesting practices that closely emulate natural disturbance processes must be accompanied by a reduction in annual allowable cut, in order to avoid highly fragmented landscapes [18].
The main drivers of deforestation in B.C. are agricultural expansion, urban expansion and settlement, infrastructure development associated with oil and gas extraction, forestry, industry, and transportation. Construction of hydroelectric projects caused a spike in deforestation in the 1970s, with a loss of 30,000 ha per year. Hydroelectric development is currently not a major contributor to deforestation in British Columbia, although the Site C project involved the clearance of 6956 ha of forest. In 2010, the B.C. government passed the Zero Net Deforestation Act, to ensure that when trees from forest land are removed, to convert the forest land permanently to a different use, new trees will be planted elsewhere. This act stipulates that the government must reach the goal of zero net deforestation by December 2015 and authorize the development of regulations and required biannual progress reports, starting in 2012 [19]. However, the Act has not yet been brought into force by regulations, so the government has taken no direct actions to pursue the goals described in the act [20].
Tracking primary forest area is one of the methods of capturing changes in forests that are considered particularly important ecologically, and the global FRA serves as a unique instrument for tracking changes in areas where countries self-report their area of primary forest [21]. However, the results of this research indicate that data on primary forests from different countries are difficult to compare, as they are collected in very different ways. For instance, a particular forest type might be reported as primary forest in one country, but not in another. Hence, due to reporting differences, caution is needed in assessing global and regional trends in primary forests.
The practice of sustainable forest management has no meaning without the presence and effective application of legal, policy and institutional frameworks at national, regional, provincial/state and/or local levels. The Global Forest Resources Assessment 2015 collected data from countries regarding forest policy and regulatory frameworks that exist within jurisdictions, to support the implementation of sustainable forest management. According to FRA (2015), at the global level, countries that had either policies and/or legislation supporting sustainable forest management cover 99% of the global forest area in 2015, a major increase over the area reported in FRA 2010 (70%) [12].
B.C. forest land is managed through a highly complex system of tenures, in which the government delegates certain forest management responsibilities to private companies, organizations or individuals, in exchange for guarantees of timber supply [22]. Research conducted prior to the implementation of the Forest and Range Practices Act (FRPA) has suggested that forest practice regulations in Canada, particularly in British Columbia, are among the toughest globally [23]. In British Columbia, FRPA came into effect in January 2004 for regulating forest practices. This represented a major change from a prescriptive approach (epitomized by the Forest Practices Code) to a result-based approach. The Ministry of Forests, Lands, Natural Resource Operations and Rural Development is the main agency responsible for assessing compliance with forest law, using site inspections and patrols. In addition, the independent Forest Practices Board, set up in 1995, audits forest practices and the appropriateness of government enforcement. It also investigates complaints and participates in administrative appeals.
Almost 1.2 billion ha of the world’s forest area (or 30 per cent of the total forested area) is currently designated primarily for the production of wood and NTFPs [1]. In the Global Forest Resources Assessment 2015, data on forest area designated for production varied greatly from one jurisdiction to another. This makes comparisons challenging and means that interpretations on the forest area designated for production must be made with great care. For instance, Canada reports production forest area as privately owned and non-protected forest, which is only a small proportion (6%) of the total forest area [24]. Other countries, such as the Russian Federation, use public forest for estimation of forest area designated for production. This invalidates any comparisons.
Forest resources management generally includes measurements of key forest attributes, such as species composition, age class, area, volume per hectare growth rates and site class. Once collected, these data provide critical information for national scale planning and the support of sustainable forest management policies and practices. At the global level, a significant increase has occurred in the area of forest covered by National Forest Inventories (NFI). In 2010, less than 50 countries reported having an NFI. As of 2014, 112 countries were conducting forest inventories that cover 3.2 m ha or 81% of the total global forest area [12]. In many jurisdictions, State of the Forest reports (SFR) have become a tool for the government to communicate information about the status and development of their country’s forests to their citizens and the general public. As a result, many government, sub-national governments and even communities have produced such reports. State of the Forest reports are essentially progress reports for each jurisdiction in achieving sustainable forest management. Every country member of Montréal Process has committed to using the criteria and indicator approach to report on sustainable forest management issues in their jurisdiction. However, inconsistencies among the countries’ reports are challenging the assessment of progress towards sustainable forest management [11].
National stakeholder platforms (NSP) are defined as the “presence of a recognized procedure that a broad range of stakeholders can use to inform the national policy process through their opinions, suggestions and analysis” [1]. The Montréal Process, as well as most other criteria and indicator schemes for sustainable forest management, require countries to incorporate stakeholder inputs into operational decision making for public forests [25]. While stakeholder consultation processes can be complex, their main aim is to improve communication and cooperation across stakeholder groups, resolve conflicts, improve the quality of forest operations and contribute to nation forest policy [26]. Over the past two decades, significant progress has been made in many countries in allowing or encouraging stakeholder inputs into forest policy processes.
Stakeholder involvement is an essential component of B.C.’s sustainable forest management of public forest lands through public involvement in the strategic land use plans, as well as in operational plans of forest companies. B.C. has developed an evolving process for engaging local communities and other stakeholders to articulate a vision for the intensity, type, and location of land-use activities [16]. Our results suggest that stakeholders are allowed to be involved in the planning, operations and review of almost all the forest area in our selected jurisdictions. While the functionality of reported NSPs was not clear, their presence is a positive starting point for most countries. The extent to which these opportunities are used by stakeholders is not easily measured and was not measured in FRA 2015 [12]. In addition, the existence of a stakeholder consultation process does not mean that stakeholder inputs are actually incorporated into decision-making.
5. Conclusions
In British Columbia, sustainable forest management is a clear priority and central policy focus of the provincial government. criteria and indicators provide a framework for describing and measuring the state of British Columbia’s forests, forest management practices and progress in sustainability. In 2003, the Province of British Columbia responded to the international challenge of sustainable forest management by developing a results-based, Forest and Range Practices Act (FRPA), which is supported by a compliance and enforcement regime.
This research provides analyses of key sustainable forest management parameters under four key domains; biophysical indicators and legal framework, management plans, data management, and stakeholder involvement, in order to gain insight into how B.C. compares against selected jurisdictions around the world. In this research, we integrated B.C. specific information from Canada’s National Inventory and National Forestry Database, with information from the Global Forest Resources Assessment 2015 for seven other jurisdictions—Australia, China, European Union, Japan, the Russian Federation, New Zealand, and the U.S.A. Our findings suggest that B.C. has the second-highest proportion of land covered with forests (57%) after Japan (68%). Forest cover has remained stable over the past few decades, at around 55 million ha, with one of the lowest deforestation rates among all jurisdictions.
Data on primary forests in B.C. are not available. However, B.C. has large areas of old growth forest, covering 22.6 million ha. B.C. has established over 6482 old growth management areas for biodiversity conservation, as well as many other legally protected areas. Over 85% of the province’s forest land has been designated for multiple uses. B.C. is one of the leading forest producers, with approximately 11 billion m3 of standing timber and total annual roundwood production volume, which has remained relatively stable since 1990, represents only a small fraction of the total forest resources available for harvesting. The state of British Columbia’s forest reports provided comprehensive information up to 2010, based on 24 topic areas. However, despite the substantial databases already assembled for sustainable forest management indicators in B.C., information needs for assessing sustainable forest management in some areas are being only partially met. B.C. has implemented broad scale strategic land use planning, that identifies stakeholder involvement processes prior to development. Forest companies are required to consult the relevant stakeholder to address public views, before any harvesting or other forestry interventions are approved by the government.
Overall, significant efforts have been made in British Columbia to achieve the goal of sustainable forest management. Our findings, which are based on data compiled and published by state and national level forest agencies, suggest that these efforts have been largely successful, with B.C. ranking high in key sustainable forest management parameters. Hence, the prospects of sustainability of B.C.’s forest remain positive. Through this research, we presented BC as a unique and best practice model for sustainable forest management. However, currently there is a lack of data on primary forests in B.C. Future research should focus on performing a comparison of B.C.’s old-growth management strategies with selected jurisdictions around the world.
Author Contributions
H.R.G. and J.L.I. conceived of the presented research idea. H.R.G. performed the analytical analysis and wrote the manuscript with support from J.L.I. Both authors provided critical feedback and helped shape the research, analysis and manuscript. All authors have read and agreed to the published version of the manuscript.
Funding
This work was supported by the Forestry Innovation Investment Ltd. (FII), a crown agency of the British Columbia Government and the Canadian Council for Forest Ministers’ Forest in Mind (FMP) working group.
Conflicts of Interest
The authors declare no conflict of interest.
References
- FRA. Global Forest Resources Assessment. 2015. Available online: http://www.fao.org/3/a-i4808e.pdf (accessed on 17 December 2017).
- Maes, W.H.; Fontaine, M.; Rongé, K.; Hermy, M.; Muys, B. A quantitative indicator framework for stand level evaluation and monitoring of environmentally sustainable forest management. Ecol. Indic. 2011, 11, 468–479. [Google Scholar] [CrossRef]
- Holvoet, B.; Muys, B. Sustainable forest management worldwide: A comparative assessment of standards. Int. For. Rev. 2004, 6, 99–122. [Google Scholar] [CrossRef]
- Hickey, G.M.; Innes, J.L. Indicators for demonstrating sustainable forest management in British Columbia, Canada: An international review. Ecol. Indic. 2008, 8, 131–140. [Google Scholar] [CrossRef]
- Hickey, G.M.; Citroen, S. A review of the sustainable forest management framework in Victoria, Australia: An innovative example of sub-national forest policy. Int. For. Rev. 2007, 9, 901–911. [Google Scholar] [CrossRef]
- Ten Brink, P. Legitimacy, efficacy and efficiency: Factors affecting public participation in environmental agreements in British Columbia, Canada. In Voluntary Environmental Agreements; Routledge: New York, NY, USA, 2017; pp. 81–94. [Google Scholar]
- State of B.C.’s Forests (SoF B.C.). 2010. Available online: https://www2.gov.bc.ca/gov/content/environment/research-monitoring-reporting/reporting/environmental-reporting-bc/previous-reports-indicators (accessed on 3 June 2018).
- Natural Resources Canada. Forest Industry Employment Statistical Data. 2016. Available online: https://cfs.nrcan.gc.ca/statsprofile/employment/bc (accessed on 14 July 2018).
- B.C. Stats. Forestry Data. 2018. Available online: https://www2.gov.bc.ca/gov/content/data/statistics/business-industry-trade/industry/forestry (accessed on 20 June 2018).
- Ministry of Forests, Lands and Natural Resource Operations. Sustainable Forest and Timber Management. 2018. Available online: https://www2.gov.bc.ca/gov/content/industry/forestry/managing-our-forest-resources/silviculture/timber-management-goals (accessed on 23 June 2018).
- Chandran, A.; Innes, J.L. The state of the forest: Reporting and communicating the state of forests by Montréal Process countries. Int. For. Rev. 2014, 16, 103–111. [Google Scholar] [CrossRef]
- MacDicken, K.G.; Sola, P.; Hall, J.E.; Sabogal, C.; Tadoum, M.; de Wasseige, C. Global progress toward sustainable forest management. For. Ecol. Manag. 2015, 352, 47–56. [Google Scholar] [CrossRef] [Green Version]
- State of Europe Forests (SoEF). 2015. Available online: http://foresteurope.org/state-europes-forests-2015-report/ (accessed on 27 February 2018).
- UN. Country Classification. 2014. Available online: http://www.un.org/en/development/desa/policy/wesp/wesp_current/2014wesp_country_classification.pdf (accessed on 22 February 2018).
- Keenan, R.J.; Reams, G.A.; Achard, F.; de Freitas, J.V.; Grainger, A.; Lindquist, E. Dynamics of global forest area: Results from the FAO Global Forest Resources Assessment 2015. For. Ecol. Manag. 2015, 352, 9–20. [Google Scholar] [CrossRef]
- Campbell, S.; Waddell, K.; Gray, A. Washington’s Forest Resources, 2002–2006: Five-Year Forest Inventory and Analysis Report; General Technical Report PNW-GTR-800; Pacific Northwest Research Station, USDA Forest Service: Corvallis, OR, USA, 2010.
- Seidl, R.; Thom, D.; Kautz, M.; Martin-Benito, D.; Peltoniemi, M.; Vacchiano, G.; Wild, J.; Ascoli, D.; Petr, M.; Honkaniemi, J.; et al. Forest disturbances under climate change. Nat. Clim. Chang. 2017, 7, 395–402. [Google Scholar] [CrossRef] [PubMed] [Green Version]
- Gauthier, S. Ecosystem Management in the Boreal Forest; Presses de l’Université du Québec (P.U.Q.): Quebec City, QC, Canada, 2009. [Google Scholar]
- B.C. Government. Zero Net Deforestation Act. 2010. Available online: http://www.leg.bc.ca/39th2nd/1st_read/gov05-1.htm (accessed on 29 June 2018).
- Hoberg, G.; St-Laurent, G.P.; Schittecatte, G.; Dymond, C.C. Forest carbon mitigation policy: A policy gap analysis for British Columbia. For. Policy Econ. 2016, 69, 73–82. [Google Scholar] [CrossRef]
- Morales-Hidalgo, D.; Oswalt, S.N. Somanathan, EStatus and trends in global primary forest, protected areas, and areas designated for conservation of biodiversity from the Global Forest Resources Assessment 2015. For. Policy Econ. 2015, 352, 68–77. [Google Scholar]
- Cashore, B. Search of Sustainability: British Columbia Forest Policy in the 1990s; UBC Press: Vancouver, BC, Canada, 2011. [Google Scholar]
- Cashore, B.; McDermott, C. Global Environmental Forest Policies: Canada as a Constant Case Comparison of Select Forest Practice Regulations. 2004. Available online: https://www.nrdc.org/sites/default/files/media-uploads/the_study_itself_0.pdf (accessed on 21 June 2018).
- Natural Resources Canada. Forest Land Ownership. 2018. Available online: https://www.nrcan.gc.ca/forests/canada/ownership/17495 (accessed on 3 July 2018).
- Montréal Process. Criteria and Indicators for the Conservation and Sustainable, Management of Temperate and Boreal Forests; Technical Notes on Implementation of the Montréal Process Criteria and Indicators; Montréal Process: Montréal, QC, Canada, 2009. [Google Scholar]
- Beckley, T. Forest Stakeholders’ Attitudes and Values: A review of Social Science Contributions; Manitoba Model Forest Inc.: Pine Falls, MB, Canada, 1995; 73p. [Google Scholar]
Figure 1.
Forest and other wooded land (Forest Resources Assessment 2015).

Figure 2.
Forest area as percentage of land area (FRA 2015).

Figure 3.
Trends in Forest Area 2000-2015 (FRA 2015).

Figure 4.
Deforestation (1000 ha/yr) (FRA 2015; State of the Forests B.C.)

Figure 5.
Primary forests (FRA 2015).

Figure 6.
Forest area designated for multiple use (FRA 2015; B.C. Govt).

Figure 7.
Forest area designated for production/management (FRA 2015).

Figure 8.
Total wood removals (million m3 under bark (u.b.)) (FRA 2015).


Table 1.
Growing stock in forest 2015.
| Country/Jurisdiction | Growing Stock in Forest | |
|---|---|---|
| Total (million m3) | Per Hectare (m3) | |
| Australia | - | - |
| British Columbia | 14715 | 270 |
| China | 16002 | 77 |
| European Union | 26605 | 165 |
| Japan | - | - |
| New Zealand | 3975 | 397 |
| Russian Federation | 81488 | 99 |
| U.S.A. | 40699 | 131 |
* No data available for Japan and Australia (FRA 2015).
Table 2.
Policies and Legislation supporting sustainable forest management.
| Country/Jurisdiction | National | Regional | Provincial/State | Local | ||||
|---|---|---|---|---|---|---|---|---|
| Public * | Private | Public | Private | Public | Private | Public | Private | |
| Australia | yes | yes | yes | yes | Yes | Yes | yes | yes |
| B.C. | n/a | n/a | yes | yes | Yes | Yes | yes | yes |
| China | yes | yes | - | - | Yes | Yes | yes | yes |
| European Union | yes | yes | partially yes | partially yes | partially yes | partially yes | partially yes | partially yes |
| Japan | yes | yes | no | yes | Yes | Yes | yes | yes |
| New Zealand | yes | yes | yes | yes | No | No | yes | yes |
| Russian Federation | yes | no | yes | No | Yes | No | yes | no |
| U.S.A. | yes | yes | yes-P/no-L ** | yes-P/no-L | Yes | Yes | yes | yes |
* Public and Private refer to forest ownership (FRA 2015); ** yes-P/no-L refers to presence of policies but absence of legislations supporting sustainable forest management.
Table 3.
Forest area covered under National Forest Inventory.
| Country | % of Forest Area with Forest Inventory | Forest Area Inventories (1000 ha) | Area Inventoried as % of Global Forest Area | Ground Plots | Aerial/Remote Sensing * |
|---|---|---|---|---|---|
| Australia | 100 | 124,751 | 3.1 | no | yes-f |
| B.C. | 100 | 54,431 | 1.3 | yes | yes-f |
| China | 100 | 208,321 | 5.2 | yes | no |
| Japan | 100 | 24,958 | 0.6 | yes | no |
| New Zealand | 100 | 10,152 | 0.3 | yes | yes-f |
| Russian Federation | 100 | 814,931 | 20.4 | yes | yes-s |
| U.S.A. | 100 | 310,095 | 7.7 | yes | yes-f |
| European Union | 100 | 161,081 | 4.1 | yes | yes-s |
* s denotes sample-based coverage; f denotes full coverage (FRA 2015).
Table 4.
Stakeholder Involvement Platform.
| Country/Territory | Stakeholder Involvement Platform | Criteria and Indicator Reporting | State of the Forest Report |
|---|---|---|---|
| Australia | Yes | Yes | yes |
| B.C. | Yes | Yes | yes |
| China | Yes | Yes | yes |
| European Union | partially yes | partially yes | partially yes |
| Japan | Yes | Yes | yes |
| New Zealand | No | Yes | no |
| Russian Federation | Yes | Yes | yes |
| U.S.A. | Yes | Yes | yes |
© 2020 by the authors. Licensee MDPI, Basel, Switzerland. This article is an open access article distributed under the terms and conditions of the Creative Commons Attribution (CC BY) license (http://creativecommons.org/licenses/by/4.0/).
Share and Cite
MDPI and ACS Style
Gilani, H.R.; Innes, J.L. The State of British Columbia’s Forests: A Global Comparison. Forests 2020, 11, 316. https://doi.org/10.3390/f11030316
AMA Style
Gilani HR, Innes JL. The State of British Columbia’s Forests: A Global Comparison. Forests. 2020; 11(3):316. https://doi.org/10.3390/f11030316
Chicago/Turabian StyleGilani, Haris R., and John L. Innes. 2020. "The State of British Columbia’s Forests: A Global Comparison" Forests 11, no. 3: 316. https://doi.org/10.3390/f11030316
Note that from the first issue of 2016, this journal uses article numbers instead of page numbers. See further details here.