Of the myriad candlestick formations, the Morning Star shines brightly as a hallmark indicator of changing market winds — illuminating a telling transition from gloomy to glorious sentiments. Its three-phased sequence marks a pivotal inflection point, cautioning savvy observers of waning negativity and fresh, promising possibilities ahead. We unveil the deeper workings of this time-tested pattern, equipping traders to capitalize on its immense insight rather than be surprised by the shifts it foretells.
When properly identified and acted upon, the Morning Star gives its beholders' good returns by revealing impending renewals, just as many remain trapped looking backward. Our journey progresses from demystifying its underlying psychology to navigating its revelations via proven strategies. We will traverse real-world cases exemplifying how capitalizing early on the pattern’s prognostic powers separates triumphant traders from those left bewildered in the wake of evaporated fortunes. By comprehensively covering its signals, strategies, and successes, we empower traders to harness the Morning Star’s immense predictive edge to prevail over unpredictable markets.
The article covers the following subjects:
What Is a Morning Star?
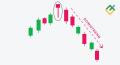
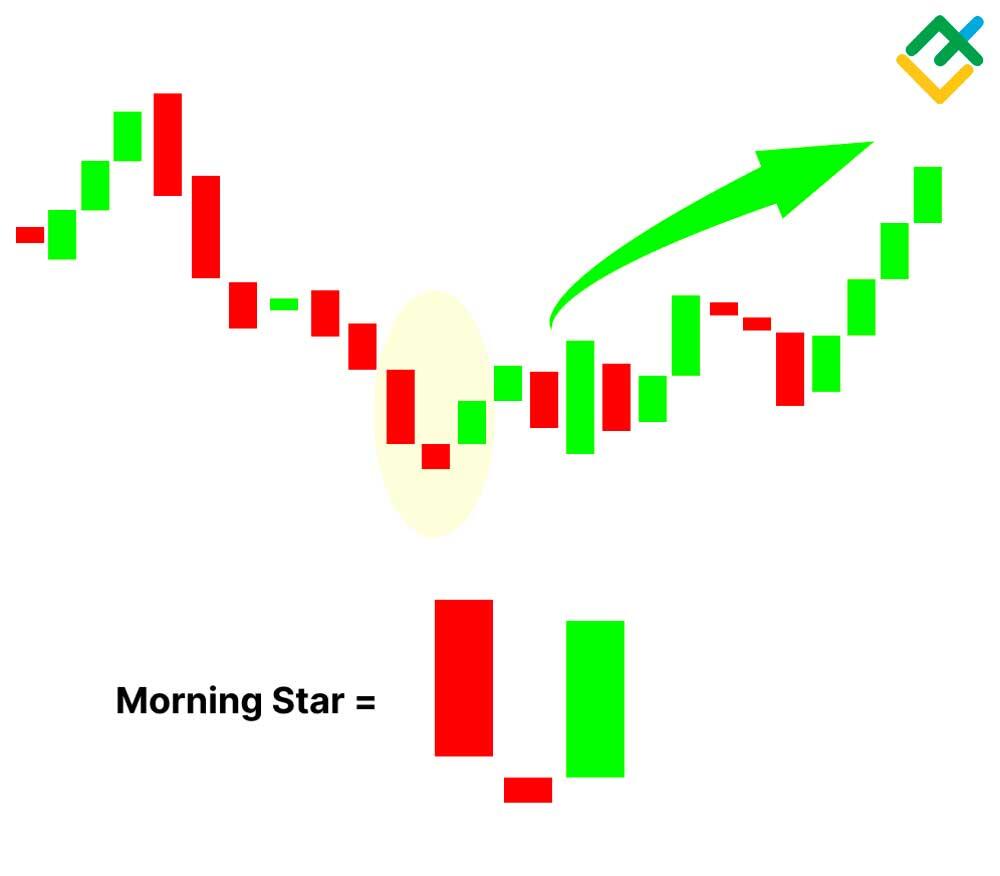
A Morning Star is a candlestick pattern commonly used in Forex trading to identify a potential bullish reversal in a downtrend. It consists of a three-candle formation that signifies a shift in market sentiment. The pattern begins with a tall red (bearish) candlestick, followed by a smaller red or green candlestick with a short body and long wicks. Finally, it concludes with a tall green (bullish) candlestick.
The middle candle in the Morning Star pattern marks a pivotal power swap between opposing market forces - bears relinquish control as bulls prepare to take command.
Shaded by uncertainty, this candle exhibits the first traces of waning selling pressure and waxing buying appetite. Its dimmed real body shows the equilibrium between supply and demand is growing unstable.
The third candle then confirms the balance breakdown. With bears in retreat and buyers reignited, this candle thrusts upward with conviction to cement the regime change. Its solid, real body often brightens the chart after days of red that preceded it.
Detecting the special middle candle is key for timely entries. While additional indicators may validate the dawn of an uptrend resurgence, reading the shifting candle dynamics alerts astute traders to position early before the new day dawns across the market landscape.
Morning Star Pattern Formation
The Morning Star pattern echoes this dawn ascent in the financial markets. The first candle reveals bears still ruling the landscape, pressing prices lower while dimming hope. But the second candle interrupts the strong-handed selling as its smaller real body shows building friction — a possible microclimate developing between bear and bull forces.
Finally, the third candle provides resolution. Demand resurges and overwhelms supply, driving a powerful advance that closes firmly atop the midpoint of the first candle's downward slope. Dawn's early light burns through, signaling the bears' night may be overtaken by bulls at daybreak.
The Morning Star formation thus alerts savvy traders that uptrend redemption could soon emerge from the ashes of the preceding downtrend. This early notification allows timely preparation to capture bulls' potential offshoot move as they stretch their wings in the young light of the latest market sunrise.
The key characteristics of the Morning Star pattern include:
- Downtrend. The pattern occurs after a prolonged downward move.
- Bearish Candle. The first candle is a bearish candle, preferably longer than the other two candles.
- Small-bodied Candle. The second candle is a small-bodied candle, indicating indecision.
- Bullish Candle. The third candle is strongly bullish, confirming the reversal.
The Morning Star pattern suggests a shift in momentum from bearish to bullish and is typically considered a reliable pattern when other technical indicators support the reversal signal.
How to Identify a Morning Star Pattern
Here are the steps to understand the Morning Star Pattern:
- Market Decline. The bears have control as the market is declining, with consistent new lows being reached.
- Day 1 (P1). The market makes a new low as predicted, and a lengthy red candle forms, indicating increased selling pressure.
- Day 2 (P2). The bears confirm their position with a gap down opening. However, there is limited activity during the day, resulting in a doji or a spinning top, representing market uncertainty.
- Bearish Agitation. The bears become slightly agitated due to the appearance of a doji or spinning top. They expected another down day despite the positive gap down opening.
- Day 3 (P3). The market or stock opens with a gap up, followed by a blue candle that closes above the opening of the red candle on P1.
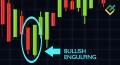
- Bullish Engulfing Potential. If P2's doji/spinning top did not occur, P1 and P3 would have formed a bullish engulfing pattern.
- P3 Action. P3 becomes the center of attention. Initially, the bears feel uneasy with the gap up opening. However, buying momentum continues throughout the day, recovering all of P1's losses.
- Buying Opportunities. Traders should look for purchasing chances in the market, as the bullishness of P3 is expected to persist in the upcoming trading sessions.
- Early Trade Entry. Unlike single or two candlestick patterns, traders, both risk-taking and risk-averse, can open trades on P3. Trading based on the morning star pattern may not require waiting for confirmation on the fourth day.
Following these steps, traders can identify and capitalize on the Morning Star Pattern.
Morning Star Example
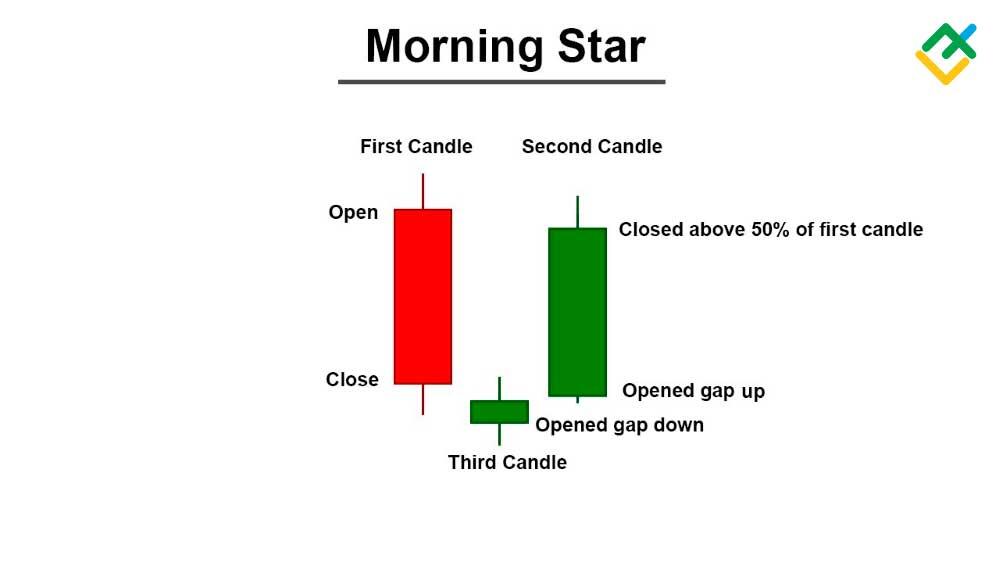
The Morning Star pattern is a three-day bullish reversal pattern consisting of the following candlesticks:
- Day 1: a long-bodied red candle that continues the existing decline in the market.
- Day 2: a short middle candle that gaps down on the open, indicating market indecision.
- Day 3: a green candle with a long body that gaps up at the open and closes above the midpoint of the first day's body.
In the case of the TCS chart, the Morning Star pattern starts to form around 3480 INR. From that point, the price begins to move upward, marking a shift in the trend from negative to bullish.
How to Trade Morning Star
When trading the Morning Star candlestick pattern, there are several strategies you can employ to maximize your chances of success. Here are some key considerations for entering trades, placing stop-loss orders, and setting profit targets when identifying a Morning Star pattern:
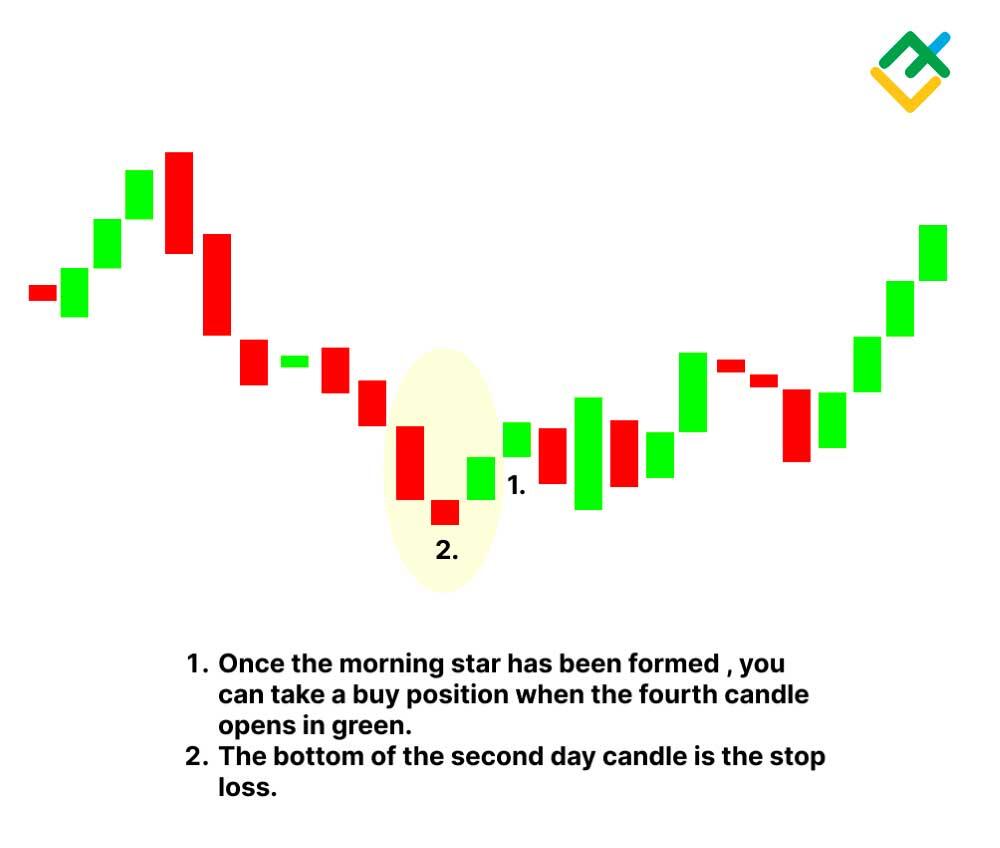
- Entry Points. Look for a Morning Star candlestick pattern after a prolonged downtrend. The first candle should be a bearish candle, indicating selling pressure. The second candle should be a small-bodied candle, signaling indecision in the market. The third candle should be a strong bullish candle, confirming the potential reversal. Enter the trade at the opening of the candle following the Morning Star pattern.
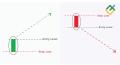
- Stop-Loss Placement. Place your stop-loss order below the low of the Morning Star pattern. This level acts as a support level, and if the price breaks below it, it suggests that the reversal may not be valid. By placing your stop-loss order below this level, you can limit potential losses if the trade does not work out as expected.
- Profit Targets. You can take a few approaches when setting profit targets. One method is to measure the distance between the first candle's low and the third candle's high in the Morning Star pattern. You can then project this distance upward from the breakout point to determine your profit target. Another approach is to identify key resistance levels on the chart and set your profit target near those levels. Additionally, you can use trailing stop-loss orders to capture additional profits if the market continues to move in your favor.
It's important to remember that no trading strategy is foolproof, and it's always wise to practice proper risk management and use these strategies in conjunction with other technical indicators or analysis methods. Additionally, it's recommended to backtest and demo trade your strategy before applying it in live trading to assess its effectiveness.
Applying these strategies when trading the Morning Star candlestick pattern can enhance your decision-making process and potentially improve your trading results. However, it's crucial to adapt these strategies to your trading style and risk tolerance and continually refine your approach based on market conditions and feedback from your trades.
Morning Star vs. Evening Star Patterns
The Morning Star and Evening Star patterns are two distinct candlestick patterns with opposite implications. The Morning Star pattern is a bullish reversal pattern that appears at the bottom of a downtrend, signaling a potential upward reversal. It consists of three candles: a long bearish candle, a small-bodied indecisive candle, and a strong bullish candle.
On the other hand, the Evening Star pattern is a bearish reversal pattern that appears at the top of an uptrend, indicating a potential downward reversal. Like the Morning Star, it also consists of three candles: a long bullish candle, a small-bodied indecisive candle, and a strong bearish candle.
The key difference between the Morning Star and Evening Star patterns lies in their implications for price direction. The Morning Star suggests a shift from bearish to bullish momentum, while the Evening Star suggests a shift from bullish to bearish momentum. Traders often seek confirmation from other technical indicators or chart patterns to validate these patterns before making trading decisions.
Pros and Cons of Using Morning Star Pattern
Pros | Cons |
Reversal signal | False signals |
Confirmation with other indicators | Subjectivity in interpretation |
User-friendly and easy-to-identify | Limited application to shorter-term trades |
Remember that the Morning Star pattern should be used as part of a comprehensive trading strategy and combined with other technical analysis tools to increase its effectiveness.
Conclusion
When used appropriately, the Morning Star pattern can be a valuable tool for traders. It serves as a reversal signal, indicating a potential change in market direction from bearish to bullish. Its reliability can be enhanced when combined with other technical indicators and confirmation factors, such as volume and support levels. The pattern's simplicity and ease of identification make it accessible to traders of all experience levels. However, it is essential to be aware of its limitations, including the possibility of false signals and subjectivity in interpretation. By incorporating the Morning Star pattern into a comprehensive trading strategy, traders can improve their decision-making and capitalize on trend reversals.
Morning Star Pattern FAQs
The Morning Star is a three-candlestick pattern in technical analysis that signals a potential trend reversal from bearish to bullish. It forms after a downward trend and consists of a large bearish candle, a small candle with a short body, and a large bullish candle.
The Morning Star can be a good indicator with other technical analysis tools and confirmation factors. However, it is crucial to consider the overall market context and not solely rely on the Morning Star pattern for trading decisions.
The Morning Star is a bullish pattern. It indicates a potential reversal of a downward trend, with the third candlestick signaling the emergence of bullish momentum and a possible start of an upward climb.
Three consecutive candlesticks form the Morning Star pattern. The duration of the pattern depends on the timeframe of the chart being analyzed. It can span a few days or even just a few hours.
After a Morning Star pattern forms, it suggests a potential reversal from bearish to bullish. Traders may interpret it as a signal to enter a bullish position and ride the subsequent uptrend until there are indications of another reversal or change in market direction.
Yes, a Morning Star pattern can fail, as with any technical analysis pattern. It can produce false signals or be invalidated by subsequent price movement. Traders should exercise caution and use additional analysis to confirm the pattern before trading.

The content of this article reflects the author’s opinion and does not necessarily reflect the official position of LiteFinance. The material published on this page is provided for informational purposes only and should not be considered as the provision of investment advice for the purposes of Directive 2004/39/EC.