PowerBI - Quadrant Chart
Mohammed Adnan
Microsoft MVP | MCT | Youtuber - taik18 | Consultant, Trainer & Speaker | Data Solution Architect | Experience in Azure AI, Fabric, Power BI, Power Query, PowerApps, Power Automate, PVA, SQL, Excel
#PowerBI #QuadrantChart
Here is the PowerBI Quadrant Chart, the best I found is the RADIAL AXIS..

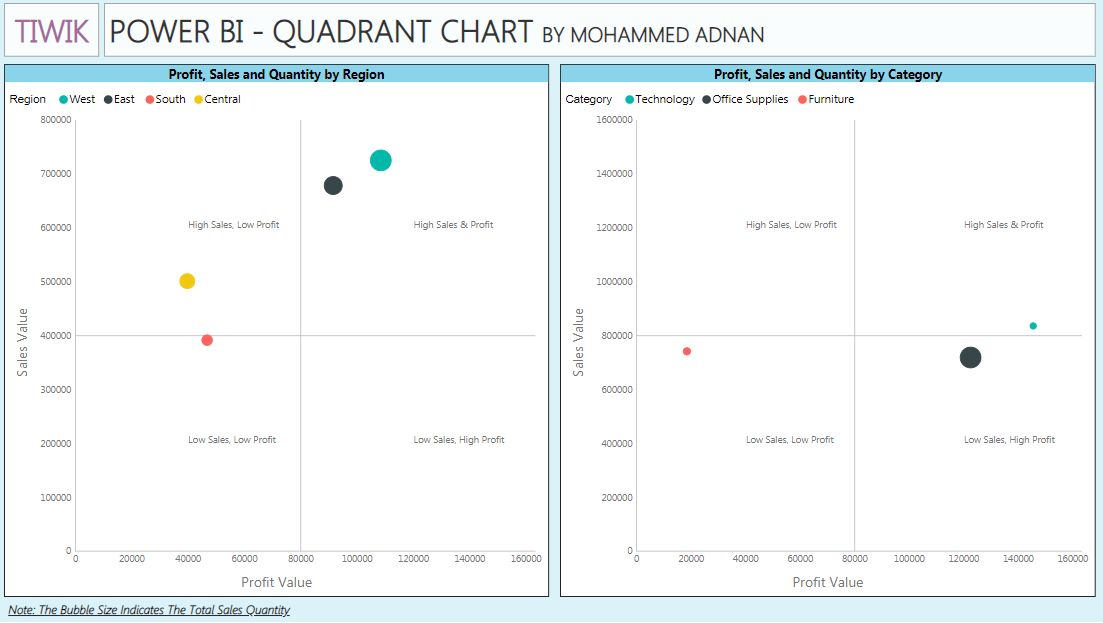
An example illustrated above is the QUADRANT CHART in POWERBI.
We can easily analyze the sales by REGION (East, West, South, Central) and CATEGORY, if you observe the image the size of the bubble is not the same it is because of the total quantity sold in those areas.
Ex: the left chart shows that in the West region not only the sales and profit is high, but the quantity of sales is also high. whereas in the South region all three metrics (Sales, Profit, and Quantity) are low.
in the 2nd chart, it is based on CATEGORY (Technology, Office Supplies, Furniture), the office supplies is high in quantity but slightly low in sales and profit. whereas in Technology the quantity is low but the sales and profit is high.