
September 18, 2019 |
April 22, 2021
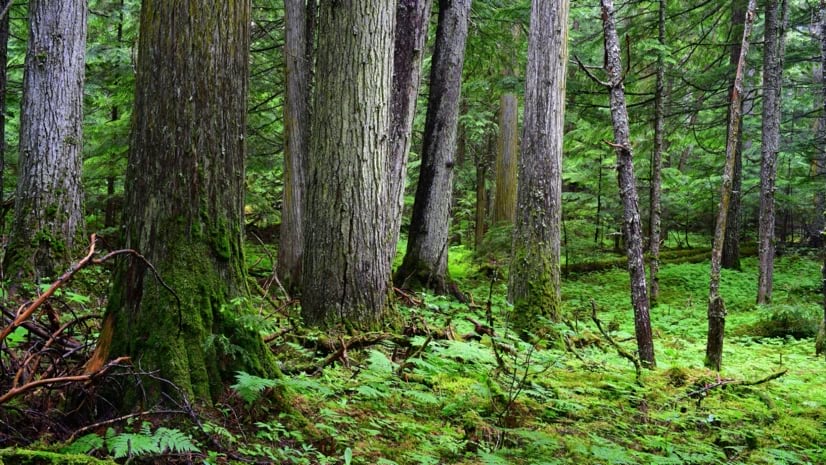
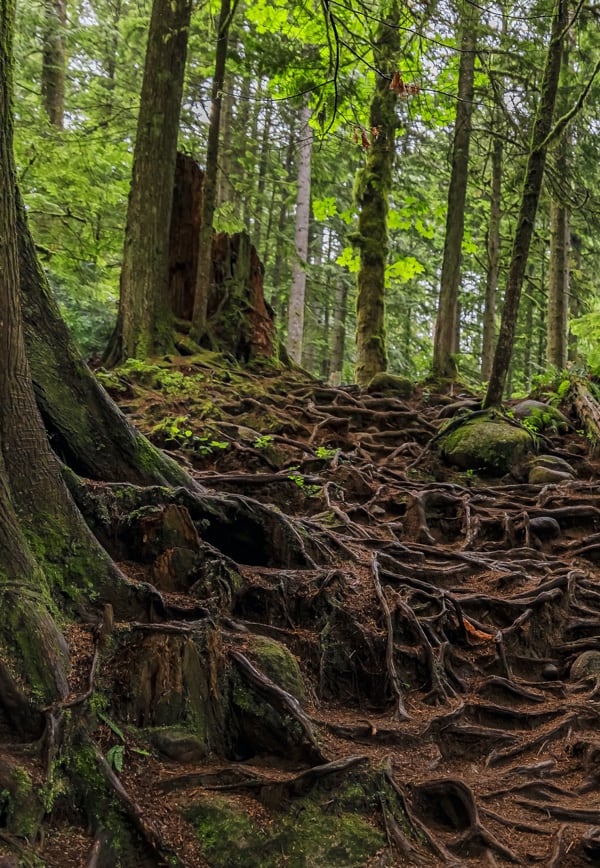
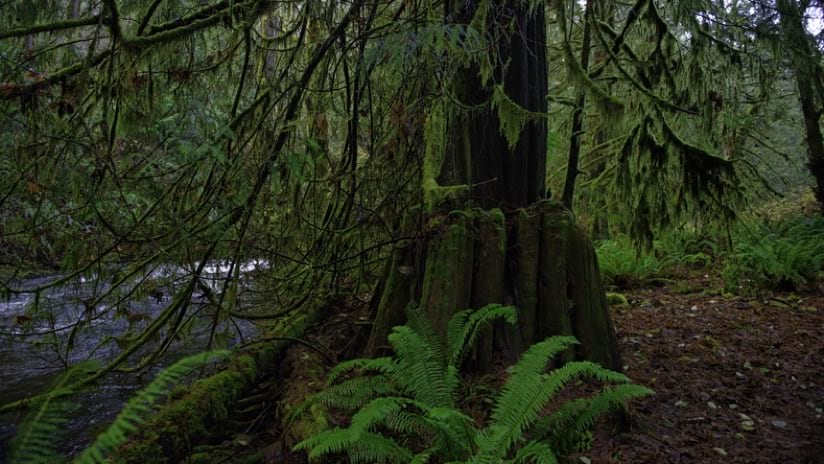
Researchers upended much of what people thought they knew about forests when they discovered that subterranean networks of fungi actually help trees communicate and cooperate. The symbiotic relationship was first observed when fungi were found to be helping trees transport water and nutrients. Then researchers saw that the fungal threads connecting all trees carry alarm signals and even hormones from tree to tree. With greater awareness of forest interconnectedness—and a realization that old-growth forests are healthier and more tolerant of climatic stress—many industry leaders are rethinking forest practices.
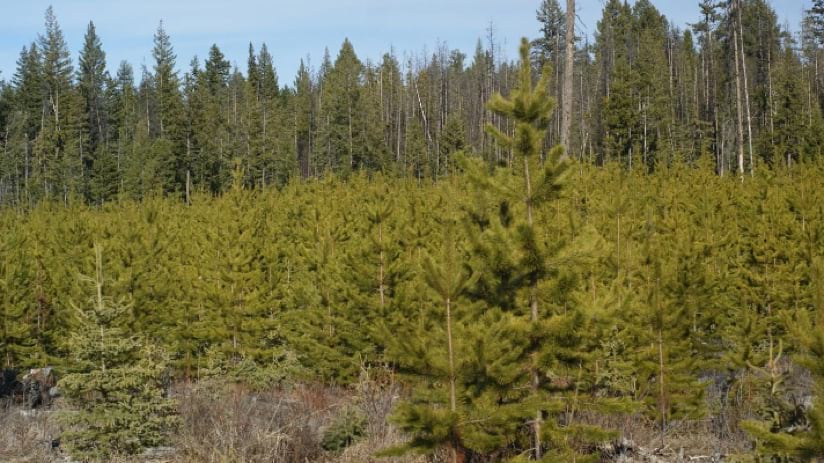
There’s growing consensus that it makes much less sense to clear-cut a primary forest—one made naturally and existing for ages. Nor is it prudent to plant only a monoculture species of a tree because growth slows when old forests are replaced by plantations. As tree planting operations commence on a massive scale around the world, scientists are more certain that natural forests can better support our planet through carbon storage and sequestration.
For advocates in British Columbia—where the awareness of fungal forest communication first took hold—government policies and industrial practices aren’t changing quickly enough. Volunteers with Conservation North work to protect wild plants, animals, and their habitat in the north of the province. When they learned the locations of primary forests, they shared an interactive map with the intent to preserve them or at least drive awareness of their critical status.
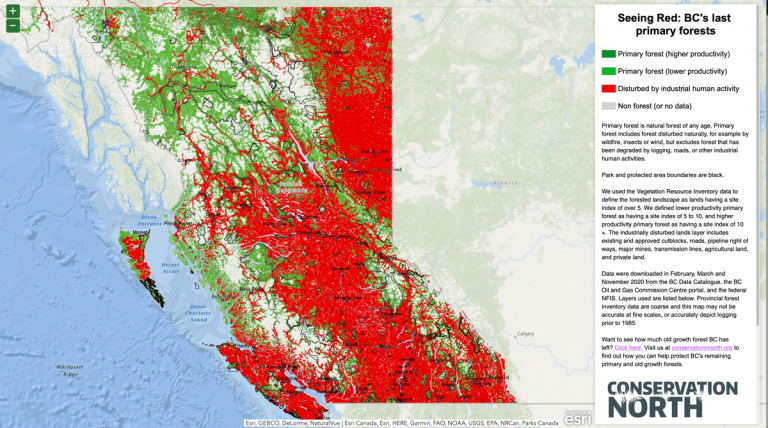
The Seeing Red map, created by importing logging data into a geographic information system (GIS), reveals that very few primary forests remain. Many areas have been disturbed by industrial logging, noted in red on the map, while shades of green show the untouched forest.
“What shows up as red are the human-created landscapes—industrially managed areas,” said Michelle Connolly, director of Conservation North. “The government and industry like to say how sustainable forest management is in BC, and meanwhile, the evidence points otherwise, including the fact that the iconic mountain caribou are basically in an extinction vortex. We’re grateful for this tool because it really communicates something completely different from what we’ve been hearing.”
To build its interactive map, the team at Conservation North gathered GIS layers from the BC Data Catalogue, the BC Oil and Gas Commission Resource Centre portal, and Canada’s National Forest Information System. A report on old growth forests prepared by scientists served as an impetus.
“The report was a pioneering effort to look at old growth from a provincial perspective that only included tiny static maps, and we wanted to have something we could zoom into,” Connolly said. “Both our Seeing Red map and Old-Growth map use the report’s methodology, and the scientists who wrote the report have reviewed and approve of our maps.—we’re proud that they told us the maps are solid and defensible.”
The Conservation North team knew it was important to be accurate in their scientific inquiry and mapping because they knew the data revelation would stir emotions. The maps contained indisputable visual evidence many people were unprepared to accept.
“I heard from a critic the other day claiming that we could have just used Google Earth or satellite imagery to show the forestry impacts,” Connolly said. “That doesn’t work though, because all the land will look green if it’s grown back. We really needed GIS to look at the cumulative impact of industrial logging and roads.”

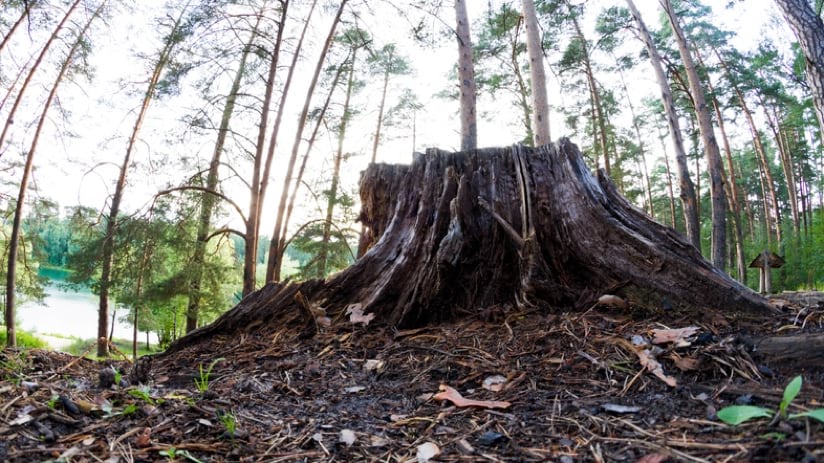
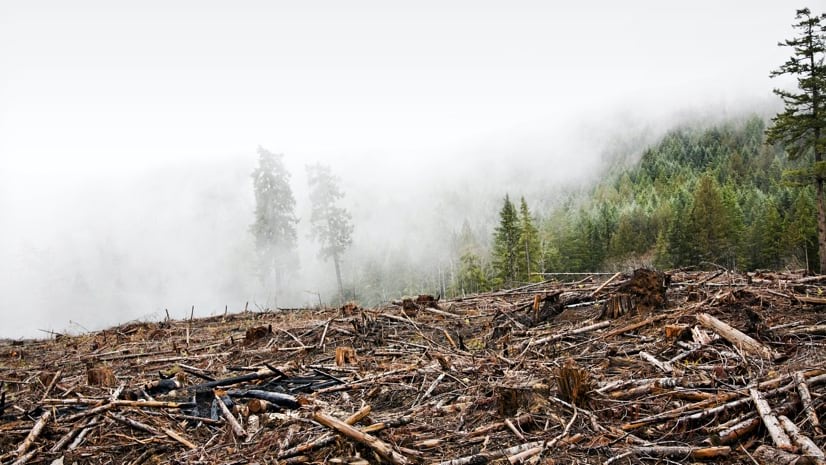
Much of the historical logging that took place in the Pacific Northwest was fairly low impact until clear-cutting became the standard practice. The maps detail the more recent story.
“Most of what you see on our maps are the result of modern industrial activity over the last 60 or 70 years,” Connolly said. “Our maps are actually an overestimation of what’s natural because they don’t show all of the historical logging.”
While showing the current state of forests in the region, Connolly and her team also wanted the project to help quantify the value of the primary forest and identify where old growth can be saved.
“The exercise started because we needed a conservation planning tool,” Connolly said. “We spend a lot of time in the field, witnessing the impacts of industrial forestry. We wanted to know where the largest intact areas are. We could figure that out partly by hiking into these areas, but we needed the perspective only a map could provide.”
The Seeing Red map and Old-Growth map may now be more crucial to the region’s conservation efforts. In 2020, the BC government placed an emphasis on wood pellets—a biomass fuel burned for heating or electricity—but didn’t specify that the fuels should come from second growth forests.
“All forests may now be on the chopping block, and this is terrifying,” Connolly said.
Conservation North calls itself biocentric—valuing nature for its own sake—with the conviction that by just being in a natural setting, people reap therapeutic benefits.
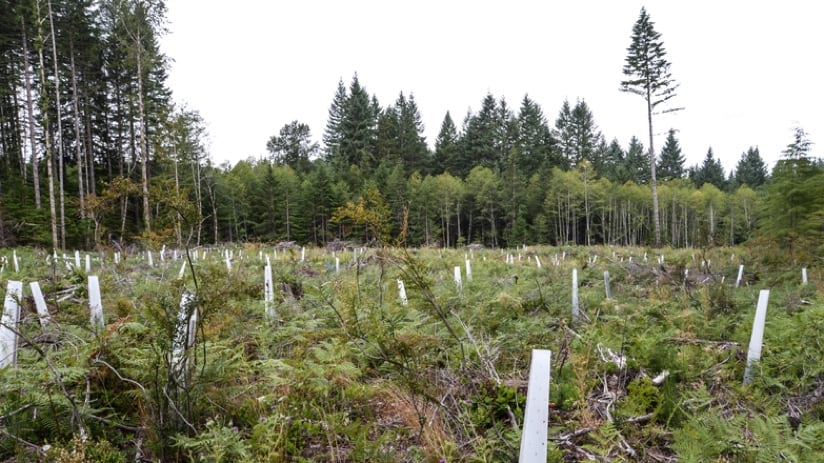
“We recognize that people derive a lot of really important things from forests,” Connolly said. “But products should not come from primary forests. They should come from previously logged areas. Sometimes people call this second growth.”
In the group’s primary focus area in northern BC, they found three valleys still intact and several more pockets across the landscape they feel are important to protect.
“We know that the biggest, oldest trees are at the most risk from logging, and we’ve heard that the forest companies have been using lidar to identify all the remaining old-growth forest in the Robson Valley, which is just east of here,” Connolly said. “The motivation for our map is to change policy and protect these places for the long term.”
Conservation North is focusing on the region known as Ltha Koh in the local language of the Dakelh people, which translates to Big Mouth River. This apt description covers an area that sits at the headwaters of the Fraser River, one of the longest river systems in the world.
“The Fraser River is a wild river, it’s never been dammed,” Connolly said. “Ltha Koh is a critical opportunity for protection.”
The volunteers with Conservation North hope their maps can change mindsets to foster broader conservation efforts and inspire industry or government leaders to reconsider approaches to forestry.
“There’s a pervasive belief within professional forestry that nature needs our help and that humans need to intervene to manage forests,” Connolly said. “The map challenges that belief system by showing unmanaged forests as having value on their own. Some places ought to be left alone.”
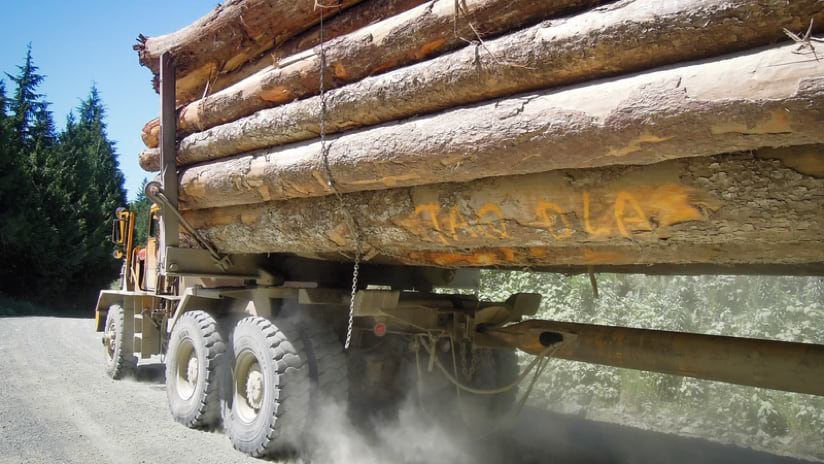
Much of the local industrial pressure in old-growth forests calls for large spruce trees to be harvested as lumber. While the team at Conservation North works to salvage the region’s biodiversity, they worry about losing plants and animals that can’t be replaced if ecosystems continue to degrade.
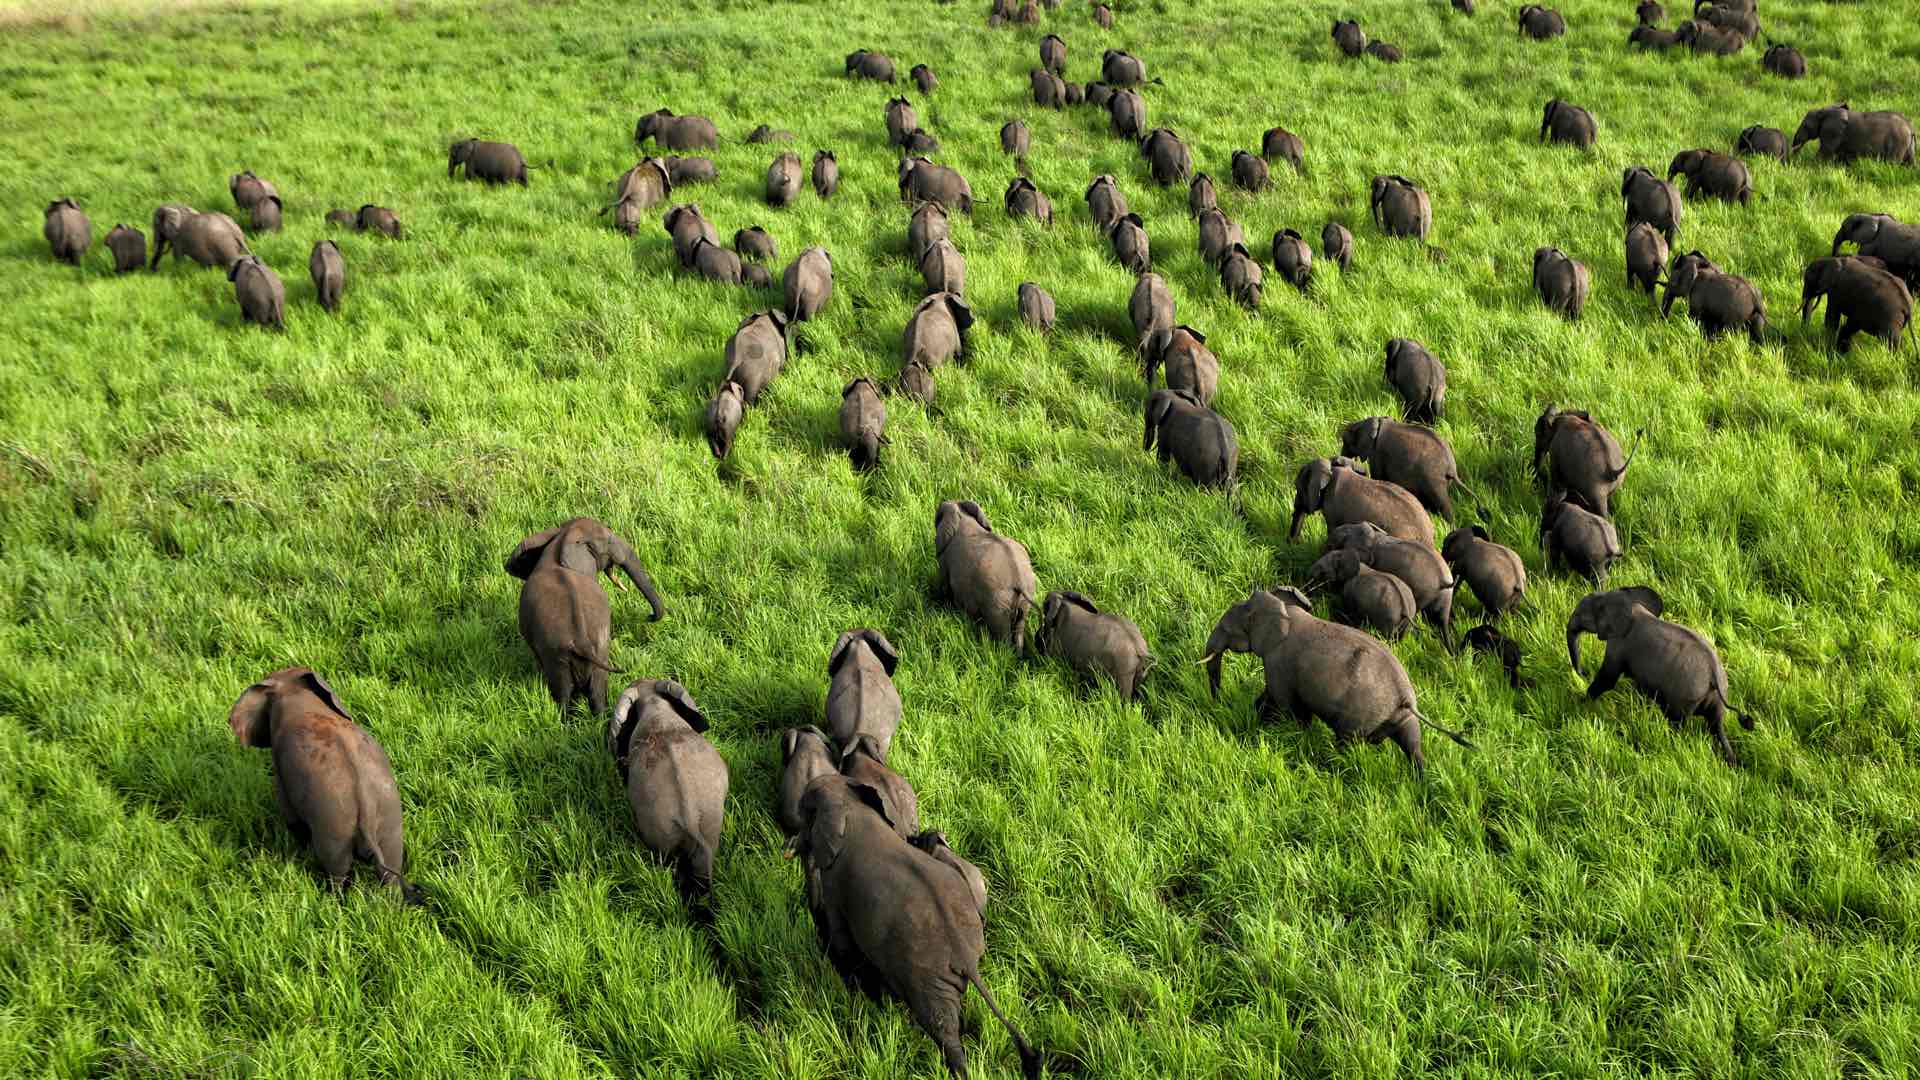
“We don’t have the towering coastal trees like Vancouver Island and California. We do have a natural rain forest in the interior, and our group was focused on that ecosystem, but we’ve realized that everything is under threat,” Connolly said. “We know that wildlife populations are collapsing across Canada. I’ve spoken with wildlife biologists who tell me that every species we’re bothering to measure is in decline.”
Public awareness of the biodiversity problem has been growing. And when Conservation North’s Seeing Red map was released, it drew a lot of attention.
“We knew at an intuitive level that industrialization has had a massive impact on the land in BC, but we didn’t have a way to see it or communicate it,” Connolly said. “Until we did this, no one had a bird’s-eye view of just what is left of natural forest in BC.”
People and groups from across the province got in touch to express their appreciation for the map.
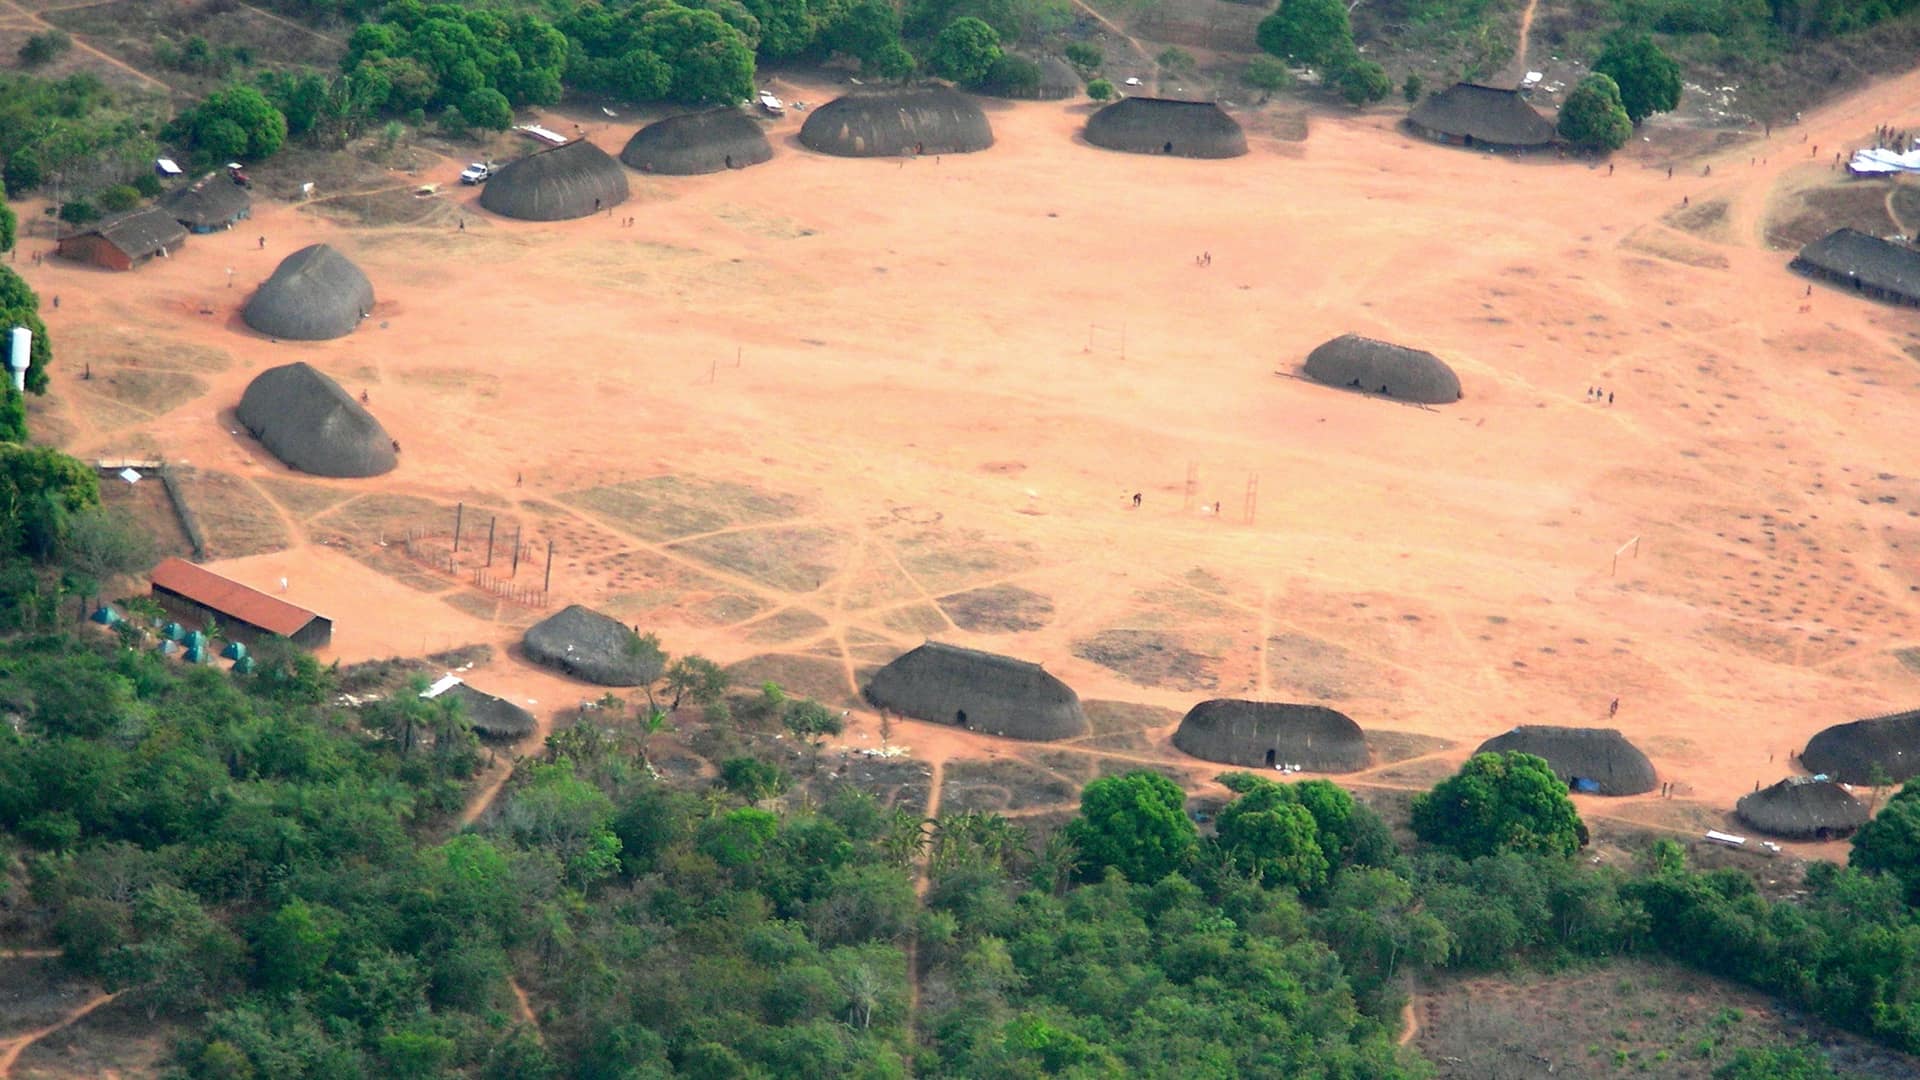
“We heard from community groups and First Nations communities who said the map had a real impact on their work because now they realize what they need to protect,” Connolly said. “We’re all coming from the perspective that what’s already been harmed should be where we harvest, keeping our footprint to those areas and leaving natural areas alone.”
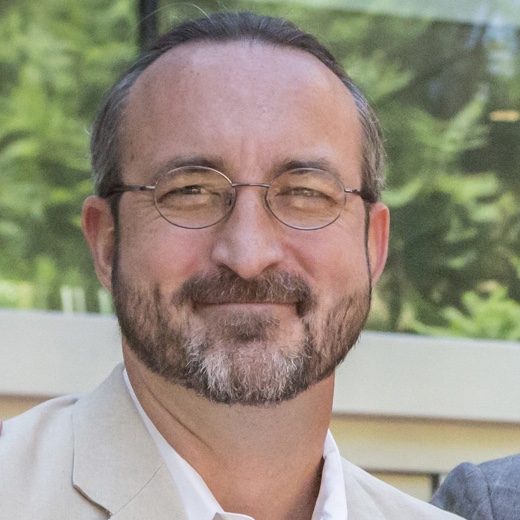
Suzanne Simard is the scientist at the University of British Columbia whose PhD thesis vaulted into the prestigious journal Nature in 1997, because her research “shows unequivocally that considerable amounts of carbon—the energy currency of all ecosystems—can flow from tree to tree, indeed, from species to species, in a temperate forest.” Connolly took Simard’s forest ecology course as an undergraduate, and like most who learn of the language of trees, it changed how she looks at the forest.
Simard’s work to understand forests continues, with a growing focus on resilience and adaptation to climate change. To advance this work for the health of forests and the planet, primary forests must first be preserved. That’s where the mapping work of Conservation North could be pivotal—showing where to harvest, protect, and renew—to promote greater carbon capture and biodiversity for both flora and fauna.
Discover other ways GIS is applied to respond to ecological crises.
September 18, 2019 |
August 18, 2020 |
October 9, 2018 |