

A server uptime report offers admins a way to view the status and availability of their servers. However, it can be time-consuming to create manual server uptime reports. The right uptime reporting tool can save your IT team time and hassle by measuring and displaying uptime metrics automatically. For a reliable uptime monitoring tool that covers all your bases, I recommend SolarWinds® Server & Application Monitor (SAM).
What Is Server Uptime Monitoring?
Uptime refers to the time your system is available for use as intended, and downtime is the time your system is stalled, shut down, or otherwise not working according to plan. Server uptime measures the percentage of time the server is available. Uptime doesn’t guarantee high levels of server performance, but a server outage report can help admins realize a problem exists and needs attention.
Since servers are critical IT infrastructure, it makes sense to establish as close to 100% uptime as possible. Uptime of 99.999% is the high-availability standard in many industries. Server uptime monitoring is the process of measuring the function and availability of your servers to show whether uptime meets your service level agreement (SLA) standard for high availability, whether it be 99.999% or less. In some cases, server uptime reports are critical for a business to prove compliance with its established SLAs.
How to Check Windows Server Uptime
There are several ways to manually check Windows server uptime, without an automated reporting system. These include:
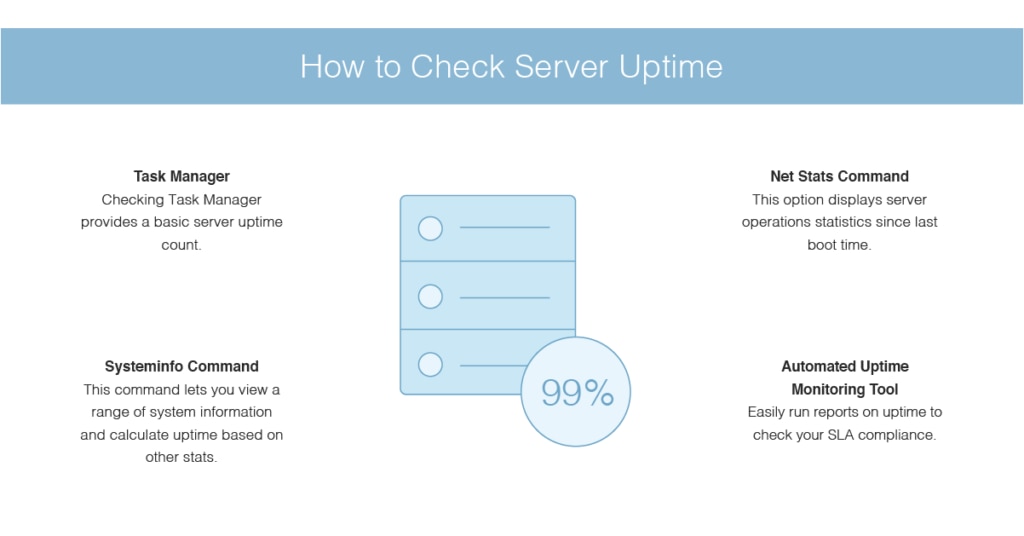
Task Manager
Probably the simplest way to manually check Windows server uptime is to open Task Manager, available on your Windows taskbar. Task Manager provides a basic count of your server uptime, in addition to rudimentary server metrics curves.
Systeminfo Command
The Systeminfo command on Windows allows you to view system information like boot time, installation date, and basic memory statistics. The Systeminfo command doesn’t directly calculate uptime, but you can calculate uptime based on your most recent boot time.
Net Stats Command
Through your command line, you can also view basic system statistics with the Net Stats command. Net Stats displays a list of server operations statistics since the time your last boot began.
Manually checking your uptime statistics can work if you have time to spare, but it’s a slow process and doesn’t provide the at-a-glance visibility admins need. Command-line statistics give you a snapshot of total uptime and basic server stats, but to troubleshoot without manual calculations and commands requires a comprehensive Windows server uptime report. With uptime reporting software, you can view uptime reports quickly, in a user-friendly dashboard, in the context of your server performance.
You can check out our list of best network uptime monitoring tools in this article.
Choosing an Uptime Monitoring Tool
Server uptime and downtime reporting tools allow you to automatically view server uptime and downtime and use templates to run a server down report as needed. What’s more, automated tools help put uptime/downtime levels in context with other server performance metrics, so you can more quickly troubleshoot problems and ensure servers both available and offering high performance.
Your uptime monitoring tool should offer accurate uptime and downtime reporting with a holistic approach to monitor the server components that might cause downtime. That’s why I suggest SolarWinds Server & Application Monitor.
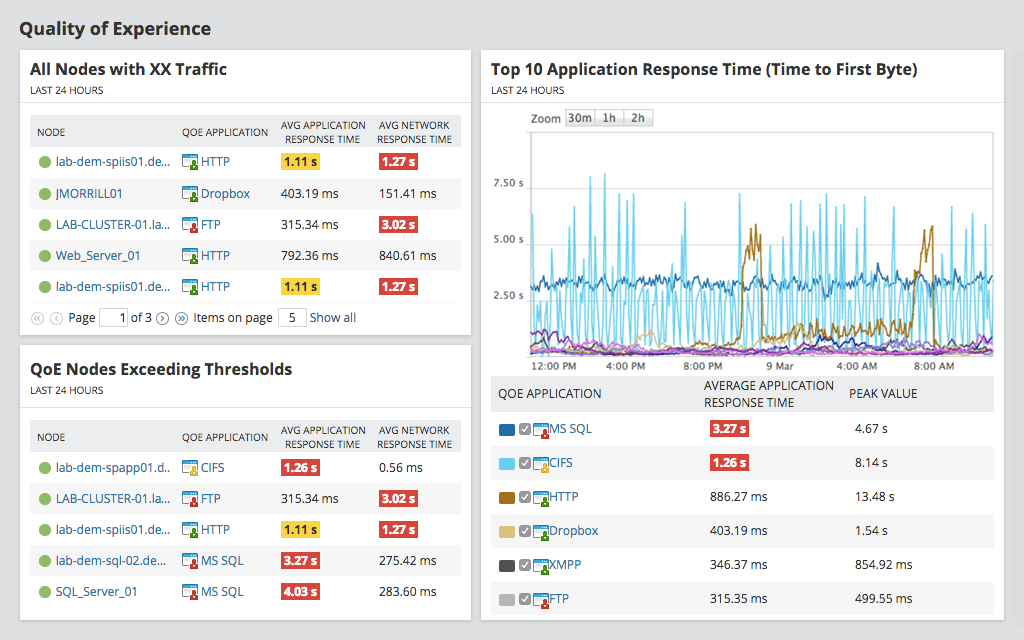
SAM offers a flexible uptime monitoring solution with application and hardware monitoring capabilities, so you don’t need to juggle multiple dashboards to diagnose the root cause of performance issues. With uptime insights, along with CPU, memory, disk performance, and other hardware health metrics, your SolarWinds SAM dashboard offers a useful overview of your server health. And, with hundreds of out-of-the-box app integrations, you can troubleshoot issues at the application level, too. For instance, you can easily generate uptime reports on Office 365 applications.
When your job is to ensure excellent IT performance and meet SLA expectations, you need a tool like SolarWinds SAM for automated uptime monitoring and reporting. Start with a free 30-day trial.