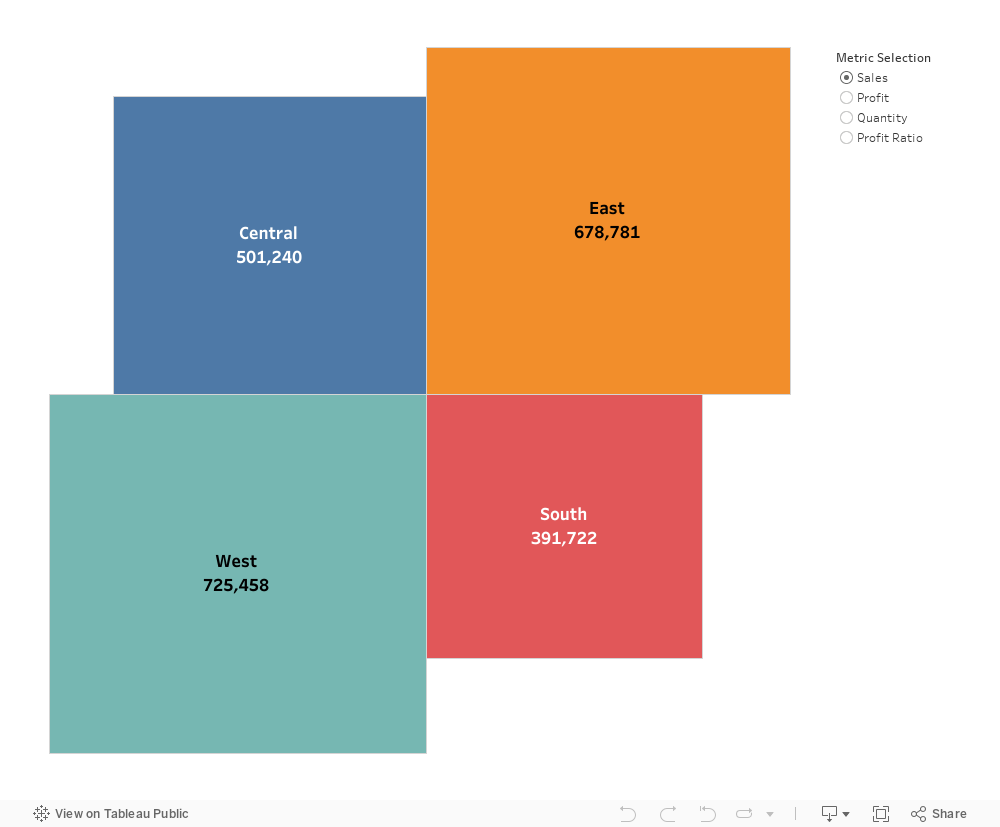
The idea of the chart is to show the information in four squares. It is especially best to be used when key information is to be shown.
The key to create the four square charts is to create both the Width and Height that is based on either Sales or other measures.
The other key is to select the fixed size on the Size under the Marks.
Below are the steps to create this visualization.
- Create the new tab named Four Quadrant
- Selected the Bar under the Marks
- Create this parameter
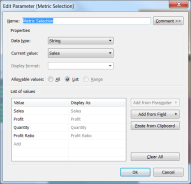
- Right click on it to show parameter
- Create the following calculated fields
- Profit Ratio
- SUM([Profit])/ SUM([Sales])
- Selected Metric
- CASE [Metric Selection]
WHEN “Sales” THEN [SumOfSales]
WHEN “Profit” THEN sum([Profit])
WHEN “Quantity” THEN SUM([Quantity])
WHEN “Profit Ratio” THEN [Profit Ratio]
END
- CASE [Metric Selection]
- Width
- CASE Min([Region])
WHEN ‘Central’ THEN -SQRT([Selected Metric])
WHEN ‘West’ THEN -SQRT([Selected Metric])
ELSE SQRT([Selected Metric])
END
- CASE Min([Region])
- Height
- CASE Min([Region])
WHEN ‘Central’ THEN SQRT([Selected Metric])
WHEN ‘East’ THEN SQRT([Selected Metric])
ELSE -SQRT([Selected Metric])
END
- CASE Min([Region])
- Min
- Min(0)
- Selected Metric Label
- CASE [Metric Selection]
WHEN “Sales” THEN [SumOfSales]
WHEN “Profit” THEN sum([Profit])
WHEN “Quantity” THEN SUM([Quantity])
END
- CASE [Metric Selection]
- Profit Ratio Label
- IF [Metric Selection]= “Profit Ratio”
THEN [Profit Ratio]
END
- IF [Metric Selection]= “Profit Ratio”
- Profit Ratio
- Drag Min to Columns and Height to Rows
- Drag Region to Color and Label
- Drag Width to Size
- Click on Size and select Fixed
- Drag Selected Metric Label and Profit Ration Label to Label
- Ensure there is no space between these two
Download this different size quadrant workbook here.
