Normal distribution: generation algorithm #2189
Comments
|
I wonder if we should be using It might need some experimentation to see quite how large we can go without getting floating pointed, it may be quite a ways under Double.MaxValue. But my intuition says it's much much larger than Int32.MaxValue |
I believe the problem could be that there is no Random method returning values between 1 and Edit: After some quick tests using |
|
I'd value your feedback on #2206, it's simpler and seems to be faster, but I'd like some reassurance that it gives the results you think it should. It looks like it should be correct to me, but I'd appreciate another set of eyes. |
|
Sure! |
Hey I can't see anything, did it maybe fail to send? |
Thanks again for everyone's input on this! I think it's in an okay state and merged it, but if there was an unresolved concern/idea we can open it up in a new PR 👍 |
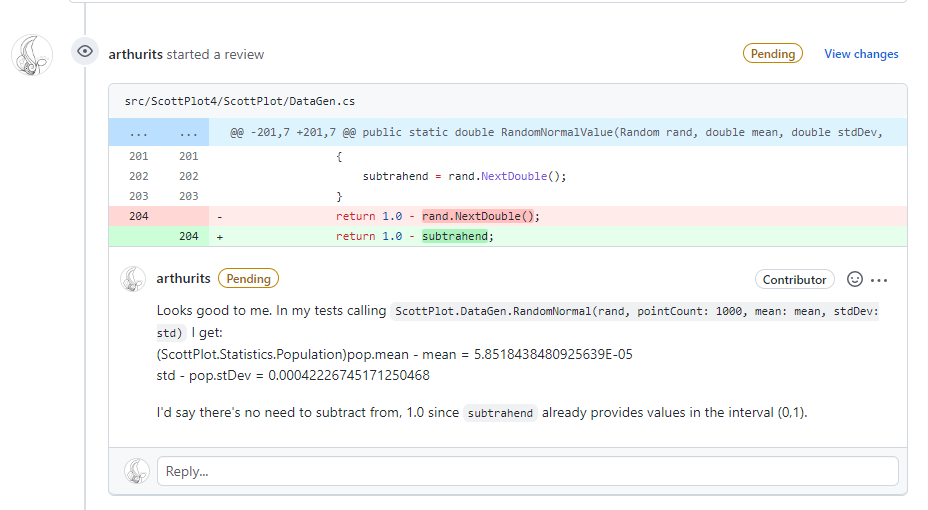
I'm not sure what happened but I probably messed something, although I can see it: The point was that there is no need for this: return 1.0 - subtrahend;since return subtrahend; |
|
Ah, since it says "Pending" it means it was part of a review, and it looks like you didn't complete the review (there's a menu with "Approve", "Request Changes", and "Reject" that you have to click on). Alternatively, you can leave a comment without starting a review, and then the comment will be applied immediately. At any rate thank you for noticing that, I guess I was a little bit on autopilot :/ |
|
My bad @bclehmann! I totally messed the whole comments/review options. I'll pay more attention the next time. |
I've been using functions
RandomNormalfromDataGen.csandPopulationfromPopulation.csin order to visualize the distribution of a given variableScottPlot/src/ScottPlot4/ScottPlot/Statistics/Population.cs
Lines 40 to 44 in 0be0921
I'm no expert whatsoever in statistical algorithms, but it seems that both functions make use of
RandomNormalValuewhere some kind of Box-Muller algorithm is implemented to generate gaussian numbers:ScottPlot/src/ScottPlot4/ScottPlot/DataGen.cs
Lines 195 to 200 in 0be0921
However, the gaussian data generated seems to be sistematically underestimated as shown below, where the grey vertical line represents the mean and the bell curve appears to be slightly offsetted to the left.

There's an article in Wikipedia where the Box-Mueller algorithm is explained. It states that
Suppose U1 and U2 are independent samples chosen from the uniform distribution on the unit interval (0, 1).
Since
Random.NextDouble()does in fact return the value 0, the current computation of bothu1andu2will eventually return some 1s.Therefore, I've been using the following modification of
RandomNormalValue:This modification provides a more visually mean-centered gaussian curve:

The text was updated successfully, but these errors were encountered: