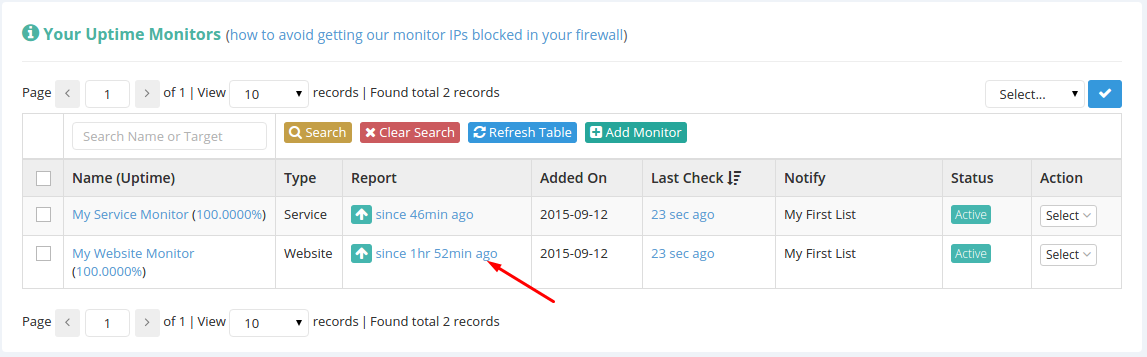
Accessing the uptime monitor report for any of your websites/services is done from the report link next to your website/service in your uptime monitors list.
The report page will look something like this.
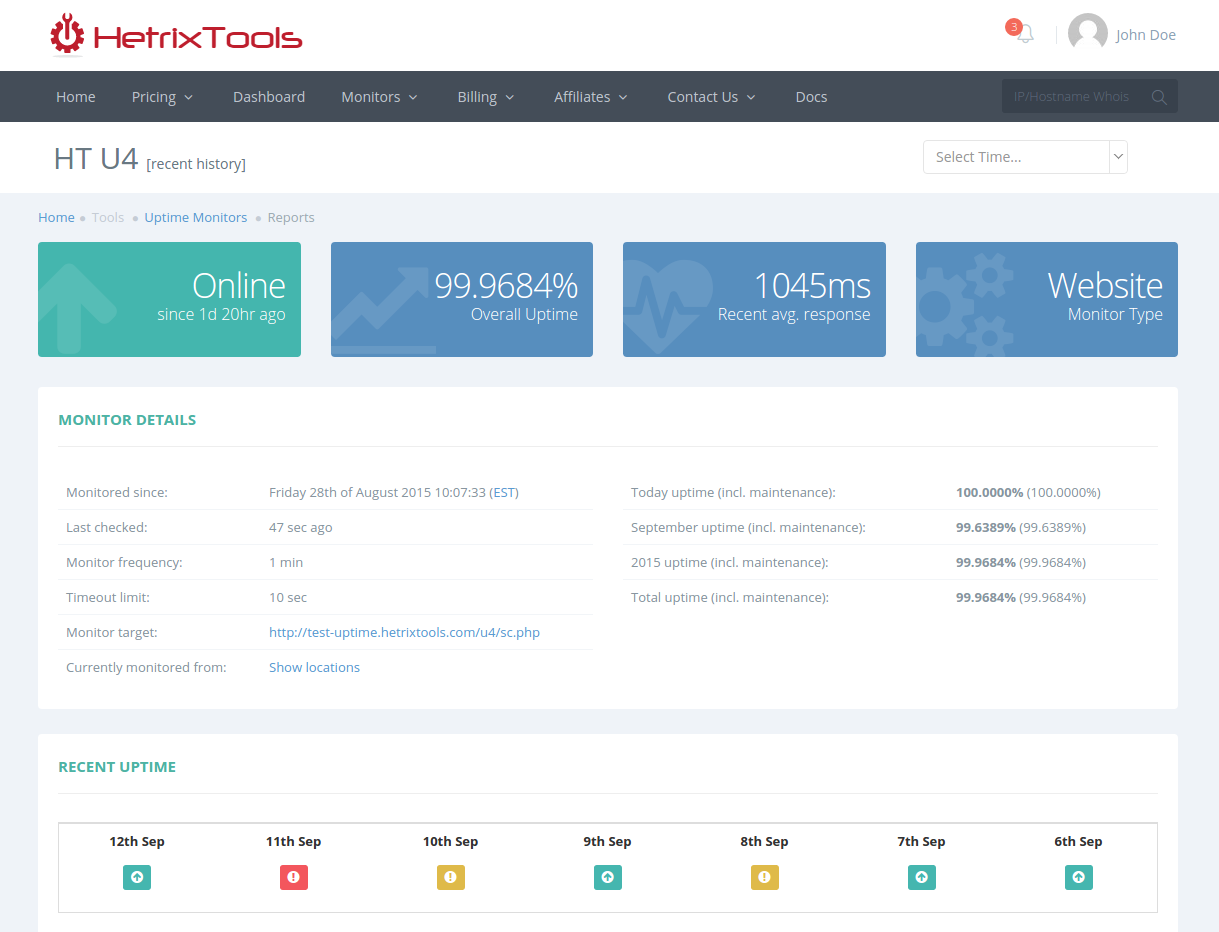
We’ll take each individual panel and explain it below.
- The header:
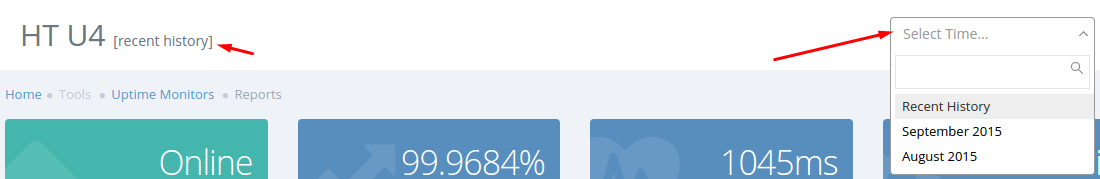
Contains your uptime monitor name, and the currently displayed history time frame in between brackets.
You’ll also find in the header a drop-down menu from where you can select any month that we’ve been monitoring your website/service or the recent history to be displayed.
Recent history displays data from the past 7 days.
- The widgets:

These contain as much data as possible at a quick glance.
The first widget shows the current status of your website/service and the period of time since the last status change.
The second widget shows the total uptime of your website/service.
The third widget shows recent or monthly average response time.
And the forth widget shows the type of monitor, either website or service.
- Monitor Details:
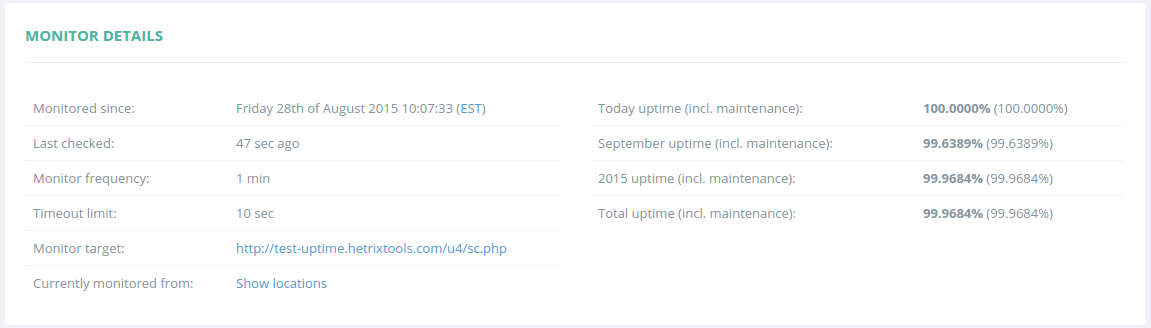
This panel shows some basic, yet critical information about the uptime monitor. The fields are pretty much self-explanatory, so we won’t go into any detail here.
One thing worth mentioning is that if you click the “Show locations” link from this panel, you can see the locations that have monitored the website/service in the selected time frame.
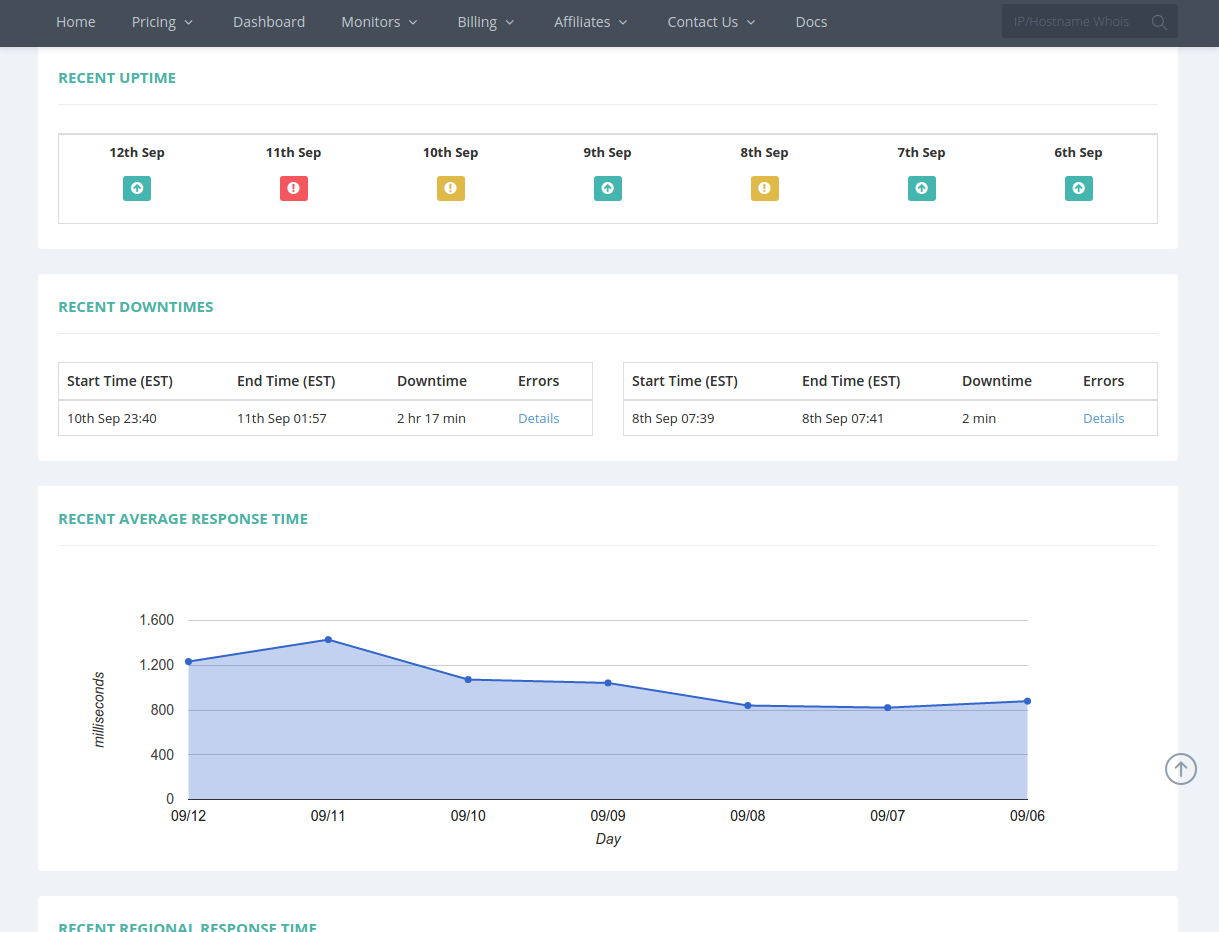
- Uptime Panel:
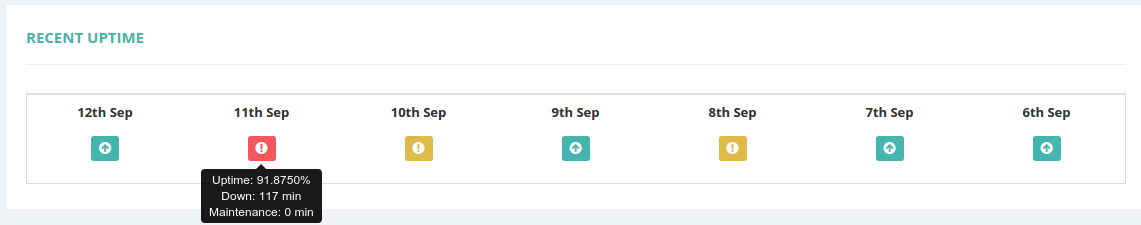
In this panel you can see at a quick glance the uptime status of the selected time frame, divided by days.
Each day has its own icon to display the status for that particular day. When hovering over the icon with your mouse, you can see further information.
When selecting a month from the header drop-down menu (and not the default Recent History), the Uptime Panel will contain all days within the selected month, not just the last 7 days.
- Downtimes Panel:
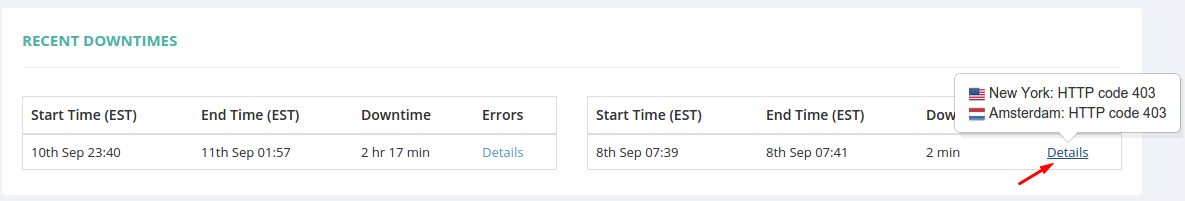
This panel will contain detailed info regarding all of the outages which occurred in the selected time frame, along with Details links of the errors encountered by our monitor locations.
- Average Response Time:
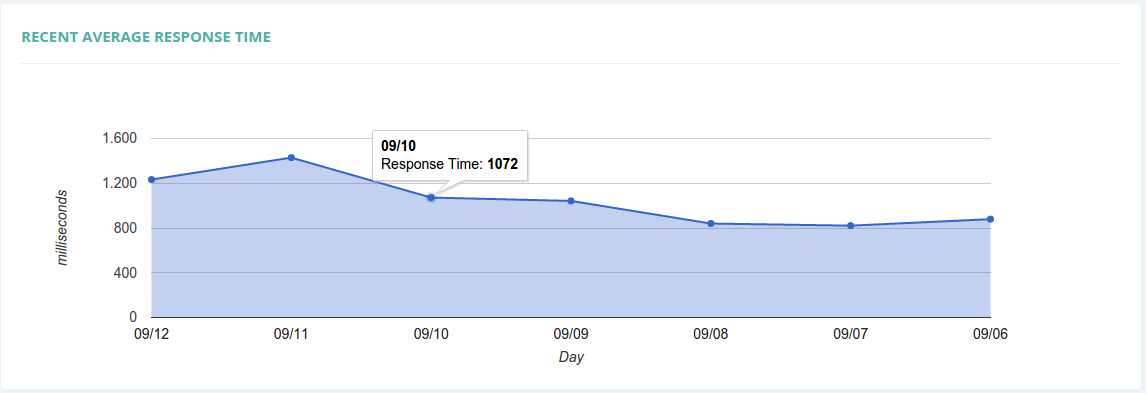
This graph contains the daily average response time of your monitored website or service. Hovering with the mouse over the dates will show additional information.
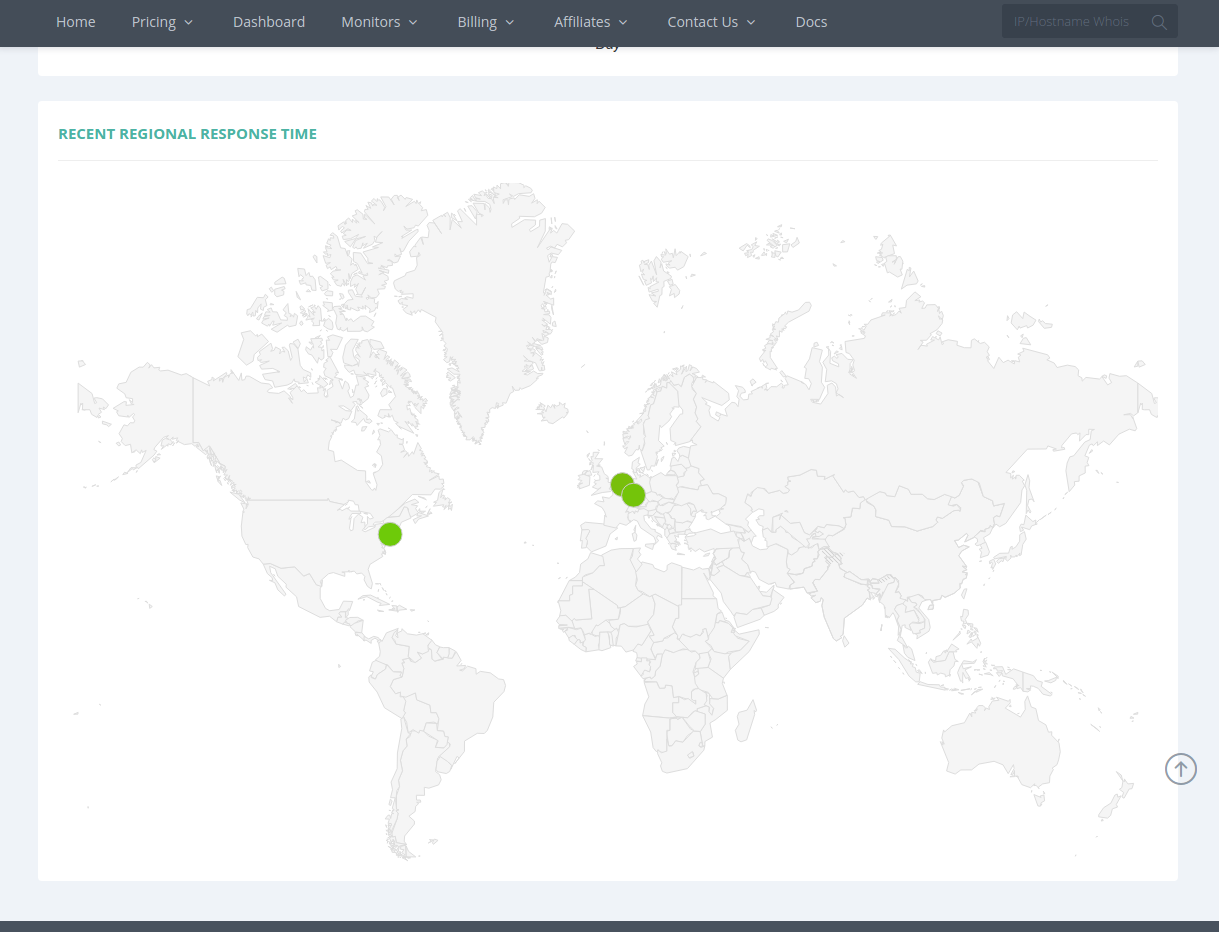
- Regional Response Time:
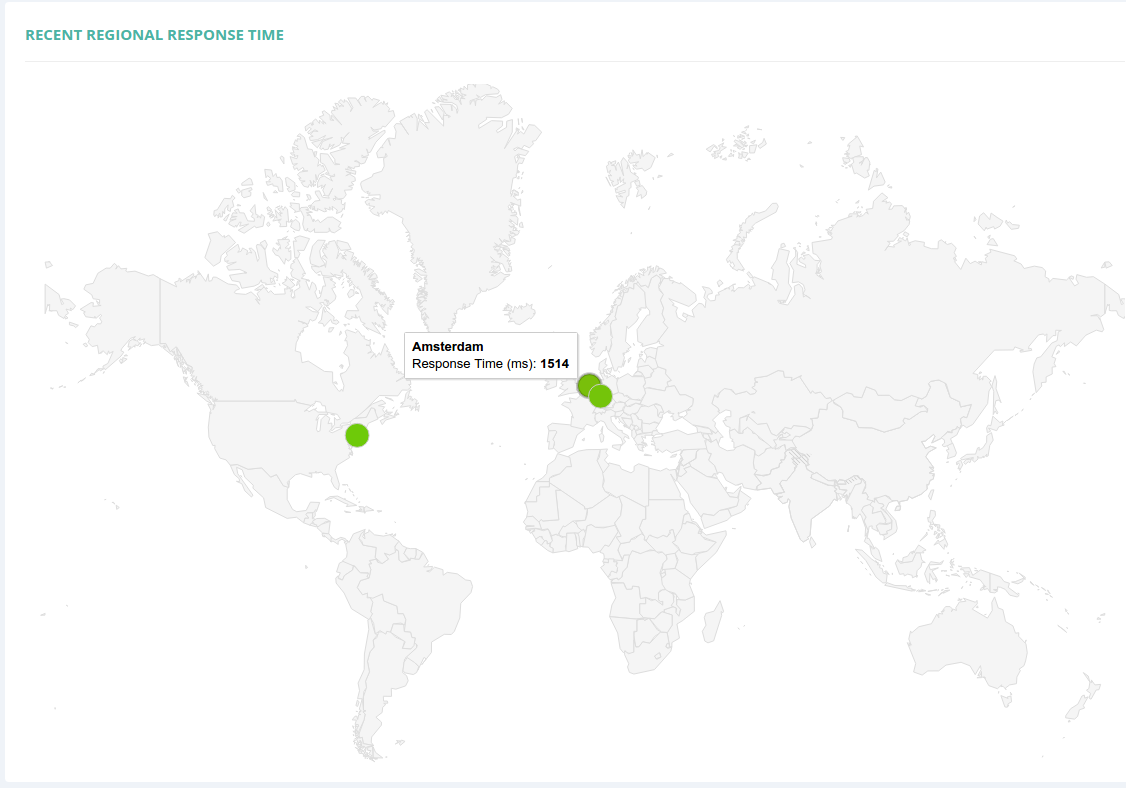
In this panel you can find the response time from every location that is monitoring your website or service, for the selected time frame.