In the past few weeks, Vancouver and the BC Lower Mainland have suffered not just one but three record-breaking rainstorms, a succession of ”atmospheric rivers” that dumped several hundred millimetres of rain. Highways washed out and disappeared, and numerous communities were flooded. This resulted in an enormous quantity of sediment reaching the sea via the Fraser and other local rivers. But where exactly does the sediment that’s already in the sea around Vancouver go? How has that changed in the past few hundred years since Europeans colonized the area? To get to the bottom of this, we enlisted Carlijn Meijers.
Last week, Carlijn successfully defended her thesis, ”Sediment transport pathways in Burrard Inlet”. To answer these questions, she created a detailed hydrodynamic and sediment transport model of Burrard Inlet and Georgia Strait in D-Flow FM. She then used the SedTRAILS model that we have developed to visualize sediment transport pathways.

From these models, Carlijn showed that sediment transport is largely controlled by flow through the First and Second Narrows (where the Lion’s Gate and Ironworker’s Memorial bridges cross). As the tide comes in, the water shoots through these narrow passages at speeds of up to 2 m/s and comes out the far side as a jet, spiraling off into eddies. The tide then goes out and the same happens in reverse, with water shooting out the opposite side.

Due to the sheltered nature of the inlet, waves have only a minor role in sediment transport. However, given the intensity of the tides and the great depths of Burrard Inlet (especially the Indian Arm fjord to the north), most sediment liberated by erosion tends to get carried away from shore and is essentially lost from the coastal sediment budget.
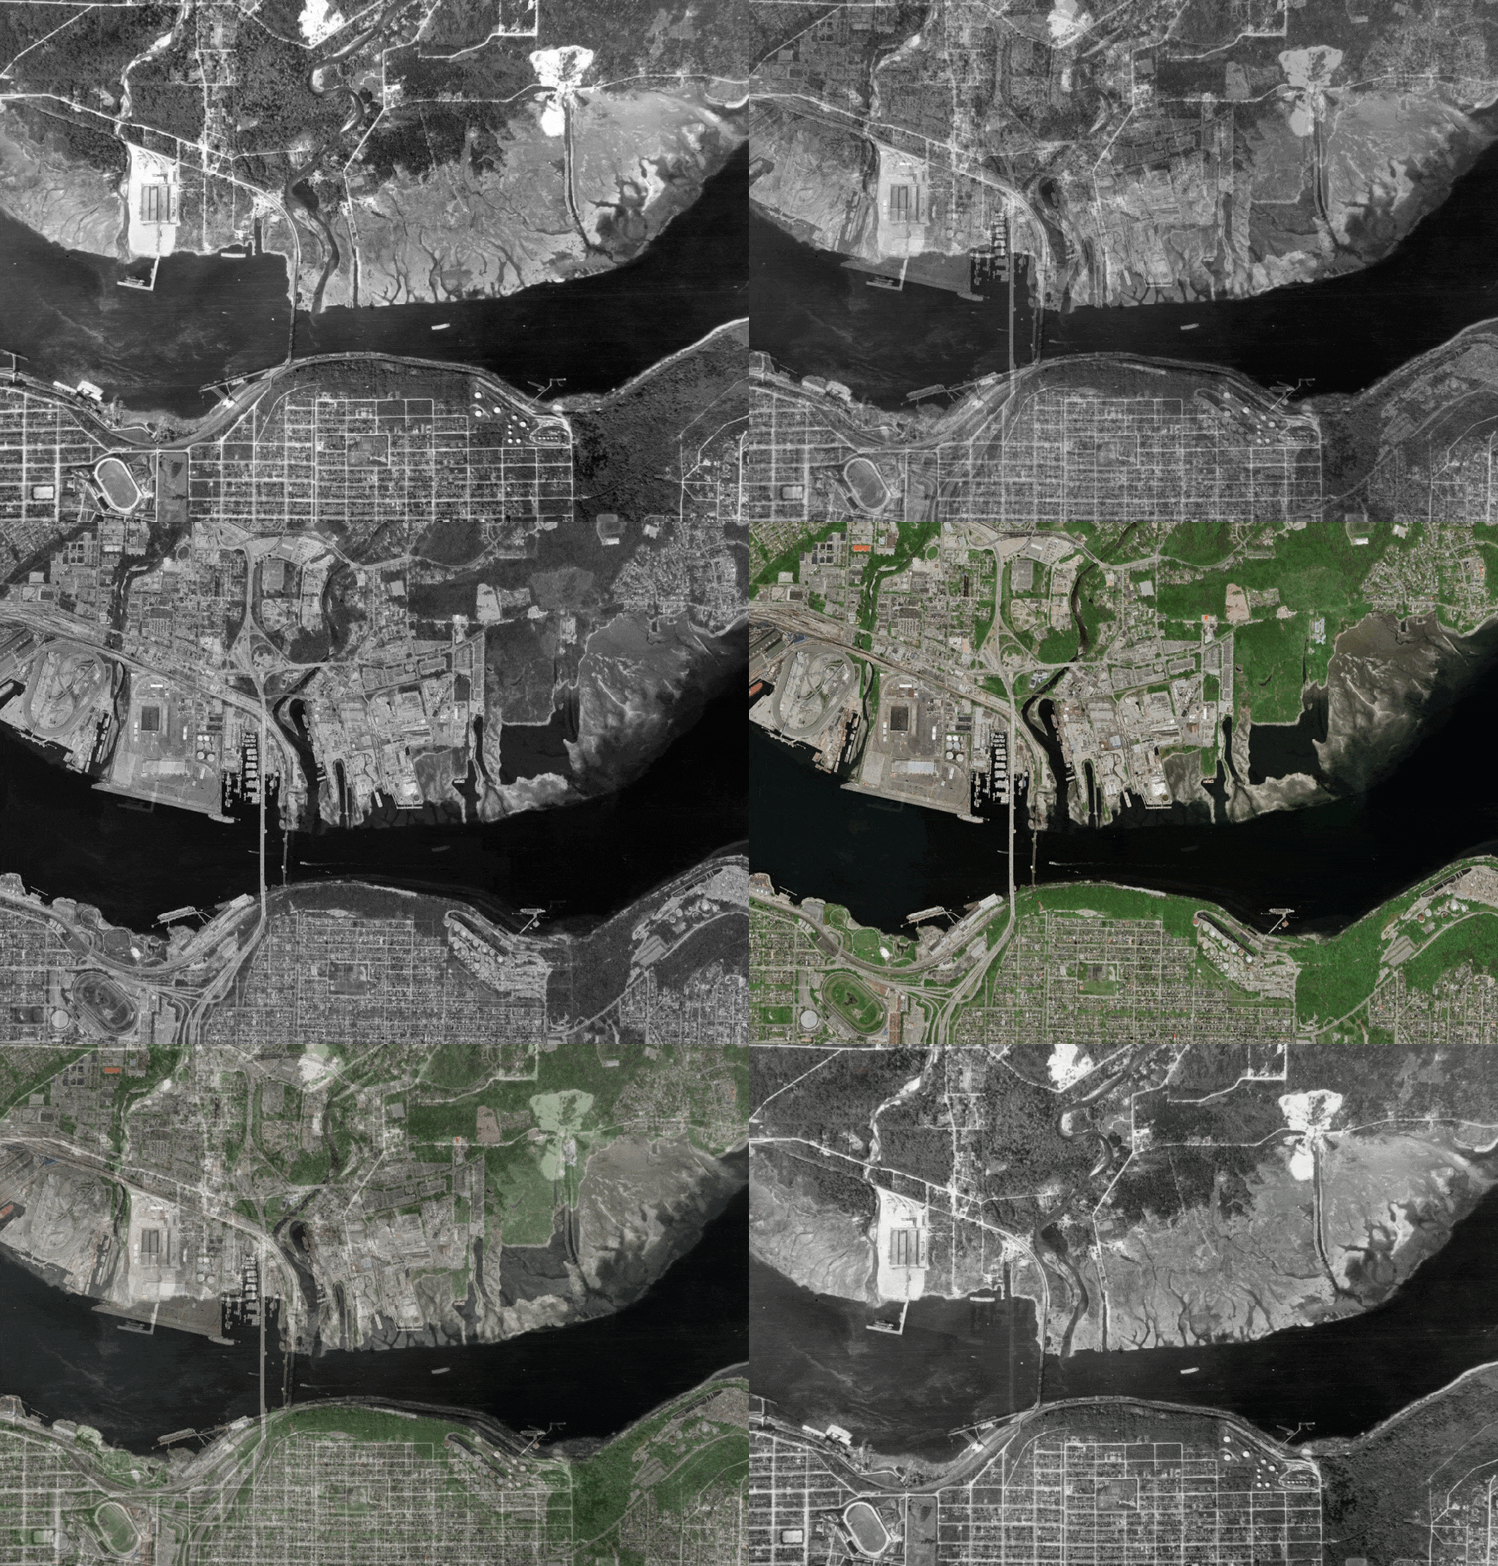
Another key point of her project was to investigate how land use changes and other human effects (e.g., damming rivers, port construction) have changed Burrard Inlet. Using the model, Carlijn showed that these changes to the inlet have shrunken its tidal prism, influencing the currents and sediment transport patterns.

These changes are especially evident when we compare satellite photos from the present day with the oldest available images from the 1940s.

Carlijn wrote an excellent report and capped it all off with one of the best master’s thesis defenses that I’ve seen in a long while. She also handled the cultural context of the project with great respect, interest, and sensitivity. If anyone reading this is looking to recruit a new engineer/researcher with heaps of potential, I cannot recommend Carlijn enough.
All in all, this was a fascinating project and one very close to my heart — I was born in the Vancouver area and was excited to see how the SedTRAILS model could be used in my original backyard. Let’s keep the Delft-Vancouver collaborations going!

